

Introduction
Obesity is widespread in the Kingdom of Saudi Arabia (KSA). According to the findings from previous studies, there is an increasing trend in the prevalence of obesity and overweight in the KSA 1,2. The National Nutrition Survey reported that the KSA is the 15th most obese country in the world, with an overall obesity rate of 33.7% 3. Research on the relationship between obesity and health problems has indicated that being overweight or obese might increase the risk of cardiovascular disease (CVD), diabetes mellitus (DM), cancer 2, and other diseases 4.
There are many factors that may influence the risk of obesity and other health-related problems. Dietary components are one of the most important factors that should be considered in obesity and health-related problem processes 5. In recent years, soft drinks and energy drinks have become the common dietary components and have become highly visible and controversial public health and public policy issues worldwide. Both drinks have been shown by many studies as major contributors to an increased risk of obesity and other related health problems and have consequently been targeted as a means to help curtail the increasing prevalence of obesity 6,7.
One method that has been used widely to decrease SD and ED consumption is a taxation system. The aim of this system is to reduce the consumption of high-calorie beverages and to shift from unhealthy to healthy choices by subsidizing healthier drinks such as fruit and vegetable juices; the system is also implemented for economic reasons 8,9. In 1930, Denmark was the first country to implement soft drink and juice taxation. After that, other countries used the same method, such as Finland and Hungary in 2011, France in 2012 10, Mexico in 2013 6, the United Kingdom in 2016 11, and Berkeley, California in 2014 12.
Trend studies indicate the high consumption of SDs and EDs among Saudis in different age groups in both sexes 13–16. The General Authority of Zakat and Tax (GAZT) is one of the main sectors responsible for the implementation and management of all taxation affairs in the KSA. In January 2018, the GAZT applied a 100% tax on energy drinks and a 50% tax on carbonated drinks such as soft drinks. In the present study, the main aim was to assess SD and ED consumption patterns and knowledge about the link between health-related problems and SD and ED consumption after taxation. In addition, we assessed the characteristics of those who consume both SDs and EDs and the public level of support for an added 50% tax on SDs and 100% tax on EDs. Finally, we examined the public anticipated reaction to taxes on SD and ED. The aim of this study is to provide new data related to SD and ED consumption after taxation.
Materials and Methods
Study Design
This was a descriptive cross-sectional study that assessed adults’ knowledge, attitudes and practices toward SD and ED taxation. This study was conducted in three different food markets (Carrefour, Hyper Panda, and Mandarin) in Al-Madinah Al-Munawara in Madinah from February to March 2020. The study was approved by the research committee of research ethics at the University of Taibah, KSA (Number SREC/AMS 2019/95/NAMS).
Sampling
A total of 384 adults (192 male and 192 female) aged 18-45 years were randomly selected and recruited to participate in the study. All the participants provided informed consent prior to the study. Only those participants who were willing to participate in the study were included. All underweight, pregnant and lactating subjects were excluded from the study. Participants were interviewed for 20 minutes using a questionnaire by trained students. A structured questionnaire was developed based on its reliability in previous studies 17,18. The questionnaire consisted of three sections: demographic characteristics, knowledge and attitudes about health-related problems associated with SD and ED consumption, and behaviors related to SD and ED consumption and taxation. Demographic characteristics included questions about sex (male, female), age in years (18-24, 25-39, 40-45), educational level (high school or less, some college, college graduate), physical activity (yes, no) and body mass index (BMI). BMI was computed as weight in kilograms and height in centimeters as weight/height2. According to the values provided by World Health Organization classification in 2006, subjects were classified as underweight (BMI≤ 18.0), normal (BMI= 18.5-24.9), overweight (BMI= 25.0-29.9), or obese (BMI≥ 30.0) 19.
Data Collection
To assess the level of knowledge and attitudes about the effect of SD and ED consumption on health-related problems, participants were asked if they were drinking soft drinks or energy drinks every day. Then, they were asked true or false statements about whether drinking SDs and Eds can cause obesity or diseases such as diabetes, tooth cavities, and if there is a link between obesity and heart problems, cancer, blood pressure, and asthma.
To assess attitudes about taxing SDs and EDs, participants were asked, “Do you think taxation at a rate of 100% on energy drinks and 50% on soft drinks impeded you from consuming them?” (yes or no), “Related to the previous question, do you think you lost some weight because you are not consuming these drinks?” (yes or no), ” Do you think that taxation on energy drinks and soft drinks leads you to drink other alternatives?” (yes or no), “If so, which kind of alternative do you drink?” (water, fresh juices, canned juices), “Do you think that it is important for the government to implement taxation on the goods that are harmful to health?” (yes or no), and “Do you support SD and ED taxation?” (yes or no).
Statistical Analysis
The Statistical Package for Social Sciences (SPSS Ins., Chicago, IL, USA) version 25 was used to enter and analyze the data on a personal computer. Descriptive analyses were conducted to examine the association between demographic data and SD and ED consumption by the chi-square test. Logistic regression analyses were used to evaluate the correlates of SD and ED taxation support while controlling for the covariates.
Results and Discussion
A total of 384 participants were included in the present study. The majority of participants (52%) did not consume SD and were male (51%) and aged from 18-24 years old. On the other hand, 65% of participants of both sexes reported not consuming EDs, and their ages were approximately 18-39 years old. Over 75% of SD and ED consumers were either students or recent graduates of college, not physically active and had normal body weight. Although education and BMI were significantly affected by both SD and ED consumption, age was only significant in regard to SD consumption (Table 1 and 2).
Table 1: Characteristics of the Participants Categorized based on SD.
| Variables | Soft Drink Consumers | p-value* | |
| N= 384315 | |||
| No | Yes | ||
| N (%) | N (%) | ||
| N | 197 (52%) | 187 (48%) | |
| Sex | |||
| Male | 100 (51%) | 89(47%) | 0.207 |
| Female | 97 (50%) | 98 (53%) | |
| Age | |||
| 18-24 | 107 (54%) | 88 (46%) | 0.176 |
| 25-39 | 73 (50%) | 73 (50%) | |
| 40-45 | 17(39%) | 26 (61%) | |
| Education | |||
| High school or less | 47 (43%) | 62 (57%) | 0.012 |
| Some college | 147 (55%) | 120 (45%) | |
| College graduate | 3 (60%) | 2 (40) | |
| Physical activity | |||
| Yes | 60 (53%) | 56 (47%) | 0.102 |
| No | 133 (50%) | 131 (50%) | |
| BMI | |||
| Normal | 96 (48) | 65 (52%) | 0.001 |
| Overweight | 29 (41%) | 112 (59%) | |
| Obese | 72 (36%) | 10 (64%) | |
* Significant at the 5% level of significance: p<0.05.
Table 2: Characteristics of the Participants Categorized based on ED Consumption.
| Variables | Energy Drink ConsumersN= 384 | p-value* | |
| NoN (%) | YesN (%) | ||
| N | 247 (65%) | 137 (35) | |
| Sex | |||
| Male | 130 (53%) | 68 (49%) | 0.320 |
| Female | 117 (47%) | 69 (50%) | |
| Age | |||
| 18-24 | 111 (56%) | 84 (44%) | 0.008 |
| 25-39 | 104 (70%) | 42 (30%) | |
| 40-45 | 32 (72%) | 11 (28%) | |
| Education | |||
| High school or less | 67 (61%) | 42 (39%) | 0.035 |
| Some college | 173 (65%) | 94 (35%) | |
| College graduate | 7 (88%) | 1 (12%) | |
| Physical activity | |||
| Yes | 80 (76%) | 26 (24%) | 0.250 |
| No | 167 (60%) | 111 (40%) | |
| BMI | |||
| Normal | 96 (57%) | 65 (43%) | 0.014 |
| Overweight | 91 (65%) | 50 (35%) | |
| Obese | 60 (68%) | 22 (32%) | |
* Significant at the 5% level of significance: p<0.05.
The study found that 52% and 65% of the participants did not consume SDs and EDs in the past week after taxation, which is not consistent with previous studies from the KSA before taxation; approximately 60% of participants consumed sweetened soft drinks either daily or usually, which indicated a consumption level far exceeding the amount consumed in Western populations 20–22. In fact, Benajiba et al 20 reported that consumption has increased over the past decade, with increasing rates leading to various health problems among individuals of different ages in the KSA.
The analysis confirmed that a high percentage of participants reported non-consumption of SDs after taxation, especially among both sexes, those who were 18-24 years old, college students, those who were not physically active, and those with a normal body weight. These results are consistent with the results of different target populations from different countries, such as the United States of America (USA) 7,17, the United Kingdom (UK) 23, and Brazil 24. All of these studies focused on testing the association between SD consumption and the risk of obesity and other health-related problems. Other studies focused on testing the association of soft drink taxes with purchases in different countries, such as the USA, the UK, Mexico, Catalonia, Chile, and France 25.
On the other hand, we found that a high percentage of participants reported that after taxation, males, those who were aged 18-24 years old, college students, those who were not physically active, and those who had normal and overweight body weight were not consuming EDs. Previous research is consistent with the results except more males were not consuming EDs than females 21 because males usually consume EDs more than females; however, due to the taxation of 100% of the original price, males reduced their intake, or they may have become more knowledgeable about the effects of EDs on health.
The analysis of consumers’ knowledge of health-related problems associated with high consumption of SDs and EDs is shown in Fig 1. Over 90% of the participants believed that high consumption of SDs and EDs increased the risk of chronic disease, high blood sugar, obesity, and tooth cavities. A high percentage of the participants thought there was a link between obesity and heart problems, and over half of the participants thought there was an association between obesity and asthma and between obesity and cancer; the corresponding percentages were 90%, 58% and 50%, respectively.
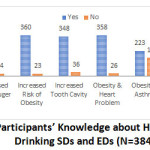 |
Figure 1: Participants’ Knowledge about Health Effects of Drinking SDs and EDs (N=384). |
When participants interviewed, they were asked about their attitude about SD and ED taxation; 69% stated that taxation on these beverages impeded their consumption, but 54% of them reported they did not lose any weight. Sixty percent of the participants reported that they drank other alternatives due to taxation on SDs and EDs, and water was the top alternative (56%), followed by fresh juices (29%) and canned juice 15%. Furthermore, 89% of the participants believed that the government should implement taxation on foods and beverages that are harmful to health (Table 3).
Table 3: Participants’ Attitudes about SD and ED Taxation (N=384).
| Questions | Answers | N (%) |
| Q1: Do you think taxation at a rate of 100% on energy drinks and 50% on soft drinks impeded you from consuming these beverages? | Yes | 263 (69%) |
| No | 121 (31%) | |
| Q2: Related to the previous question, do you think you lost some weight because you are not consuming these drinks? | Yes | 174 (46%) |
| No | 210 (54%) | |
| Q3: Do you think that taxation on energy drinks and soft drinks has led you to drink other alternatives? | Yes | 227 (60%) |
| No | 157 (40%) | |
| Q4: If so, which kind of alternative do you drink? | Water | 212 (56%) |
| Fresh juices | 113 (29%) | |
| Canned juices | 59 (15%) | |
| Q5: Do you think that it is important for the government to implement taxation on the goods that are harmful to health? | Yes | 340 (89%) |
| No | 44 (11%) |
The analysis of participants’ attitudes toward health-related problems of obesity and SD and ED consumption indicated that most of the participants were aware of the adverse effects of excessive consumption of SDs and EDs. These results may indicate improvements in Saudis’ health knowledge, especially regarding the effects of SDs and EDs on obesity-related health problems. We believe that this improvement in the health knowledge of the participants may have occurred due to the hard work and effort of health education specialists in both government and private sectors 26 over the last decade. These sectors included hospital settings 26 and other agencies such as the Saudi Food and Drug Authority in Saudi Arabia 27, the Saudi Center for Disease Prevention and Control 28, and professional associations in healthcare, which provide health education activities and programs that focus on providing ways to live a healthy lifestyle and improve the quality of life.
Stepwise multiple regression with adjusted odds ratios was performed, and the results are shown in Table 4 and Table 5. Overall, 56% of participants supported the implementation of a tax on SDs, with the greatest support among those aged 40-45, those with a higher level of education, and those who were overweight or obese (P<0.05). In addition, 60% of participants supported the implementation of a tax on EDs, with the greatest support among those aged 25-39 and those who were overweight or obese (P<0.05).
Table 4: The Odds Ratios of Support for Taxation on SDs by Demographic Characteristics.
| Model† | N (%)216 (56%) | OR | 95% CI for adjusted OR* | |
| Lower | Upper | |||
| Sex | ||||
| Male | 101 (46%) | 1.0 | References | |
| Female | 115 (54%) | 1.29 | 0.780 | 2.13 |
| Age | ||||
| 18-24 | 112 (52%) | 1.0 | References | |
| 25-39 | 78 (36%) | 0.782 | 0.317 | 1.93 |
| 40-45 | 26 (12%) | 0.719** | 0.300 | 0.920 |
| Education | ||||
| High school or less | 61 (29%) | 1.0 | References | |
| Some colleges | 151 (70%) | 0.380 | 0.038 | 10.340 |
| College graduate | 4 (1%) | 0.835** | 0.231 | 0.914 |
| BMI | ||||
| Normal | 12 (6%) | 1.0 | References | |
| Overweight | 93 (42%) | 0.361** | 0.015 | 0.684 |
| Obese | 111 (52%) | 0.512** | 0.023 | 0.715 |
† Model was adjusted for sex, age, income, education, and BMI.
* Significant at the 5% level of significance: p<0.05. OR: odds ratio; CI: confidence interval.
Table 5: The Odds Ratios of Support for Taxation on EDs by Demographic Characteristics.
| Model† | N (%)227 (60%) | OR | 95% CI for adjusted OR | |
| Lower | Upper | |||
| Sex | ||||
| Male | 112 (50%) | 1.0 | References | |
| Female | 115 (50%) | 1.736** | 1.072 | 2.813 |
| Age | ||||
| 18-24 | 121 (53%) | 1.0 | References | |
| 25-39 | 83 (37%) | 0.232** | 0.120 | 0.912 |
| 40-45 | 23 (10%) | 0.698 | 0.733 | 0.933 |
| Education | ||||
| High school or less | 62 (28%) | 1.0 | References | |
| Some college | 159 (70%) | 0.945 | 0.158 | 5.664 |
| College graduate | 6 (2%) | 0.941 | 0.163 | 5.439 |
| BMI | ||||
| Normal | 117 (51%) | 1.0 | References | |
| Overweight | 100 (45%) | 0.486** | 0.022 | 0.507 |
| Obese | 10 (4%) | 0.769** | 0.036 | 0.858 |
† Model was adjusted for sex, age, income, education, and BMI.
* Significant at the 5% level of significance: p<0.05. OR: odds ratio; CI: confidence interval.
The results showed that due to taxation, most of the participants reduced their SD and ED consumption, and they replaced SDs and EDs with water. These results were consistent with the results from different countries, such as Fiji, Samoa, Nauru and French Polynesia 29, the USA 30, and Mexico 31. Most of these studies focused on questions regarding cross‐price elasticity, that is, how would an increase in SD and ED prices affect the consumption of non‐SDs and non-EDs? In addition, no studies have determined how consumers choose alternative beverage options to quench their thirst in place of SDs and Eds 32. Only one study in 2007 estimated the net reduction in daily energy intake of not consuming SDs and EDs. They suggest that replacing SD and ED consumption with either water, diet drinks, or other caloric beverages reduced daily energy intake by 9 kcal/day, 6 kcal/day, and 1 kcal/day for each unit of SD and ED consumption, respectively 33.
The strength of the present study is that the sample size was calculated based on the method described by Krejcie & Morgan 34, which makes the present study population unique and appropriate for investigating the knowledge, attitudes, and behaviors regarding SD and ED taxation in Al Madinah Al-Munawara. This study was the first to estimate the consumption of SDs and EDs after taxation. This study has several limitations. We could not determine a causal link between the impact of SD and ED taxation and other variables due to the cross-sectional study design. The data collection was based on self-reporting, which may increase the concern of underestimating because it has been reported that people underestimate their sugary food and beverage intake 35. Finally, the predict that the actual impact of taxation is clear because it has already been implemented, but we could not compare the consumption before and after taxation because there were no available data to compare among adults in Al Madinah Al-Munawara in Madinah.
Conclusion
In terms of the main outcome, the evidence generally indicated low consumption of SDs and EDs among participants. We detected a substantial shift in the consumption of SDs and EDs reflected by reduced consumption and increased consumption of other alternatives. Additionally, most of the participants understood the beneficial effect of the removal of SDs and EDs from their diet, which may represent an appropriate public health message to support those interested in preventing weight gain as well as diseases. Moreover, a positive association between supporting SD and ED taxation and demographic characteristics of participants indicated higher health literacy, which is important for people because it affects their capacity to make decisions and take action to manage their health. These findings are subject to confirmation by further analysis among different age groups and in both sexes among adolescents and children.
Acknowledgment
The author would like to thank all subjects for their enthusiastic participation in the study.
Funding Sources
The author received no financial support for the research, authorship, and/or publication of this article.
Conflict of Interest
The author has no conflict of interest.
References
- M Alqarni SS. A Review of Prevalence of Obesity in Saudi Arabia. J Obes Eat Disord. 2016. doi:10.21767/2471-8203.100025.
CrossRef - DeNicola E, Aburizaiza OS, Siddique A, Khwaja H, Carpenter DO. Obesity and public health in the Kingdom of Saudi Arabia. Rev Environ Health. 2015. doi:10.1515/reveh-2015-0008.
CrossRef - Wartella EA, Lichtenstein AH, Allen LH, et al. Front-of-Package Nutrition Rating Systems and Symbols: Promoting Healthier Choices.; 2011.
- Nigro E, Scudiero O, Monaco ML, et al. New insight into adiponectin role in obesity and obesity-related diseases. Biomed Res Int. 2014. doi:10.1155/2014/658913.
CrossRef - Huang TTK, Kempf AM, Strother ML, et al. Overweight and components of the metabolic syndrome in college students. Diabetes Care. 2004. doi:10.2337/diacare.27.12.3000
CrossRef - Lobstein T. WHO | Reducing consumption of sugar-sweetened beverages to reduce the risk of childhood overweight and obesity. World Heal Organ. 2014.
- Fletcher JM, Frisvold D, Tefft N. Can soft drink taxes reduce population weight? Contemp Econ Policy. 2010. doi:10.1111/j.1465-7287.2009.00182.x
CrossRef - Federal Reserve Bank of Chicago. , “Who would be affected by soda taxes?” , No. . Fed Lett. 284.
- Roberts M. Call for soft drink sugar tax in Budget: BBC News. BBC News Health.
- ECSIP (16 July 2014). Food taxes and their impact on competitiveness in the agri-food sector. Eur Comm. 2014;2365745:27–30.
- Scarborough P, Adhikari V, Harrington RA, et al. Impact of the announcement and implementation of the UK Soft Drinks Industry Levy on sugar content, price, product size and number of available soft drinks in the UK, 2015-19: A controlled interrupted time series analysis. PLoS Med. 2020. doi:10.1371/journal.pmed.1003025
CrossRef - Falbe J, Thompson HR, Becker CM, Rojas N, McCulloch CE, Madsen KA. Impact of the Berkeley excise tax on sugar-sweetened beverage consumption. Am J Public Health. 2016. doi:10.2105/AJPH.2016.303362.
CrossRef - Bakhotmah BA. Nutritional Knowledge and Desire to Change of Food Preferences among Saudi Women in Jeddah, Saudi Arabia. Ecol Food Nutr. 2012;51(4):313-328. doi:10.1080/03670244.2012.691388.
CrossRef - Al-Fares MN, Alsunni AA, Majeed F, Badar A. Effect of energy drink intake before exercise on indices of physical performance in untrained females. Saudi Med J. 2015. doi:10.15537/smj.2015.5.11141.
CrossRef - Aljaloud S. Use of Energy Drinks Among College Students in Saudi Arabia. Am J Sport Sci. 2016. doi:10.11648/j.ajss.20160403.11.
CrossRef - Hammad LF, Benajiba N. Lifestyle factors influencing bone health in young adult women in Saudi Arabia. Afr Health Sci. 2017. doi:10.4314/ahs.v17i2.28.
CrossRef - Rivard C, Smith D, McCann SE, Hyland A. Taxing sugar-sweetened beverages: A survey of knowledge, attitudes and behaviours. Public Health Nutr. 2012. doi:10.1017/S1368980011002898.
CrossRef - Sharma A, Hauck K, Hollingsworth B, Siciliani L. The effects of taxing sugar-sweetened beverages across different income groups. Heal Econ (United Kingdom). 2014. doi:10.1002/hec.3070
CrossRef - World Health Organization. BMI classification. Pharmacotherapy. 2006. doi:10.1001/archinte.1996.00440040101011.
CrossRef - Benajiba N, Eldib RS. Exploring attitudes related to sweetened soft drinks consumption among adults in Saudi Arabia. Nutr Food Sci. 2018. doi:10.1108/NFS-01-2018-0020.
CrossRef - Musaiger A, Zagzoog N. Knowledge, attitudes and practices toward energy drinks among adolescents in Saudi Arabia. Glob J Health Sci. 2014. doi:10.5539/gjhs.v6n2p42.
CrossRef - Johansson AK, Johansson A, Birkhed D, Omar R, Baghdadi S, Carlsson GE. Dental erosion, soft-drink intake, and oral health in young Saudi men, and the development of a system for assessing erosive anterior tooth wear. Acta Odontol Scand. 1996. doi:10.3109/00016359609003554.
CrossRef - Briggs ADM, Mytton OT, Kehlbacher A, Tiffin R, Rayner M, Scarborough P. Overall and income specific effect on prevalence of overweight and obesity of 20% sugar sweetened drink tax in UK: Econometric and comparative risk assessment modelling study. BMJ. 2013. doi:10.1136/bmj.f6189.
CrossRef - Claro RM, Levy RB, Popkin BM, Monteiro CA. Sugar-sweetened beverage Taxes in Brazil. Am J Public Health. 2012. doi:10.2105/AJPH.2011.300313
CrossRef - Griffith R, O’Connell M, Smith K, Stroud R. The evidence on the effects of soft drink taxes. Inst Fisc Stud. 2015.
- Al-Hashem A. Health education in Saudi Arabia: Historical overview. Sultan Qaboos Univ Med J. 2016. doi:10.18295/squmj.2016.16.03.004.
CrossRef - Hashan H, Aljuffali I, Patel P, Walker S. The Saudi Arabia Food and Drug Authority: An Evaluation of the Registration Process and Good Review Practices in Saudi Arabia in Comparison with Australia, Canada and Singapore. Pharmaceut Med. 2016. doi:10.1007/s40290-015-0124-4.
CrossRef - Centers for Disease Control and Prevention. CDC – Data and Statistics, Autism Spectrum Disorders – NCBDDD. Center for Disease Control.
- Thow AM, Quested C, Juventin L, Kun R, Khan AN, Swinburn B. Taxing soft drinks in the Pacific: Implementation lessons for improving health. Health Promot Int. 2011. doi:10.1093/heapro/daq057.
CrossRef - Yoshida Y, Simoes EJ. Sugar-Sweetened Beverage, Obesity, and Type 2 Diabetes in Children and Adolescents: Policies, Taxation, and Programs. Curr Diab Rep. 2018. doi:10.1007/s11892-018-1004-6.
CrossRef - Arantxa Cochero M, Rivera-Dommarco J, Popkin BM, Ng SW. In Mexico, evidence of sustained consumer response two years after implementing a sugar-sweetened beverage tax. Health Aff. 2017. doi:10.1377/hlthaff.2016.1231.
CrossRef - Claire Wang. Impact of Sugar‐sweetened Beverage Taxes on Purchases and Dietary Intake: Systematic Review and Meta‐analysis.; 2010.
- Stookey JD, Constant F, Gardner CD, Popkin BM. Replacing sweetened caloric beverages with drinking water is associated with lower energy intake. Obesity. 2007. doi:10.1038/oby.2007.359.
CrossRef - Krejcie R V., Morgan DW. Determining Sample Size for Research Activities. Educ Psychol Meas. 1970. doi:10.1177/001316447003000308.
CrossRef - Bingham SA, Gill C, Welch A, et al. Comparison of dietary assessment methods in nutritional epidemiology: weighed records v . 24 h recalls, food-frequency questionnaires and estimated-diet records . Br J Nutr. 1994. doi:10.1079/bjn19940064.
CrossRef

This work is licensed under a Creative Commons Attribution 4.0 International License.