

Introduction
Obesity is a global health problem, and its prevalence is increasing from year to year throughout the world. The prevalence of obesity increased from 7% in 1980 to 12.5% in 2015 or increased by almost 80% over the past 35 years (1). In 2016, 39% of the global population aged 18 years and over were overweight, with a total of 13% of the adult population worldwide being obese (2). In Indonesia, the overweight prevalence in 2018 only increased by 0.1 % from 2013 (3,4). However, the surge in the prevalence of obesity in the adult group in 2018 was 6.4%, which became 21.8% in five years (3,4).
The rising prevalence of obesity becomes a concern due to its contribution and impact on various other diseases, especially catastrophic diseases such as diabetes, high blood pressure, and cardiovascular disease (5). Obesity increases the risk of developing diabetes mellitus through a mechanism of the chronic increase in lipid levels that may damage pancreatic beta cells and cause insulin resistance (6). Obesity also increases blood pressure through increased renal tubular reabsorption, disruption of the sodium excretion in urine, and volume expansion in the kidney (7). The contribution of obesity to cardiovascular disease, among others, is through the mechanism of proinflammatory mediators in obese people that causes oxidative stress on vascular walls, inflammation, and endothelial dysfunction that triggers atherosclerosis (8).
The determinant factors of obesity are complex. Food intake, physical activity, lifestyle, environmental characteristics, and genetic are the determinant factors in studies conducted in developed countries (9). Urbanization, lifestyle changes, socioeconomic status, and food security play an important role in increasing obesity rates in developing countries (10,11). Based on the adaptation of UNICEF’s conceptual framework, it is explained that obesity is a direct result (immediate level) of health behaviors, such as food intake, physical activity, and biological conditions (e.g., genetics). In the UNICEF framework, basic causes of obesity consist of household food security (food environment), work practices and parenting (social environment), access to health services (health environment), and environmental conditions (living environment). Meanwhile, the root of the problem (basic level) consists of education, knowledge, poverty, and political conditions of the country (12).
Complex obesity problems require the right policies, and thereby the policies can play an important role in the efforts to decrease the prevalence of obesity. Obesity-related policies that have been implemented in several countries are the provision of healthy foods (e.g., vegetables and fruits), taxes for unhealthy foods, reformation of food assistance programs, environmental engineering to increase physical activity, and community health promotion (13,14). These policies have different levels of effectiveness in various places (13).
Public policy needs to be directed towards resolving public health problems that occur based on their causes (15). This article examined the determinant factors of overweight and obesity in Indonesia. The results obtained then become the basis for identifying policies in support of reducing the prevalence of overweight and obesity in Indonesia.
Material and Method
The data used in the analysis consisted of the consumption of grains, tubers, animal source foods, oils and fats, oily fruits and seeds, legumes, sugar, vegetables, fruits, and energy (16), food and non-food expenditure (17), the average study duration (18), poor population (19), the proportion of people with low physical activity, and the proportion of overweight and obese people (3). The data used were the 2018 data in 33 provinces in Indonesia.
Food consumption data (g/capita/day) were assessed from the amount of food consumption prepared in the household, the consumption of processed food or snacks, and other consumption (16). The total energy intake of the population was the amount of energy intake from food, which was then calculated through the multiplication between the amount of food consumed and the energy content of each type of food (16). The total expenditure per capita was the total food and non-food expenditure. The food expenditure was assessed by calculating food consumption over the past week while the non-food expenditure was calculated during the past month and the past year. The food expenditure and non-food expenditure were converted into average monthly expenditure. The share of food expenditure was the ratio of food expenditure to the population’s total expenditure for a month. The share of food expenditure was used as a variable that described household food security (17).
Data regarding food consumption, food and non-food expenditure, the average study duration, and poor population were obtained from the Indonesia’s National Socioeconomic Survey (SUSENAS) which included a total sample of 300,000 households contained in census blocks implemented in all provinces in Indonesia by Statistics Indonesia (20). Data concerning the proportion of people with low physical activity and the proportion of overweight and obese people were obtained from the National Basic Health Research (RISKESDAS) using 300,000 household samples and the same census block as SUSENAS (3). The data quality was guaranteed through the validity and reliability of SUSENAS and RISKESDAS data through the survey protocols conducted (21,22).The variable data in this research were openly available, which were obtained from the website of the Ministry of Health of the Republic of Indonesia, the Ministry of Agriculture of the Republic of Indonesia, and Statistics Indonesia.
The average study duration described an indicator of the population’s knowledge levels calculated from the average period of formal education that was being undertaken or had been undertaken by the people aged 25 years and over (18). The percentage of poor people was assessed from the number of people with the monthly average per capita expenditure below the poverty line (19). The proportion of the population with low physical activity was the proportion of population aged ≥10 years with low physical activity, while the proportion of overweight and obesity was the number of adults aged >18 years with a body mass index (BMI) of ≥25 kg/m2 (3). The people had low physical activity if they performed physical activity less than five days or less than 150 minutes a week (3).
The linear regression analysis was performed to determine the factors affecting overweight and obesity in Indonesia. The regression model met the conditions of linearity, normality, heteroscedasticity, and autocorrelation. The value of the VAT variable in the model was less than ten (23). The variables involved in the final multiple regression model were the food consumption (grains, animal source foods, oil and fat, oily fruits and seeds, legumes, sugar, vegetables, fruits, and energy), the proportion of the population with low physical activity, the share of food expenditure, the average study duration, and the proportion of the poor population. The poor people were those with a monthly average per capita expenditure below the poverty line of IDR 401,220 (19).
The obesity prevention policies were analyzed by conducting a literature review on articles, grey literature, policy documents available on the Google search engine, IPB University repository, and the related website of ministry for documents in the Indonesian language. PubMed, ScienceDirect, and MEDLINE were used to find supporting articles in English. The policies were sought based on the determinant factors for overweight and obesity that were found to be significant in this study. It was to provide an overview of how the applied policies were in accordance with the actual problems faced, which were significantly related to the incidence of overweight and obesity in Indonesia.
The method of policy analysis used the Five-E approach that consisted of effectiveness (how good the policy could work to achieve the goal), efficiency (the number of activities and financing related to the policy undertaken), ethical considerations related to the unintended ethical and moral consequences, evaluations of alternatives (other approaches that need to be considered in existing policies), and establishment of recommendations for positive changes (the recommendations given to provide positive changes in the existing situation) (24)
Results
Determinants of Overweight and Obesity
The proportion of overweight and obesity in Indonesia was 35.4 %, with the proportion of the population with low physical activity of 33.5 %. The average consumption of staple food in Indonesia for rice and tubers were 317.7 g/capita/day and 48.0 g/capita/day, respectively. The consumption of animal source food of the population was 126.4 g/capita/day while the consumption of oil and fat was 27 g/capita/day. The average energy intake of the population was 2055 kcal, with the average consumption of vegetables, fruits, and sugar of 136.7 g, 91 g, and 23.1 g, respectively. The average study duration of Indonesian people was 8.4 years, with a share of food expenditure of 50.8 % and the percentage of poor residents of 9.8 % (Table 1).
The results of the bivariate analysis revealed that the consumption of animal source foods (p=0.001), the consumption of oil and fat (p=0.006), the proportion of people with low physical activity (p=0.01), the average study duration (p=0.001), total per capita expenditure (p= 0.000), food and non-food expenditure (p=0.000), and the share of food expenditure (p=0.005) had significant effects on the proportion of adulthood overweight and obesity in Indonesia (Table 1).
Table 1: Results of the bivariate analysis on determinants of overweight and obesity in Indonesia
| Variable | Average (SD) | p |
| Proportion of overweight and obesity (%) | 35.4% | |
| Proportion of people with low physical activity (%) | 33.5 | 0.01* |
| Consumption of grains (g/capita/day) | 317.7 (38.9) | 0.22 |
| Consumption of tubers (g/capita/day) | 48.07 (55.6) | 0.92 |
| Consumption of animal source foods (g/capita/day) | 126.4 (24.7) | 0.001* |
| Consumption of oil and fat (g/capita/day) | 27.0 (4.3) | 0.006* |
| Consumption of oily fruits and seeds (g/capita/day) | 4.7 (2.9) | 0.89 |
| Consumption of legumes (g/capita/day) | 20.2 (7.6) | 0.47 |
| Consumption of sugar (g/capita/day) | 23.1 (4.8) | 0.94 |
| Consumption of vegetables (g/capita/day) | 136.7 (22.1) | 0.11 |
| Consumption of fruits (g/capita/day) | 91.0 (23.1) | 0.86 |
| Energy intake (kcal/capita/day) | 2055 (352) | 0.23 |
| Average study duration (years) | 8.4 (0.9) | 0.001* |
| Food expenditure (IDR) | 594,000 (123,493) | 0.001* |
| Non-food expenditure (IDR) | 576,000 (175,925) | 0.000* |
| Total per capita expenditure (IDR) | 1,169,000 (286,550) | 0.000* |
| Share of food expenditure (%) | 50.8 | 0.005* |
| Percentage of poor population (%) | 9.8 | 0.07 |
The results of the multivariate analysis using the multiple regression analysis indicated that only oil and fat consumption had a significant positive effect (p=0.02) on the proportion of overweight and obesity. The vegetable intake had a significant negative effect (p=0.03) on the proportion of overweight and obesity after being adjusted for other variables in the model (Table 2).
Table 2: Results of multivariate analysis on the determinants of overweight and obesity in Indonesia
| Model | B (95% CI) | sig |
| Consumption of grains (g) | -0.04 (0.10;0.09) | 0.19 |
| Consumption of animal-based food (g) | 0.03 (-0.10;0.16) | 0.65 |
| Consumption of oil and fat (g) | 0.69 (0.15;1.22) | 0.02* |
| Consumption of fruits and oily seeds (g) | -0.19 (-0.95;0.56) | 0.60 |
| Consumption of beans (g) | 0.07 (-0.26;0.40) | 0.65 |
| Consumption of sugar (g) | -0.41 (-0.92; 0.09) | 0.10 |
| Consumption of vegetables (g) | -0.12 (-0.23; -0.01) | 0.03* |
| Consumption of fruits (g) | -0.001 (-0.096; 0.093) | 0.97 |
| Energy intake (kcal) | 0.004 (-0.001; 0.009) | 0.15 |
| Proportion of residents with less activity (%) | -0.35 (-0.76; 0.10) | 0.12 |
| Share of food expenditure (%) | -0.40 (-0.95;0.15) | 0.14 |
| Average school period (years) | 2.38 (-0.19; 4.94) | 0.07 |
| Percentage of poor residents (%) | 0.32 (-0.11; 0.76) | 0.14 |
Policies concerning the Prevention and Management of Overweight and Obesity
The analysis results of the determinants of overweight and obesity in Indonesia showed that the consumption of oil and fat and the consumption of vegetables were significantly related to the high proportion of overweight and obesity. This relationship was independent of other variables involved in the multiple regression model. The current policies related to the efforts of reducing the proportion of overweight and obesity in Indonesian adults that are related to the vegetable intake and the consumption of oil and fat are the Healthy Community Movement (HCM or known as GERMAS in Indonesia) and the inclusion of sugar, salt, and fat content in food labels (Table 3).
GERMAS was outlined in the Presidential Instruction Number 1 of 2017 to accelerate and harmonize the promotive and preventive efforts related to healthy living in order to increase the population productivity and reduce the burden of health care costs due to diseases by increasing physical activity, enhancing healthy living behaviors, providing healthy food, accelerating nutrition improvement, improving the prevention and early detection of disease, improving environmental quality, and improving the education about healthy living (25). The implementation of GERMAS activities is adjusted to the duties, functions, and authorities of various ministries and institutions. The Ministry of Health campaigns for GERMAS, improves education on balanced nutrition, and makes guidelines for the Archipelago Movement to Reduce Obesity Rates (AMROR or known as GENTAS in Indonesia) (25,26). The Ministry of Agriculture makes efforts to increase domestic production of fruits and vegetables and encourages the use of home yards to grow vegetables and fruits. At the same time, the Ministry of Trade promotes healthy foods and beverages, including vegetables and fruits produced in Indonesia (25). The Ministry of Administrative and Bureaucratic Reform encourages the consumption of vegetables and fruit in the meetings, either inside or outside the office (25).
The GERMAS policy has not been effective in increasing vegetable intake and reducing obesity. In 2018, 95.4% of Indonesian people had low vegetable consumption (3). The proportion of adult obesity increased to 21.8%, and overweight increased to 13.6% compared to 2013 (14.8% and 11.5%, respectively) (3,4). The increase in obesity from 2013 to 2018 was much higher (7%), almost double compared to the increase that occurred from 2007 to 2013 (4.3%), whereas the reduction in obesity rate was targeted at 15.4% in 2019 (3,4,26).
GERMAS is funded by each ministry or agency based on funding from the state budget, local government budget, or other non-binding sources (25). GERMAS financing, as part of promotive and preventive efforts, is a form of curative financing efficiency through the health insurance program (27).
The habits of eating vegetables, oil, and fatty foods are closely related to the habits or culture of the local community (28,29). The generalization of campaign methods in different areas, including the communication media used, makes the messages difficult to receive and implement in the community (30). The ability of officers on the field to translate the GERMAS policy is one of the success factors of GERMAS activities (31). The number of health workers who become community assistants in conducting GERMAS activities is still lacking (31,32). The implementation of monitoring and evaluation to improve activities has also not been performed optimally (31,33). Promoting healthy activities (e.g., eating vegetables) and limiting fatty foods (e.g., in the GERMAS policy) based on the theory of evidence-based behavior change with different strategies in each region can be an alternative.
The garden utilization program to ensure the availability and access of vegetables in the household showed that the development of the yard for the cultivation of vegetables had been performed, but the sustainability of activities was low (34). Technical problems, assistance, and social culture of the people that did not support the program became the obstacles encountered in the program implementation (35,36).
The policy regarding the inclusion of salt, sugar, and fat contents in food labels was stipulated in the Regulation of the Minister of Health Number 30 of 2013 and Number 63 of 2015 concerning information on sugar, salt, and fat contents and the health messages for processed foods and fast foods, and the amendments (37,38). The policy aimed to provide the community with correct information about the food they consumed (38). In 2015, the people in the age groups of 15-24 years and >24 years who always read food labels were 33% and 67%, respectively (39). The ability to read food labels in Indonesia varies. A study on university students in Indonesia found that the percentage of students with low knowledge of food-label reading ranged from 2% to 89% (40–44), while the percentage among housewives ranged from 20% to 54% (45,46). Although the ability to read food labels was good, the nutritional information was the least noticed (44). The inclusion of fat information in food labels has financial implications, especially in the small industry group (47). The policy implementation regarding the information included on fast food should be followed by efforts to increase nutrition literacy to increase knowledge, skills, and motivation to read food labels. Strict monitoring needs to be enforced so that the entire food industry can comply with the policy (48,49). Monitoring of the inclusion of fat information on food labels has not been carried out optimally due to lack of human resources and measurement tools (50). The policy is still in conflict with the policies of the Ministry of Trade and the Ministry of Industry related to the ease of doing business and encouraging the community’s economy (50).
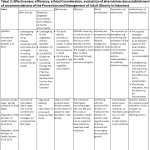 |
Tabel 3: Effectiveness, efficiency, ethical Consideration, evaluation of alternatives dan establishment of recommendations of the Prevention and Management of Adult Obesity in Indonesia |
Discussion
The proportion of overweight and obesity in Indonesia was 35.4%, close to the proportion of overweight and obesity in the global population (39%) (2). A total of 33.5% of the Indonesian population had low physical activity, and it increased from 2013 with a proportion of only 26.1% (4). The food intake of the Indonesian population was in accordance with the guidelines for balanced nutrition for the consumption of animal source foods (126.4 g), oil and fat (27 g), which consisted of 70-160 g for animal source foods and less than 67 g for oil and fat (51). Consumption of vegetables (136.7 g) and fruits (91 g) and were much higher than the recommendation of 250 g of vegetables and 150 g of fruits, while the sugar intake (23.1 g) was much higher than the recommendation (<10 g/day) (51). The share of food expenditure of the Indonesian population (50.8%) was classified as moderate (52), with the percentage of the poor population (9.8%) declined compared to the previous year (10.6%). The average study duration of the Indonesian population was still lower than the expectation of Indonesia’s 9-year primary education (53).
The bivariate analysis indicated that consumption of animal source foods, consumption of oil and fat, the proportion of the population with low physical activity, the average study duration, total per capita expenditure, food and non-food expenditure, and share of food expenditure had significant effects on the proportion of overweight and obesity in the adult group in Indonesia (p<0.05). This relationship changed after performing the multivariate analysis. Oil and fat consumption still had a significant positive effect on the proportion of overweight and obesity (p=0.02). The higher the consumption of oil and fat, the higher the proportion of overweight and obesity among the adult group in Indonesia. The consumption of vegetables had a significant negative effect on the proportion of overweight and obesity (p=0.03). The higher the vegetable consumption, the lower the proportion of overweight and obesity.
Oil and fat intakes were found to be associated with weight gain and the incidence of obesity in several studies. The mechanism of the relationship between fat and obesity was explained by the weight gain that was triggered by the oil intake, especially the long-chain saturated fatty acids found in palm oil (palmitate oil) (54). Palmitate oil triggers an increase in weight and fat accumulation in the liver and decreases the diversity of microbiota in the intestine that affects the lipid accumulation (55–57). However, several studies also showed that the effects of palmitate oil on weight gain and BMI had not been able to show strong evidence (58). Palm oil is the most widely consumed oil in Indonesian people, and it is processed into various kinds of fried food (3,17).
The vegetable intake affects the proportion of overweight and obesity in Indonesia, independent for other variables in the multivariate analysis. The meta-analysis studies in various countries showed the same relationship in which the high vegetable intake was protective against weight gain and obesity (59). Fiber and water contents in vegetables and fruits increase the volume of food without increasing calorie intake, and they increase the satiated feeling that can make people stop eating quickly (60–62). There was no association found between fruit consumption and the proportion of obesity in this study. The content of simple sugars in fruits that are different according to the type of fruits can trigger weight gain (63,64). However, further analysis of the effect of fruit types on overweight and obesity was not examined in this study.
The effects of vegetables on weight and obesity are different based on the amount of intake (59). The WHO recommended the vegetable and fruit intakes of 400 g a day, with a recommendation of vegetable intake at least 250 g a day based on Indonesia’s guidelines for balanced nutrition (51,65). The average vegetable intake of the Indonesian population is far below the prescribed recommendation (136.7 g) and thereby giving a higher risk of developing various types of diseases (e.g., hypertension, heart disease, and stroke) to the population (66).
Previous studies have shown that overweight and obesity in adults are significantly related to expenditure levels, physical activity, the share of food expenditure, and meat intake (67–70). Expenditure levels, physical activity, the share of food expenditure, and meat intake in this study significantly affect the proportion of overweight and obesity in a simple regression bivariate analysis. However, the significance faded after performing multiple regression analysis. The different associations found in this study and the previous studies can be caused by differences in confounding factors involved in the analysis.
The obesity prevention and management policies related to limiting the consumption of fat and oil and increasing vegetable intake in Indonesia through GERMAS and the inclusion of sugar, salt, and fat contents in food labels showed low effectiveness when observed from an increase in the proportion of overweight and obesity from the previous year. The promotion and preventive activities will be effective if the focus is on the behavioral changes based on the theory of behavioral change approach by using the strategies for the systematic behavioral change process, such as self-assessment, goal-oriented, adjusting individual character through individual or small group counseling, and paying attention to social supports from family or peer educators (71). Although the GERMAS policy is also conducted using a family approach, some areas still use general approaches that are less suitable to the diverse character of the local community (72). The implementation of GERMAS using the family approach has not been optimal due to constraints in the number and skills of human resources and regional conditions (32).
In Indonesia, the strategy to use the yard to grow vegetables still faces obstacles (35,36). In some countries, the home garden development program to grow vegetables shows good sustainability and effectiveness in increasing vegetable intake (73,74). This program has the potential to reduce the percentage of obesity (75). The success of the program is supported by the integration of the yard development program and regular nutrition education, accompanied by the problem-solving assistance in dealing with technical obstacles in planting (73,74).
The Food Label policy aims to protect consumers by providing the nutritional information needed to make food choices according to their requirements based on healthy dietary practices (76). The goal can be achieved not only if the community has sufficient knowledge, but it can also be influenced by other factors (e.g., psychological conditions) (77). In Indonesia, the motivation and ability to read the food labels are still varied. In general, the implementation of program policies in developing countries lacks the effectiveness evaluation studies, and thereby it is difficult to improve the activities performed (71).
In terms of efficiency, the GERMAS does not require massive funding with the type of activity reaching all levels of society. Studies on the effectiveness of financing the vegetable intake interventions, similar to GERMAS, have shown that information campaigns are the most cost-effective form of policy (78). The inclusion of nutritional information on the labels is also efficient for improving public health by saving on the health care system financing in other countries, such as America (79).
Obesity prevention and management policies still show various results. However, learning from various countries can be an alternative improvement and development of obesity prevention and management policies in Indonesia, related to the increased vegetable intake and limitation of fat consumption. The policy implementation that shows quite good effectiveness but still requires further studies is the policy concerning menu labeling in restaurants that affects the decrease in calorie intake, especially in the high socioeconomic status group (80,81). In the low-income group, the policy regarding the aid program reformation that includes vegetable vouchers in the aid increases vegetable consumption (82). The policy has the potential to be further studied in Indonesia, although the effectiveness of this policy on weight loss and obesity in adults has not been known.
This research provided an overview of the determinants of overweight and obesity in Indonesia and the implementation of the supporting policies in Indonesia that are important for the efforts to reduce the incidence of overweight and obesity. Several factors that might affect obesity (e.g., genetic and cultural influences) were not included in this research, and thereby the relationship between these factors and the proportion of overweight and obesity in Indonesia could not be explained further. Research with the use of large datasets using individual subjects needs to be conducted to confirm the research results and to describe the variation in the results of each region.
Conclusion
The consumption of vegetables, fat, and oil is a determinant of the proportion of overweight and obesity in Indonesia. Several policies have been executed as the efforts to prevent and overcome obesity related to the determinant, such as GERMAS policy and the inclusion of fat in the food labels. Improving the implementation of policies related to vegetable intake and limiting oil and fat needs to be carried out in line with the implementation of a global strategy for preventing and overcoming overweight and obesity such as increased physical activity. The recommendations for improving the policy implementation strategy are campaigns that need to be carried out based on the theory of behavioral change approach adapted to the local situation, follow-up monitoring and evaluation of the implementation of the program policies, and enhancement of nutrition literacy in reading food labels.
Acknowledgement
The authors would like to thank University of Tadulako, Indonesia for financial support for this publication.
Funding Source
The authors received financial support for the publication of this article from University of Tadulako, Indonesia.
Conflict of Interest
The authors declare no conflict of interest.
References
- Chooi YC, Ding C, Magkos F. The epidemiology of obesity. Metab – Clin Exp [Internet]. 2019 Mar 1;92:6–10. Available from: https://doi.org/10.1016/j.metabol.2018.09.005.
CrossRef - Obesity and Overweight [Internet]. 2020 [cited 2020 Apr 20]. Available from: https://www.who.int/en/news-room/fact-sheets/detail/obesity-and-overweight
- Riset Kesehatan Dasar. Jakarta: Badan Penelitian dan Pengembangan Kesehatan Kementerian Kesehatan Republik Indonesia; 2018.
- Riset Kesehatan Dasar. Jakarta; 2013.
- Segula D. Cmplations of obesity in adults: A short review of the literature. Malawi Med J. 2014;26(1):20–4.
- Day C, Bailey CJ. Obesity in the pathogenesis of type 2 diabetes. Br J Diabetes Vasc Dis. 2011;11(2):55–61.
CrossRef - Hall MRW and JE. Pathophysiology and Treatment of Obesity Hypertension [Internet]. Vol. 10, Current Pharmaceutical Design. 2004. p. 3621–37. Available from: http://www.eurekaselect.com/node/61933/article.
CrossRef - Marinou K, Tousoulis D, Antonopoulos AS, Stefanadi E, Stefanadis C. Obesity and cardiovascular disease: From pathophysiology to risk stratification. Int J Cardiol [Internet]. 2010;138(1):3–8. Available from: http://dx.doi.org/10.1016/j.ijcard.2009.03.135.
CrossRef - Hruby A, Manson JAE, Qi L, Malik VS, Rimm EB, Sun Q, et al. Determinants and consequences of obesity. Am J Public Health. 2016;106(9):1656–62.
CrossRef - Hwalla N, Nasreddine L, Labban S El. Cultural determinants of obesity in low- and middle-income countries in the Eastern Mediterranean Region. In: Energy Balance and Obesity IARC Working Group Reports [Internet]. International Agency for Research on Cancer (IARC); 2017. p. 39–40. Available from: https://www.semanticscholar.org/paper/Cultural-determinants-of-obesity-in-low-and-in-the-Hwalla-Nasreddine/f4db506f96c71bed3a4dca6e983a1d0185a674e6
- Ghattas H. Food Security and Nutrition in the context of the Global Nutrition Transition [Internet]. Rome; 2014. Available from: http://www.fao.org/economic/ess/ess-fs/voices/en/
- Haddad L, Cameron L, Barnett I. The double burden of malnutrition in SE Asia and the Pacific: Priorities, policies and politics. Health Policy Plan. 2015;30(9):1193–206.
CrossRef - Tseng E, Zhang A, Shogbesan O, Gudzune KA, Wilson RF, Kharrazi H, et al. Effectiveness of Policies and Programs to Combat Adult Obesity: a Systematic Review. J Gen Intern Med [Internet]. 2018/09/11. 2018 Nov;33(11):1990–2001. Available from: https://pubmed.ncbi.nlm.nih.gov/30206789.
CrossRef - Schmidhuber J. The Growing Global Obesity Problem: Some Policy Options to Address It. eJADE Electron J Agric Dev Econ [Internet]. 2004;1(2):272–90. Available from: http://www.fao.org/es/ESA/ejade/vol_1/cover_en.htm%5Cnhttp://search.ebscohost.
com/login.aspx?direct=true&db=ecn&AN=0833118&site=ehost-live - Willemsen M.C. Problem Identification and Agenda Setting. In: Tobacco Control Policy in the Netherlands. In: Palgrave Studies in Public Health Policy Research. Palgrave Macmillan, Cham. https://doi.org/10.1007/978-3-319-72368-6_10; 2018.
CrossRef - Kementerian Pertanian. Direktori Perkembangan Konsumsi Pangan Seri 19 Tahun 2019. Jakarta; 2019.
- Subdirectorate of Household Statistics. Consumption Expenditure of Population of Indonesia by Province: Based on The September 2018 Susenas. 2018. xii+136.
- [BPS] Badan Pusat Statistik. Indeks Pembangunan Manusia (IPM) Tahun 2018. 2019;(32):1–9.
- Profil Kemiskinan di Indonesia Maret 2018 [Internet]. Badan Pusat statistik. Jakarta; 2018. Available from: https://www.bps.go.id/pressrelease/2018/07/16/1483/persentase-penduduk-miskin-maret-2018-turun-menjadi-9-82-persen.html
- Central Statistic Indonesia. Guidelines for the Concept and Definition of Susenas March 2018. Jakarta; 2018.
- Health Research and Development Agency. Protocol Basic Health Survey. Jakarta; 2007.
- Central Statistic Indonesia. Susenas Enumerator Guidelines March 2018. Jakarta; 2017.
- Franke GR. Multicollinearity [Internet]. Wiley International Encyclopedia of Marketing. 2010. (Major Reference Works). Available from: https://doi.org/10.1002/9781444316568.wiem02066.
CrossRef - Kirst-Ashman KK. Introduction to Social Work and Social Welfare, Critical Thinking Perspective. Fifth. Boston: Cengage Learning; 2017.
- President of Indonesia. Laws of The Republic Indonesia No 1/ 2017 [Internet]. 2017. Available from: https://tel.archives-ouvertes.fr/tel-01514176
- Minister of Health Republic of Indonesia. National Movement to Reduce Obesity Guideline. Jakarta;
- Mahendradhata Y, Trisnantoro L, Listyadewi S, Soewondo P, MArthias T, Harimurti P, et al. The Republic of Indonesia Health System Review. Vol. 7. 2017. 1 p.
- Wijaya S. Indonesian food culture mapping: a starter contribution to promote Indonesian culinary tourism. J Ethn Foods [Internet]. 2019;6(1):9. Available from: https://doi.org/10.1186/s42779-019-0009-3.
CrossRef - Amrinanto AH, Hardinsyah H, Palupi E. The eating culture of the Sundanese: Does the traditional salad (Lalapan) improve vegetable intake and blood β-carotene concentration? Futur Food J Food, Agric Soc [Internet]. 2019 Dec 18;7(2 SE-Research Articles):Article Nr. 104. Available from: http://www.thefutureoffoodjournal.com/index.php/FOFJ/article/view/178
- Nurbaini A. Perancangan Media Kampanye Gerakan Masyarakat Hidup Sehat (GERMAS) di Kabupaten Bekasi. e-Proceeding Art Des. 2018;5(3):1946–55.
- Bai VMYB, Darmawan ES. Implementation of “Germas” and Its Effect on Non-Communicable Disease Control. 2019;363–9.
CrossRef - Agustina SC, Trisnantoro L, Handono D. Implementasi Program Indonesia Sehat dengan Pendekatan Keluarga (PIS PK) Menggunakan Tenaga Kontrak di Kabupaten Kulon Progo Tahun 2018. J Kebijak Kesehat Indones JKKI [Internet]. 2019;8(3):104–12. Available from: https://jurnal.ugm.ac.id/jkki/article/view/45705
- Pangalila Y, Kaawoan J, Kumayas N, Kesehatan HD, Seksi K, Kesehatan P, et al. Implementasi Kebijakan Program Gerakan Masyarakat Hidup Sehat di Kota Tomohon. Implementasi Kebijak Progr Gerak Masy Hidup Sehat di Kota Tomohon. 2019;3(3):1–9.
- Ashari N, Saptana N, Purwantini TB. Potensi dan Prospek Pemanfaatan Lahan Pekarangan untuk Mendukung Ketahanan Pangan. Forum Penelit Agro Ekon. 2016;30(1):13.
CrossRef - Arifin NHS, Arifinl HS, Astawan M, Kaswanto, Budiman VP. Optimalisasi Fungsi pekarangan melalui Program Percepatan Penganekaragaman Konsumsi Pangan (P2KP) di Kabupaten Bogor Jawa Barat. In: Prosiding Lokakarya Nasional danSeminar Forum Komunikasi Perguruan Tinggi Pertanian Indonesia. Bogor; 2013.
- Budiman VP. Pengelolaan pekarangan kampung Sebagai agroekosistem untuk menunjang ketahanan pangan dan kesejahteraan yang berkelanjutan [Internet]. IPB University; 2015. Available from: http://dx.doi.org/10.1016/j.ijresmar.2010.02.004%0Ahttp://dx.doi.org/10.1016/j.snb.
2016.01.118%0Ahttp://dx.doi.org/10.1016/j.jns.2009.08.013%0Ahttp://dx.doi.org/10.
1016/B978-0-12-384947-2.00617-6%0Ahttp://www.un-ilibrary.org/economic-and-social-development. - Minister of Health Republic of Indonesia. Minister of Health Regulation no. 63/2015. Indonesia; 2015.
- Minister of Health Republic of Indonesia. Minister of Health Regulation no. 30/2013. Indonesia; p. 2013.
- Fadlillah HN, Nuraida L, Purnomo EH. Consumer Awareness on Label of Food Packaging and Information of Food Additives in Bogor City Kepedulian Konsumen terhadap Label dan Informasi Bahan Tambahan Pangan ( BTP ) pada Label Kemasan Pangan di Kota Bogor. 2015;(January).
- Putri NRY. Pendidikan Gizi Dan Pengaruhnya Terhadap Perilaku Terkait Kemampuan Membaca Label Pangan Kemasan Tinggi Natrium Pada Mahasiswa Unisma. Vol. Sarjana. IPB University; 2018.
- Widhi AS, Mardiyati NL. Ability To Understand The Nutrition Value Information Label Students Of Economic And Business Faculty In Muhammadiyah University Surakarta. In: The First International Conference of Food and Agriculture. 2018.
- Putri Swastanti Pane. Analisis Tingkat Kepatuhan Membaca Label Pangan pada Mahasiswa Gizi Institut Pertanian Bogor. IPB Universty; 2016.
- Saubaki SB, Fitriani A, Rahmuniyati ME. Correlation Of Knowledge Level And Attitude Food Products Labeling With Reading Compliance Of Food Products Labeling Among Mothers In Tajem Sub- District Maguwoharjo. In: International Respati Health Conference (IRHC). 2019. p. 33–40.
- Puspita NN. Theory Of Planned Behavior (TPB): Pengetahuan, Persepsi, dan Niat Membaca Label Komposisi Produk Pangan Pada Mahasiswa. IPB University; 2014.
- Winiastri D, Darban H, Rosyada I. Hubungan Pengetahuan Ibu dengan Kebiasaan Membaca Label Kemasan Pangan pada Ibu yang Mempunyai Bayi Usia 6-12 Bulan di Wilayah Kerja Puskesmas Kepatihan Kecamatan Menganti Kabupaten Gresik. Info Kesehat. 2017;9–14.
- Darajat N, Bahar H, Jufri N. Hubungan Kepatuhan Membaca Label Informasi Zat Gizi dengan Kemampuan Membaca Label Informasi Gizi pada Ibu Rumah Tangga di Pasar Basah Mandonga Kota Kendari Tahun 2016 (Studi Kasus pada UD. Puteri Kembar Kendari). J Ilm Mhs Kesehat Masy Unsyiah. 2016;1(4):185814.
- Golan E, Kuchler F, Mitchell L. Economics of Food Labeling. Washington DC; 2000.
- Pratiwi R. Pencantuman Komposisi Bahan Pada Label Makanan sebagai Hak Hukum di Kota Pekanbaru. Gagasan Huk. 2019;1(1):102–26.
- Resdiana L. Perlindungan hukum terhadap konsumen produk industri rumah tangga pangan (IRT-P) yang tidak mencantumkan label pangan di Kabupaten Karawang. UIN Sunan Gunung Djati; 2017.
- Aturan Antar Instansi, Tantangan Pembatasan Asupan Garam Makanan [Internet]. Tempo.co. 2019 [cited 2020 May 30]. Available from: https://gaya.tempo.co/read/1206600/aturan-antar-instansi-tantangan-pembatasan-asupan-garam-makanan/full&view=ok
- Minister of Health Republic of Indonesia. Minister of Health Regulation No. 41/2014. 2014.
CrossRef - Smith LC, Subandoro A. Measuring Food Security Using Household Expenditure Surveys. Measuring Food Security Using Household Expenditure Surveys. 2007.
- President of Indonesia. Laws of The Republic Indonesia No 20/ 2003. 2003.
- Mancini A, Imperlini E, Nigro E, Montagnese C, Daniele A, Orrù S, et al. Biological and Nutritional Properties of Palm Oil and Palmitic Acid: Effects on Health. Vol. 20, Molecules . 2015.
CrossRef - de Wit N, Derrien M, Bosch-Vermeulen H, Oosterink E, Keshtkar S, Duval C, et al. Saturated fat stimulates obesity and hepatic steatosis and affects gut microbiota composition by an enhanced overflow of dietary fat to the distal intestine. Am J Physiol Liver Physiol [Internet]. 2012 Jun 14;303(5):G589–99. Available from: https://doi.org/10.1152/ajpgi.00488.2011.
CrossRef - Musso G, Gambino R, Cassader M. Interactions Between Gut Microbiota and Host Metabolism Predisposing to Obesity and Diabetes. Annu Rev Med [Internet]. 2011 Jan 12;62(1):361–80. Available from: https://doi.org/10.1146/annurev-med-012510-175505.
CrossRef - Ley RE, Bäckhed F, Turnbaugh P, Lozupone CA, Knight RD, Gordon JI. Obesity alters gut microbial ecology. Proc Natl Acad Sci U S A [Internet]. 2005/07/20. 2005 Aug 2;102(31):11070–5. Available from: https://pubmed.ncbi.nlm.nih.gov/16033867.
CrossRef - Muhamad NA, Mustapha N, Baharin MF, Mutalip MHA, Malek MA, Salleh R, et al. Impact of Palm Oil versus Other Oils on Weight Changes: A Systematic Review. Food Nutr Sci. 2018;09(07):915–36.
CrossRef - Nour M, Lutze SA, Grech A, Allman-Farinelli M. The Relationship between Vegetable Intake and Weight Outcomes: A Systematic Review of Cohort Studies. Nutrients [Internet]. 2018 Nov 2;10(11):1626. Available from: https://pubmed.ncbi.nlm.nih.gov/30400139.
CrossRef - Rolls BJ. The relationship between dietary energy density and energy intake. Physiol Behav [Internet]. 2009/03/20. 2009 Jul 14;97(5):609–15. Available from: https://pubmed.ncbi.nlm.nih.gov/19303887.
CrossRef - Clark MJ, Slavin JL. The Effect of Fiber on Satiety and Food Intake: A Systematic Review. J Am Coll Nutr [Internet]. 2013 Jun 1;32(3):200–11. Available from: https://doi.org/10.1080/07315724.2013.791194.
CrossRef - Hervik AK, Svihus B. The Role of Fiber in Energy Balance. Razzaque MS, editor. J Nutr Metab [Internet]. 2019;2019:4983657. Available from: https://doi.org/10.1155/2019/4983657.
CrossRef - Tappy L, Lê K-A. Metabolic Effects of Fructose and the Worldwide Increase in Obesity. Physiol Rev [Internet]. 2010 Jan 1;90(1):23–46. Available from: https://doi.org/10.1152/physrev.00019.2009.
CrossRef - Samuel VT. Fructose induced lipogenesis: from sugar to fat to insulin resistance. Trends Endocrinol Metab [Internet]. 2011 Feb 1;22(2):60–5. Available from: https://doi.org/10.1016/j.tem.2010.10.003.
CrossRef - Diet, Nutrition And The Prevention Of Chronic Diseases: Report of a Joint WHO/FAO Expert Consultation. World Health Organization. Geneva, Switzerland; 2003.
- Boeing H, Bechthold A, Bub A, Ellinger S, Haller D, Kroke A, et al. Critical review: vegetables and fruit in the prevention of chronic diseases. Eur J Nutr [Internet]. 2012/06/09. 2012 Sep;51(6):637–63. Available from: https://pubmed.ncbi.nlm.nih.gov/22684631.
CrossRef - Sari K, Amaliah N. Hubungan Faktor Sosial Demografi Dan Kegemukan Pada Penduduk Dewasa Di Indonesia Tahun 2007 Dan 2010 (Analisis Data Riskesdas 2007 Dan 2010). J Ekol Kesehat [Internet]. 2014;13(4):329–39. Available from: https://www.neliti.com/id/publications/81465/hubungan-faktor-sosial-demografi-dan-kegemukan-pada-penduduk-dewasa-di-indonesia
- Roemling C, Qaim M. Obesity trends and determinants in Indonesia. Appetite [Internet]. 2012;58(3):1005–13. Available from: http://www.sciencedirect.com/science/article/pii/S0195666312000955.
CrossRef - Razzaque A, Nahar L, Van Minh H, Ng N, Juvekar S, Ashraf A, et al. Social factors and overweight: evidence from nine Asian INDEPTH Network sites. Glob Health Action [Internet]. 2009 Sep 28;2:10.3402/gha.v2i0.1991. Available from: https://pubmed.ncbi.nlm.nih.gov/20027257.
CrossRef - Doak CM, Adair LS, Bentley M, Monteiro C, Popkin BM. The dual burden household and the nutrition transition paradox. Int J Obes [Internet]. 2005;29(1):129–36. Available from: https://doi.org/10.1038/sj.ijo.0802824.
CrossRef - Pomerleau J, Organization WH, Joint FAO/WHO Workshop on Fruit and Vegetables for Health ((2004 : Kobe J. Effectiveness of interventions and programmes promoting fruit and vegetable intake [electronic resource] / Joceline Pomerleau … [et al.] [Internet]. Geneva PP – Geneva: World Health Organization; Available from: https://apps.who.int/iris/handle/10665/43147
- Yuniar AD, Fibrianto AS. Public Health Communication Campaign ‘Germas’ by Ministry of Health in Maluku 2018: An overview. 2019;343(Icas):152–6.
CrossRef - Baliki G, Brück T, Schreinemachers P, Uddin MN. Long-term behavioural impact of an integrated home garden intervention: evidence from Bangladesh. Food Secur [Internet]. 2019;11(6):1217–30. Available from: https://doi.org/10.1007/s12571-019-00969-0.
CrossRef - Algert S, Diekmann L, Renvall M, Gray L. Community and home gardens increase vegetable intake and food security of residents in San Jose, California. Calif Agric. 2016;70(2):77–82.
CrossRef - Mohamed W, Azlan A, Talib RABD. Current Research in Nutrition and Food Science Benefits of Community Gardening Activity in Obesity Intervention : Findings from F . E . A . T . Programme. 2018;06(3).
CrossRef - Balasubramanian SK, Cole C. Consumers’ Search and Use of Nutrition Information: The Challenge and Promise of the Nutrition Labeling and Education Act. J Mark [Internet]. 2002 Jul 1;66(3):112–27. Available from: https://doi.org/10.1509/jmkg.66.3.112.18502.
CrossRef - Ikonen I, Sotgiu F, Aydinli A, Verlegh PWJ. Consumer effects of front-of-package nutrition labeling: an interdisciplinary meta-analysis. J Acad Mark Sci [Internet]. 2020;48(3):360–83. Available from: https://doi.org/10.1007/s11747-019-00663-9.
CrossRef - Dallongeville J, Dauchet L, de Mouzon O, Réquillart V, Soler L-G. Increasing fruit and vegetable consumption: a cost-effectiveness analysis of public policies. Eur J Public Health [Internet]. 2010 Feb 25;21(1):69–73. Available from: https://doi.org/10.1093/eurpub/ckq013.
CrossRef - Yue H, Chris K, Junxiu L, Yujin L, Jonathan P-S, Brendan C, et al. Cost-Effectiveness of the US Food and Drug Administration Added Sugar Labeling Policy for Improving Diet and Health. Circulation [Internet]. 2019 Jun 4;139(23):2613–24. Available from: https://doi.org/10.1161/CIRCULATIONAHA.118.036751.
CrossRef - VanEpps EM, Roberto CA, Park S, Economos CD, Bleich SN. Restaurant Menu Labeling Policy: Review of Evidence and Controversies. Curr Obes Rep [Internet]. 2016 Mar;5(1):72–80. Available from: https://pubmed.ncbi.nlm.nih.gov/26877095.
CrossRef - Bollinger B, Leslie P, Sorensen A. Calorie posting in chain restaurants. Am Econ J Econ Policy. 2011;3(1):91–128.
CrossRef - McCormack LA, Laska MN, Larson NI, Story M. Review of the Nutritional Implications of Farmers’ Markets and Community Gardens: A Call for Evaluation and Research Efforts. J Am Diet Assoc [Internet]. 2010 Mar 1;110(3):399–408. Available from: https://doi.org/10.1016/j.jada.2009.11.023.
CrossRef

This work is licensed under a Creative Commons Attribution 4.0 International License.


