

Introduction
Street foods are foods including beverages which are often prepared by street food vendors (SFVs) either in the streets or home and often sold to the public for consumption without any further preparation 1. They are a major source of food and income for many individuals particularly in developing countries like Kenya 2. Due to the large population of people living in urban areas who spend very little time at home, there has been an increase in the demand for inexpensive and readily available ready-to-eat (RTE) foods. Street foods are cost-effective, convenient, and highly affordable 3. Very low capital is required to start a street food business, which makes it easy for many people to venture into it 4. This sector is therefore highly populated by many vendors probably due to poverty and unemployment 2. SFVs operate with minimal government regulation which provides the opportunity for practices that can potentially cause serious food safety issues to the consumers 1,5.
Although many researchers have studied about the operation of SFVs 6-10, few have reported the specific factors that may influence the SFVs choices regarding food safety and hygiene and the resulting outcomes. Due to the different social-economic characteristics of SFVs in different locations, different factors have been reported to influence food hygiene and safety awareness and practices among SFVs. These factors include gender, ethnicity, age, training, duration of time in business, food handler’s license status, marital status and religion 2,10-14. Whereas these factors influence the vendors’ food safety and hygiene knowledge and practices directly, they may also indirectly influence hygiene and safety outcomes including the quality and safety of RTE foods.
SFVs choices as well as outcomes related to food safety and hygiene in street food vending involve trade-offs between these factors. This means that a single factor may not independently influence SFVs food safety and hygiene choices and outcomes in street food vending business. Thus, there is a need to study the contribution that all these factors have to food safety, hygiene awareness and practices (FSHAP) among SFVs. Logistic regression is one of the statistical analysis tools that can be used in modeling data to describe and test hypotheses concerning relationships between predictor variables and a categorical outcome variable 15. However, the literature on statistical modeling to predict SFVs food hygiene and safety knowledge and practices is scarce. A few researchers have employed logistic regression to predict FSHAP among SFVs. Rahman, Arif, Bakar, bt Talib 10 studied the influence of age, training, knowledge score, duration of time in vending, ethnicity, and marital status on food safety awareness, practice and attitude among SFVs in Sarawak. Their results revealed that age and ethnicity were crucial for food safety awareness while training was important in influencing attitude among SFVs. Akabanda, Hlortsi, Owusu-Kwarteng 16 developed four models on SFVs knowledge and attitudes regarding food safety, personal hygiene, and food hygienic practices in Ghana. Their research included age, length of employment, and education level as predictors for general knowledge on food safety revealing education level as a crucial factor influencing the understanding of food safety issues among SFVs. Such predictive models may be useful in identifying factors of importance in determining intervention strategies to enhance the hygiene and safety among SFVs for a given location. This study, therefore, employed multinomial logistic regression analysis to explore the factors influencing FSHAP among SFVs in Kiambu country, Kenya.
Materials and Methods
Study Area and Design
This study was conducted on street food vendors in six locations including Ngoigwa area, Kiandutu slums, Thika Level 5 Hospital area, Juakali area, Makongeni area, and Thika Town in Kiambu county, Kenya. Data was collected between June and July 2019. A cross-sectional study design was employed to assess food safety, hygiene awareness and practices (FSHAP) among SFVs. The study hypothesized that gender, age, education level, food hygiene and safety training, public health inspection, duration of time in street food vending, category of SFVs, and vendor mobility had a positive influence on the SFVs food safety and hygiene knowledge and practices.
Inclusion criteria and sampling procedure for street food vendors
The inclusion criterion was as follows: street food vendors (SFVs) must have been on the street, mobile or situated in standard locations but operating from temporary structures and selling RTE food which did not necessitate further processing by the consumer prior to consumption. The sample size of 385 SFVs was determined following the procedure proposed by Kothari 17 as shown in equation 1. The selection of the SFVs was done randomly and only 345 SFVs consented to take part in this study.
Where n was the size of the sample of SFVs to be included, z was the z statistic (z=1.96 at 95% confidence level), P was the population proportion, (P=0.5 for maximum variability), d = precision level of ±5% at 95% confidence level.
Data Collection
Data collection was done using a pretested questionnaire and a checklist for observation of street food vendors’ (SFVs) food safety and hygiene practices. The questionnaire and checklist were designed following the guidelines on street food vending food safety and hygiene practices provided by WHO 18. The research tools were pre-tested on 19 selected SFVs in Juja sub-county in the same county. The pretest location was chosen due to its proximity to the study location and poor food safety and hygiene practices of SFVs in this location had been reported by Kimani, Kariuki, Irungu 19. Before data collection, permission was sought from the National Commission for Science and Technology (NACOSTI) as well as the County Commissioner for Kiambu County (NACOSTI/P/19/87469/31129). SFVs were sampled randomly and made aware that the information they were providing would be kept confidential. Their involvement was completely voluntary and could terminate the survey at any time during the interview.
Variable Selection for Analysis
Eight social and demographic characteristics including gender, age, education level, training on food safety and hygiene, public health inspection, duration of time in street food vending, category of street food vendors (SFVs), and vendor mobility were extracted from the data collection tools and used as predictors (Table 1) in the logistic regression models. Thirty-eight characteristics relating to SFVs’ food safety, hygiene knowledge and practices were extracted from the research tools and used as dependent variables in the logistic regression models (Table 2). These characteristics were grouped into four food safety, hygiene awareness and practices (FSHAP) categories; food safety and hygiene awareness (AS), working conditions (WC), food handling practice (FH), and personal hygiene practice (PH). Each vendor was awarded a score for each characteristic depending on their response or what was observed. For instance, if the SFV had a food handler’s medical certificate (Yes), their score for this characteristic was one (1) while if the SFV had no food handler’s medical certificate (No), their score was zero (0).
Hygiene and sanitary status were determined using a 3-point rating scale as follows; poor (1), average (2), or good (3). Hand and equipment washing practices were scored as follows; using cold water only (1), using warm water only (2), using cold water with soap (3), and using warm water with soap (4) (Table 2). Afterward, the total scores were tallied for each vendor within each FSHAP category and converted into percent scores. Percent scores below 50% were classified as poor FSHAP scores while scores greater or equal to 50 were classified as good FSHAP scores.
Table 1: Description of the predictors used in logistic regression analysis.
| Variable | Description of codes | Abbreviation |
| Gender | 1=Male | G1 |
| 2=Female † | G2 | |
| Age | 1= Vendors aged 25 years and below | A1 |
| 2=26 – 35 Years | A2 | |
| 3=36 – 45 Years | A3 | |
| 4=Above 45 Years † | A4 | |
| Education level | 1=No completed formal Education | E1 |
| 2=Primary Education | E2 | |
| 3=Secondary Education | E3 | |
| 4=Tertiary Education level † | E4 | |
| Training on food hygiene and safety | 1= No training | T1 |
| 2=Trained † | T2 | |
| Public health inspection | 1=No public health inspection | P1 |
| 2=Inspected † | P2 | |
| Category of SFVs based on the type of RTE food sold | 1=Animal based foods | C1 |
| 2=Plant based foods | C2 | |
| 3=Sellers of both plant and animal-based foods † | C3 | |
| Mobility of SFVs | 1=SFV not mobile | M1 |
| 2=SFV mobile † | M2 | |
| Length of time in the street vending business | 1=Above 2 years | L1 |
| 2=Between 1 – 2 years | L2 | |
| 3=Between 6 months to 1 Year | L3 | |
| 4=Between 1 – 6 Months | L4 | |
| 5=One Month or below † | L5 |
Table 2: Food safety, hygiene awareness and practices characteristics with their respective categories and scores
| Categories+ | SFV food safety, hygiene awareness and practice characteristics (FSHAP)† |
| Food safety and hygiene awareness (AS)Highest score = 3 | SFV has a food handler’s medical certificate (Yes=1, No=0) |
| SFV is aware of food safety standards and regulations in Kenya (Yes=1, No=0) | |
| SFV is aware that street food may be sources of pathogenic microorganisms (Yes=1, No=0) | |
| Working conditions (WC)Highest score = 13 | The vending structures are washable (Yes=1, No=0) |
| The environment around the vending place is clean (Yes=1, No=0) | |
| Garbage collecting bin is available (Yes=1, No=0) | |
| Garbage collecting bin is covered (Yes=1, No=0) | |
| Garbage collecting bin is not overfilled (Yes=1, No=0) | |
| Houseflies and other insects are not present around the vending place (Yes=1, No=0) | |
| There is the presence of a drainage system for wastewater from the business (Yes=1, No=0) | |
| Vending place hygiene and sanitary status (Poor=1, Average=2, Good=3) | |
| Garbage collecting bin hygiene and sanitary status (Poor=1, Average=2, Good=3) | |
| Personal hygiene practices (PH)Highest score = 18 | Water is available for washing (Yes=1, No=0) |
| There is a sufficient amount of water for washing (Yes=1, No=0) | |
| SFV does not handle money while serving food and if so, washes hands after (Yes=1, No=0) | |
| SFV washes hands before handling food (Yes=1, No=0) | |
| SFV wears aprons (Yes=1, No=0) | |
| SFV uses gloves to handle foods (Yes=1, No=0) | |
| SFV has short clean nails (Yes=1, No=0) | |
| SFV’s hair is covered (Yes=1, No=0) | |
| SFV is not wearing jewelry (Yes=1, No=0) | |
| SFV has no visible bruises, cuts or boils on any visible part of the body (Yes=1, No=0) | |
| SFV does not chew gum or any other foodstuff while handling food (Yes=1, No=0) | |
| SFV does not smoke while handling food (Yes=1, No=0) | |
| SFV does not sneeze, spit or cough on or near food (Yes=1, No=0) | |
| SFV does not touch the mouth, tongue, nose, or eyes while handling food (Yes=1, No=0) | |
| How the SFV washes their hands (cold water only=1, warm water only=2, Coldwater with soap=3, warm water with soap=4) | |
| Food handling practices (FH)Highest score = 14 | The food handling surfaces are cleanable (Yes=1, No=0) |
| The food handling surfaces, cutting equipment, and chopping boards are clean (Yes=1, No=0) | |
| There is adequate separation between raw and RTE foodstuffs (Yes=1, No=0) | |
| There are no scratches or rusting observed on serving utensils (Yes=1, No=0) | |
| Serving utensils or packaging material are adequately covered (Yes=1, No=0) | |
| There are separate basins for utensils and food preparation (Yes=1, No=0) | |
| The food handling surfaces are in good condition without crevices or cracks (Yes=1, No=0) | |
| There is a drying rack for clean utensils (Yes=1, No=0) | |
| There are dry clean wiping towels available (Yes=1, No=0) | |
| RTE food is adequately covered (Yes=1, No=0) | |
| How the SFV washes their utensils and equipment (cold water only=1, warm water only=2, Coldwater with soap=3, warm water with soap=4) |
Statistical Analysis
Multinomial logistic regression was used to construct statistical models to describe the relationship between the explanatory variables in Table 1 and the street food vendors’ food safety, hygiene awareness and practice (FSHAP) scores categories (good or poor score) from Table 2. Logistic regression uses a set of predictors (explanatory variables) to predict the logit (the natural log of the odds (probability/(l-probability)) of an event outcome. Starting with the saturated models (models containing all predictors), the least significant predictors were dropped one by one until the predictors that remained in the models were significantly (P<0.05) contributing to the model.
Overall evaluation of the final model containing significant (P<0.05) factors was done using the likelihood ratio, Wald, and Score tests. These three tests compared the model without predictors (null model) to the model with added predictors. A significant (P<0.05) test result indicated that the model with added variables fitted the data significantly better.
The Wald chi-square test was utilized to test significance of individual predictors’ regression coefficients in each model. The Hosmer and Lemeshow goodness-of-fit test was used to evaluate the fitness of the logistic regression models against actual outcomes. Validation of predicted probabilities was done using Goodman-Kruskal’s Gemma and the c statistic (concordance index). Odds ratios (OR) were calculated by exponentiating the regression coefficients of the respective logistic regression coefficient for any given predictor in the final models. G2, A4, E4, T2, P2, C3, M2, and L5 were chosen as the reference group for gender, age, education level, training on food safety and hygiene, public health inspection, category of SFVs, mobility of SFVs and duration of time in the street vending business in the logistic regression analysis, respectively. All statistical analyses in this study were carried out using SAS software version 9.4M6 (SAS Institute Inc).
Results and Discussion
Evaluation of the Logistic Regression Models
Overall evaluation of the four models using the likelihood ratio test, Wald test, and Score tests (Table 3) showed a significant (P<0.001) improvement in the logistic models compared to the intercept-only model (null model with no predictors). Meaning the models with the predictors were more effective in fitting the data on street food vendors (SFVs) food safety, hygiene awareness and practices than the intercept only model. The null model was chosen as a baseline for comparison to the model containing the predictors since it had no predictors. The Hosmer and Leme show Tests showed no significant results (P>0.05) for all the models meaning that the models were a good fit for the data.
Since logistic regression uses a given set of explanatory variables to predict the logit of an event outcome, it may be transformed back to the probability scale. It is expected that high probabilities are associated with the outcome of the event (good score) while lower probabilities are associated with nonevents 15. These predicted probabilities can be reevaluated as part of the process of ascertaining the usefulness of the model in predicting the outcomes using measures of association such as the Goodman-Kruskal’s Gemma and the c statistic 15. The Goodman-Kruskal’s Gemma statistic for the models predicting food safety and hygiene awareness (AS), working conditions (WC), food handling practices (FH), and personal hygiene practices (PH) score were 0.514, 0.330, 0.410 and 0.425, respectively. This means that 51.4, 33.0, 41.0, and 42.5% fewer errors were made in predicting which SFVs had a good or poor score by using the probabilities estimated by the models than by chance alone for the AS, WC, FH, and PH scores, respectively.
The c statistic is a standard measure that shows the predictive accuracy or the discriminative ability of any logistic regression model 20. In this research, it denotes the probability that any randomly selected street food vendors who had a good score also had a higher predicted probability of having good food safety, hygiene awareness and practice (FSHAP) score compared to randomly selected street food vendors who did not have a good score. The c statistic normally ranges from 0.5 to 1. A value of 0.5 means that the model is poor and is therefore, no better than randomly assigning the observations within outcome categories. Higher values mean that the models are assigning higher probabilities to all the event observations, as compared to those observations with nonevent outcome 15. The c statistic in this study was between 0.652 and 0.741 for the models. This means that between 65.2 – 74.1% of all possible street food vendors pairs (one with good and the other poor FSHAP score), the models correctly assigned higher probabilities to the SFVs who had good FSHAP score. Both the Gemma and c statistic shows that the four models were moderately good in predicting outcomes in this study. With the cutoff (probability for assigning outcomes as either events or nonevents) set at 0.5, the overall correct prediction for the models ranged between 60.2 – 79.60%, which is an improvement over the chance level set at 50% (Figure 1).
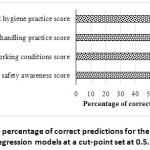 |
Figure 1: The percentage of correct predictions for the four logistic regression models at a cut-point set at 0.5. |
 |
Table 3: Logistic regression analysis results for the four models |
The models are predicting whether the vendor had a “good” food safety, hygiene awareness and practice (FSHAP) score. β is the estimated coefficients for the independent variables, SE is the standard error for the estimated coefficients, Χ2 is Chi-square; E1, E2, E3, T1, P1, C1, C2, M1, L1, L2, L3, and L4 description are in Table 1; AS, WC, FS, and PH description in Table 2; * Significant at 0.05; ** Significant at 0.01; *** Significant at 0.001; ns – Not significant.
Factors Influencing Street Food Vendors’ Food Safety, Hygiene Awareness and Practices
The estimated coefficients for the independent variables in the final models are shown in Table 3. These estimates represent the rate of change in the logit per unit change in the explanatory variable. For a unit change in the explanatory variable, the logit of outcome as compared to the reference group is anticipated to change by the value of the estimate when all the other variables are held constant in the model. The estimates are key in interpreting the results in logistic regression 21. The exponent of these estimates gives the odds ratio which in this study is the ratio of the odds that the food safety, hygiene awareness and practice (FSHAP) score will be good to the odds that it will be poor. In this study, odds greater than one increase the likelihood that the score will be good. Figures 2 – 5 show the odds ratios obtained by exponentiating the estimates from the four logistic regression models.
Gender and age did not significantly (P>0.05) contribute to the logistic regression models predicting the FSHAP scores. All the other factors that significantly contributed to the models are discussed below.
The Education Level of Street Food Vendors
Results showed that the education level was significant in predicting food safety and hygiene awareness (AS) score and working conditions (WC) score as shown in Table 3. The odds for having a good AS or WC score for street food vendors (SFVs) who had no formal education were 0.18 and 0.32 as shown in Figures 2 and 3 respectively. Meaning a lack of formal education has the potential of negatively influencing food safety, hygiene awareness and practice (FSHAP) among SFVs. Similar findings of food handlers with higher education levels who demonstrated a significantly better understanding of food safety issues were reported by Akabanda, Hlortsi, Owusu-Kwarteng 16 in Ghana. Hamed, Mohammed 11 studying food safety practices and knowledge amongst food handlers in Egypt also reported that higher education was a strong indicator of good food safety awareness. Since street food vending business is popular among persons who may not have attained higher education, strategies to enhance the hygiene of SFVs have to be put in place to ensure food safety and therefore public health. This can be achieved by training all food handlers on food hygiene and safety.
Street Food Vendors’ Food Safety and Hygiene Training
Training on food safety and hygiene was significant in predicting AS score only (Table 3). The odds of having a good AS score for street food vendors (SFVs) who had not received any training was 0.24 (Figure 2). This means that training on food hygiene and safety positively influenced good food hygiene and safety awareness among SFVs. Vendors who had been trained were thus highly likely to make better food safety choices such as obtaining a food handler’s medical certificate. Training may enhance awareness on safety standards and regulations applicable in the region which ensures adherence to these requirements and upholding good food safety and hygiene practices. Adane, Teka, Gismu, Halefom, Ademe 12 reported that the odds of having good safety and hygiene practices among food handlers in Ethiopia who had received training on food handling and preparation was 6.7 times higher as compared to those who had no training. This underlines the importance of regular training of SFVs on food safety and hygiene practices so as to enhance the safety of RTE food and hence assure public health.
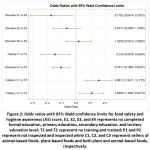 |
Figure 2: Odds ratios with 95% Wald confidence limits for food safety and hygiene awareness (AS) score. |
Public Health Officers’ Inspection
Public health inspection was the only predictor that was significant in predicting all the four-food safety and hygiene scores (Table 3). The odds of having good FSHAP scores for vendors who had not received any public health inspection visit were lower than one as shown in Figures 2 – 5. This means that these street food vendors (SFVs) were likely to have poor food safety and hygiene practice (FSHAP) scores. Public health inspection is inscribed in the public health act of Kenya (CAP 242, 2012), 22 which stipulates that no person is allowed to present any foodstuffs for sale without putting in place adequate measures to safeguard against infections or contamination.
Public health officers are empowered through this act to oversee the safety and hygiene of food sold in Kenya. They are required to occasionally inspect and examine suitability for human consumption of any food found in any food premises with the interest of ensuring public health. Thus, their role is to ensure compliance with all stipulated standards and regulations relating to food hygiene and safety. Their regular inspection therefore would enhance compliance to these stipulations which has the potential to increase awareness on food safety and better hygiene and safety practices among SFVs. Similar findings on SFVs who were inspected by environmental health inspectors being 2.41 times more likely to practice safe food handling as compared to those who had no inspection by the regulatory bodies were reported by Mesele 14 in Ethiopia. They reported that SFVs who were inspected by environmental health inspectors were 2.4 times more likely to practice safe food handling when compared to those who were not inspected by the regulatory bodies. Although the fear of regulators may be the motivation to adhere to food hygiene and safety regulations, the regular inspection may grow the desire to improve the quality and safety of food among the SFVs. This shows the importance of such inspection in enhancing food safety and hygiene practices among SFVs. Thus, there is a need to sensitize SFVs on the need for good food safety and hygiene practices as poor choices facilitate poor hygiene outcomes which have the potential of causing public health issues. Furthermore, the legal implications of selling unwholesome food that has the potential to negatively affect public health should be communicated to the SFVs 9.
Category of Street Food Vendors
Results showed that the category of the street food vendors (SFVs) based on the type of RTE food sold significantly predicted the vendor’s food safety and hygiene awareness (AS) score as shown in Table 3. The odds of having a good AS score were 4.8812 and 2.9909 times higher for SFVs selling animal-based and plant-based foods only respectively (Figure 2). Meaning SFVs selling both plant and animal-based foods were less likely to obtain a food handler’s medical certificate, to be aware of food hygiene and safety standards, or even to be aware of the fact that street foods could be contaminated with pathogenic microorganisms. Although there are differences in hygiene and safety practices depending on type of food sold, all SFVs must have the basic knowledge of food safety and hygiene to ensure the safety of the food as stipulated in the Kenya’s public health act (CAP 242, 2012) 22. Therefore, strategies targeting to improve hygiene and safety practices among SFVs selling different foodstuffs should also seek to improve their food safety and hygiene knowledge which has the potential to improve public health.
Street Food Vendors’ Mobility
The street food vendors’ (SFVs) mobility was significant in predicting the working conditions (WC), and personal hygiene practices (PH) scores (Table 3). The odds of having a good score for vendors who were not mobile were 1.8615 and 2.1934 for WC (Figure 3) and PH scores respectively (Figure 5). Mobile vendors were often found selling in unhygienic surroundings and had poor personal hygiene practices compared to the vendors operating in stationary locations. Vending from a designated location allow control of many aspects of street food vending including the sanitary condition of the surrounding environment, SFVs’ personal hygiene as well as food handling practices which explains the poor score observed for mobile vendors. Similar finding on mobile vendors exhibiting very poor food hygiene and safety practices was reported by Dwumfour-Asare, Agyapong 6 in a Ghanaian study. Since most towns in Kenya did not include street food vending business locations in their design, even the stationary SFVs may be found setting up their locations in unsanitary sites. This calls for the inclusion of street vending locations in the design of cities and towns which will limit mobile vending practices and the haphazard placement of SFVs in unsanitary locations.
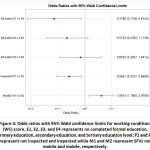 |
Figure 3: Odds ratios with 95% Wald confidence limits for working conditions (WC) score. |
Duration of Time in Street Food Vending Business
The duration of time spent in street food vending is an indication of the experience gained by street food vendors (SFVs) over time. It is assumed that with time SFVs should have better food hygiene and safety practices. The duration of time in street food vending was significant in predicting the food handling practices (FH) score (Table 3). Vendors who had been in business between 1 to 6 months and between 6 to 12 months were 3.1090 and 2.0427 times more likely to show good FH scores compared to the vendors who were in vending for one month and below as shown in Figure 4. This is an indication that vendors who had been in vending for a shorter time had better food safety and hygiene practices although this was not the case for vendors who were over 1 year in business. This means that, although some vendors may have been in street food vending business for longer, their food safety and hygiene practices were poor or deteriorated with time which explains the gradual decrease in the chance of having a good score with an increase in the length of time in the vending business as shown in Figure 4. This result suggests that better behavioral practices among SFVs may not necessarily be acquired simply by work experience but by conscious effort in the part of the SFVs in doing the right thing as reported by Dwumfour-Asare, Agyapong 6.
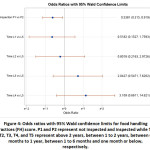 |
Figure 4: Odds ratios with 95% Wald confidence limits for food handling practices (FH) score. |
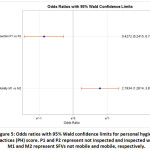 |
Figure 5: Odds ratios with 95% Wald confidence limits for personal hygiene practices (PH) score. |
Conclusions
This study revealed that public health inspection and street food vendors’ (SFVs) mobility were the most significant factors influencing food safety, hygiene awareness and practices (FSHAP) among SFVs. Public health inspection improved the chance of having a good FSHAP score while being mobile increased the likelihood of poor scores. Efforts to reduce movement of SFVs should be put in place as mobility impairs the achievement of certain hygienic practices such as regular washing of hands and maintenance of environmental hygiene. All the other predictors including education level, training, category of SFV, and the length of time in vending were significant in predicting at least one FSHAP score except for the age and gender of the SFVs. Therefore, to improve the hygiene and safety of street food, emphasis should be placed on all the factors that have the potential to influence SFVs food safety and hygiene practices. These findings can be used to establish priorities for programs geared toward enhancing street hygiene and food safety. The study further recommends regular inspection of SFVs by public health officials to improve compliance with food safety and hygiene standards and regulations governing the food sector as well as scheduled training on food safety and hygiene targeting all categories of SFVs. Further, the inclusion of the street food vending locations in designing as well as planning of cities, towns, and market centers may limit the mobile vending practices and the haphazard placement of street vendors in unsanitary locations both of which have been proven to impair the safety of street food.
Acknowledgment
The authors would like to acknowledge funding from the German Academic Exchange Service (Deutscher Akademischer Austauschdienst – DAAD).
Funding Sources
The authors received funding from the German Academic Exchange Service (Deutscher Akademischer Austauschdienst – DAAD) for the research, and publication of this article.
Conflict of Interest
The authors declare no conflict of interest.
References
- Imathiu S. Street Vended Foods: Potential for Improving Food and Nutrition Security or a Risk Factor for Foodborne Diseases in Developing Countries? Current Research in Nutrition and Food Science Journal. 2017;5(2):55-65.
CrossRef - Addo-Tham R., Appiah-Brempong E., Vampere H., Acquah-Gyan E., Gyimah Akwasi A. Knowledge on Food Safety and Food-Handling Practices of Street Food Vendors in Ejisu-Juaben Municipality of Ghana. Advances in Public Health. 2020;2020.
CrossRef - Moussavi P., Liguori K., Mehta K. Street Foods in Central Kenya: Actors, Trends, and Opportunities. International Journal for Service Learning in Engineering, umanitarian Engineering Social Entrepreneurship. 2016;11(2):87-100.
CrossRef - Rane S. Street vended food in developing world: hazard analyses. Indian journal of microbiology. 2011;51(1):100-106.
CrossRef - Mwove J., Imathiu S., Orina I., Karanja P. Food safety knowledge and practices of street food vendors in selected locations within Kiambu County, Kenya. African Journal of Food Science. 2020;14(6):174-185.
CrossRef - Dwumfour-Asare B., Agyapong D. Food hygiene and safety practices (FHSP) among street food vendors in a low-income urban community of a metropolis in Ghana. The International Journal of Science and Technoledge. 2014;2(5):38.
- Lawan U. M., Iliyasu Z., Abubakar S., Gajida A. U., Abdussalam A. Personal and food hygiene practices of subsistence food vendors operating in Kano metropolis, northwestern Nigeria. International Journal of Medical Science and Public Health. 2015;4(2):214.
CrossRef - Okojie P. W., Isah E. C. Food hygiene knowledge and practices of street food vendors in Benin City, Nigeria. International Journal of Consumer Studies. 2019;43(6):528-535.
CrossRef - Okojie P. W., Isah E. C. Sanitary conditions of food vending sites and food handling practices of street food vendors in Benin City, Nigeria: implication for food hygiene and safety. Journal of environmental and public health. 2014;2014.
CrossRef - Rahman M. M., Arif M. T., Bakar K., bt Talib Z. Food safety knowledge, attitude and hygiene practices among the street food vendors in Northern Kuching City, Sarawak. Borneo Science. 2016;31.
- Hamed A. F., Mohammed N. A. Food safety knowledge, attitude and self-reported practices among food handlers in Sohag Governorate, Egypt. East Mediterr Health J. 2019;25.
CrossRef - Adane M., Teka B., Gismu Y., Halefom G., Ademe M. Food hygiene and safety measures among food handlers in street food shops and food establishments of Dessie town, Ethiopia: A community-based cross-sectional study. PloS one. 2018;13(5).
CrossRef - Birgen B. J., Njue L. G., Kaindi D. M., Ogutu F. O., Owade J. O. Determinants of Microbial Contamination of Street-Vended Chicken Products Sold in Nairobi County, Kenya. International Journal of Food Science. 2020;2020.
CrossRef - Mesele G. Food safety knowledge, practice and associated factors among street food vendors in Kombolcha town, north east Ethiopia [Thesis]: College of Medicine and Health Sciences, UOG, College of Medicine and Health Sciences; 2014.
- Peng C.-Y. J., Lee K. L., Ingersoll G. M. An introduction to logistic regression analysis and reporting. The journal of educational research. 2002;96(1):3-14.
CrossRef - Akabanda F., Hlortsi E. H., Owusu-Kwarteng J. Food safety knowledge, attitudes and practices of institutional food-handlers in Ghana. BMC Public Health. 2017;17(1):40.
CrossRef - Kothari C. R. Research methodology: Methods and techniques. 2nd Revised Edition ed: New Age International; 2004.
- Essential safety requirements for street-vended foods. No. WHO/FNU/FOS/96.7 Rev1. Geneva, Switzerland: Food Safety Unit, Division of Food and Nutrition, World Health Organization. 1996.
- Kimani E. W., Kariuki J. G., Irungu R. W. Food Hygiene and Safety Practices among Street Food Handlers in Juja Sub-County, Kiambu County, Kenya. The International Journal of Humanities and Social Studies. 2018;6(11).
- Austin P. C., Steyerberg E. W. Interpreting the concordance statistic of a logistic regression model: relation to the variance and odds ratio of a continuous explanatory variable. BMC medical research methodology. 2012;12(1):82.
CrossRef - Al-Ghamdi A. S. Using logistic regression to estimate the influence of accident factors on accident severity. Accident Analysis & Prevention. 2002;34(6):729-741.
CrossRef - The public health ACT. In. Vol Chapter 242. Kenya: National Council for Law Reporting, Government of Kenya (GoK); 2012.

This work is licensed under a Creative Commons Attribution 4.0 International License.