In Vitro Glycemic Response of Indigenous Pigmented Rice Cultivars from South India and influence of Different Carbohydrate Components
Ashrita C. Haldipur and N. Srividya*
Department of Food and Nutritional Sciences, Sri Sathya Sai Institute of Higher Learning, Anantapur, Andhra Pradesh, India
Corresponding Author Email: nsrividya@sssihl.edu.in
DOI : http://dx.doi.org/10.12944/CRNFSJ.8.3.13
Download this article as:
![]()
Staple diet patterns such as white rice consumption play an important part in the occurrence of chronic lifestyle-related disease like diabetes. This study intended to identify pigmented rice cultivars from India as an alternative to white rice. Nine carbohydrate components were quantified in six red and two black pigmented rice varieties. In vitro starch digestibility was also analyzed and the predicted glycemic index (pGI) was estimated. The relationship between the carbohydrate components and the pGI of the rice varieties was analyzed. The rice varieties, Kattuyanam and Chennangi exhibited high levels of insoluble dietary fibre, total dietary fibre and amylose. High soluble dietary fibre contents were observed in Poonghar and Aruvadam kuruvai. The levels of resistant starch and slowly digestible starch were found to be the highest in Karupakavuni. The results indicated Kattuyanam, Chennangi, Karungkuruvai, and Poonghar to be low pGI rice varieties (less than 55). The three varieties, Kesari, Karupakavuni, and Aruvadam kuruvai were categorized under the medium pGI category (56-69). Mapillai samba had a high pGI of 70 which could be due to processing (partially milled and parboiled), but had significantly lower pGI than the white rice, Sona masuri (GI – 76). The dietary fibre components, resistant starch, slowly digestible starch, and the amylose content were negatively correlated with the pGI. Among these components, the insoluble dietary fibre, total dietary fibre, and resistant starch with significantly high (p ≤0.01) correlation were found to be the major determining factors of pGI in the studied pigmented rice cultivars. The inclusion of the identified pigmented rice varieties with low to medium glycemic response in the diet could become a key role in the dietary management of diabetes, especially among the rice-eating population.
KEYWORDS:Amylose; Dietary Fibre; Pigmented Rice; Predicted Glycemic Index; Resistant Starch; Starch Hydrolysis
Introduction
Rice is produced and consumed all over the world, especially in Asia. It is considered as the staple food for the majority of the world’s population. However, in recent times higher consumption of white rice has been implicated in increasing the risk of certain chronic lifestyle-related diseases such as type 2 diabetes.1 The suitability of carbohydrate-based foods for diabetic subjects has been assessed using glycemic index studies. ‘Glycemic index (GI) is defined as the area under the curve of blood glucose level, within 2 hour period, after consuming 50 g of a carbohydrate based test food in comparison with the area following the ingestion of 50 g of carbohydrate-based reference food, usually white bread or glucose.2 The standardized method of measuring GI with human feeding trials is validated but not practical when it comes to measuring the GI of a large number of samples. It is a resource-intensive method and hence as an alternative, in vitro methods that are simple, reliable, and inexpensive have become popular for the screening of low GI foods.3 A high correlation has been reported between the in vivo glucose response and in vitro pGI based on starch digestibility.3,4,5
A common in vitro starch digestibility technique uses controlled enzymatic hydrolysis of starch-based foods to simulate the release of glucose over time and its absorption in the intestinal tract to identify starch fractions such as rapidly digested starch (RDS) and slowly digested starch (SDS) fractions.6 Another method4 uses starch digestibility to calculate the hydrolysis index (HI) of a carbohydrate-based test food and a reference food such as white bread or glucose and predict the glycemic index of the test food.
Low-GI foods have an advantageous effect on glycemic control and lower HbA1c and fructosamine levels in the body.7 Glycemic index of foods is influenced by many factors. Processing, dietary fibre, amylose content and resistant starch content appear to be the decisive factors among others.8,9 The average GI values of white rice varieties irrespective of the type of processing, cooking time, and amylose content are reported to be high.10 Therefore, it poses a public predicament for the large populations that depend largely on rice for sustenance. Hence, there is a compelling need to screen, identify and scientifically validate low GI rice varieties.
Some have reported lower starch digestibility in pigmented rice varieties from Thailand in comparison with white rice.11,12,13,14 One study has reported the resistant starch content and starch digestibility (in vitro) of two red rice varieties and one white rice variety from India15 and another study has reported the amylose content and in vivo GI of four pigmented rice varieties.16
Cultivation and consumption of traditional pigmented rice varieties are being revived in India as their nutritional awareness is increasing. In this study, eight pigmented rice varieties cultivated in Southern regions of India and steadily gaining market value have been selected for the study. This is one of the first composite studies to report different carbohydrate components relevant to the glycemic response along with in vitro starch digestibility and pGI in Indian pigmented rice varieties to the best of our knowledge. This study has also determined the correlation between the different carbohydrate components and the in vitro glycemic response of the pigmented rice varieties providing insights into the role of these components in carbohydrate metabolism.
Materials and Methods
Sample Collection and Storage Conditions
Five rice varieties (Karungkuruvai, Poonghar, Aruvadam Kuruvai, Karupa Kavuni, and Kattuyanam) were collected directly from rice farms in Tamil Nadu, India. Mapillai Samba (parboiled and partially milled) was procured from Nammanellu, Centre for Indian Knowledge Systems, Tamil Nadu, India. Chennangi and Kesari were procured from Timbaktu, Dharani Farms, Andhra Pradesh, India. The samples codes, bran colour and morphological classification of the rice varieties are given in Table 1. Sona masuri (WSm) a medium and slender polished white rice, commonly consumed in Southern parts of India was procured from the local market in Andhra Pradesh, India. It was considered as a control for this investigation.
The rice samples were cleaned and dehusked manually. Whole rice grains (including the bran) were pulverized using an electric blender and sieved using a 0.5 mm mesh to obtain a homogenous sample. The samples were freeze-dried, vacuum packaged and stored at – 20 °C until analysis. No physical, biological changes or contamination was observed during storage.
Table 1: Samples Codes, Bran Colour and Morphological Classification of Pigmented Rice
| S. No. | Pigmented rice varieties | Sample code | Bran colour | Morphological classification* |
| 1. | Kattuyanam | BKa | Black | Short, bold |
| 2. | Chennangi | RChe | Red | Short, bold |
| 3. | Karungkuruvai | RKku | Red | Short, round |
| 4. | Poonghar | RPo | Red | Long, slender |
| 5. | Kesari | RKe | Red | Short, round |
| 6. | Karupakavuni | BKk | Black | Medium, slender |
| 7. | Aruvadam kuruvai | RAk | Red | Short, bold |
| 8. | Mapillai samba | RMs | Red | Short, round |
*As per National Post Harvest Institute for Research and Extension (NAPHIRE), Department of Agriculture, Philippines
Dietary Fibre Components
The dietary fibre components including total dietary fibre (TDF), soluble dietary fibre (SDF), and insoluble dietary fibre (IDF) were analyzed using an enzymatic and gravimetric modified procedure17 standardized in our laboratory18 using a dietary fibre kit (TDA-100A kit) from Sigma-Aldrich, USA.
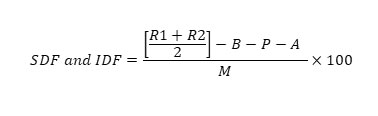
Where, B – Blank, – Weight of residue used for protein analysis, R2 – Weight of the residue used for ash analysis, M – Weight of sample, P – Protein, A – Ash
Amylose Estimation
Starch was isolated from the experimental rice flours by following the method given by Lim et al.19 The amylose content was analyzed using the 96-well plate iodine binding assay standardized by Kaufman et al.20 The absorbance values of the samples were recorded at 620 nm using Thermo Scientific Varioskan LUX multimode microplate reader. Amylose standard curve with concentrations ranging from 25 to 500 µg/ ml was built and a regression equation was determined for calculating concentrations in the samples.
Total Starch, Resistant Starch, and Digestible Starch
The total starch (TS) content of rice was determined using the enzymatic method (amylase and amyloglucosidase) standardized by de Guzman et al. 21 The absorbance was measured at 510 nm. Total starch was calculated as glucose (mg) and multiplied by the conversion factor 0.9 to give the starch content.
The resistant starch (RS) content was analysed by the method given by Goñi et al.22 The resultant glucose was quantified using the glucose oxidase-peroxidase method. RS was calculated as glucose (mg) and multiplied by the conversion factor 0.9 to give the starch content.
Digestible starch (DS) was computed by subtracting the RS from TS as reported by Frei et al. (2003).23
In Vitro Starch Digestion and Starch Kinetics
In vitro starch digestion was carried out according to the protocol of Goñi et al.4 with modifications. The chewing stage was replicated by macerating cooked rice (0.2 g) in a mortar and pestle with 400 µl of α-amylase (80 U in phosphate buffer saline, pH 7.4), 2 ml distilled water for 2 min followed by 5 ml of 0.1 M phosphate buffer (pH 6.9). The contents were transferred to a boiling tube and the pH was reduced to 2.5 using 10 % phosphoric acid. The gastric digestion was followed according to the method by Kumar et al.39 From the digesta, 500 µl aliquots were taken at 0, 20, 30, 60, 90, 120, 150 and 180 min. The aliquots were further diluted to 5 ml with double distilled water. The glucose contents were estimated using glucose oxidase-peroxidase reagent and the absorbance was determined at 510 nm. The starch hydrolyzed was calculated as glucose (mg) and multiplied by the conversion factor 0.9 to give the starch content.
The starch hydrolysis reactions were fitted to the first-order rate equation4:
Ct = C∞ (1-e–kt).
Ct = quantity of starch hydrolyzed at time t
C∞ = quantity of starch hydrolyzed at the endpoint of the reaction
= digestibility rate constant or first-order rate constant, which was calculated by the equation4:
Based on the first order rate equation as explained in the cited reference (4), the k value was determined as follows:
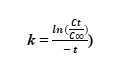
t = time taken for digesting the starch in minutes
Rapidly Digestible Starch and Slowly Digestible Starch
The RDS and SDS contents were computed according to the equations given by Englyst et al.6: RDS = (G20 – FSG) x 0.9 and SDS = (G120 – G20) x 0.9, where, G20 and G120 correspond to the available glucose after 20 min and 120 min, respectively. Fasting glucose (FSG) represents glucose available at 0 min. The glucose values were multiplied by the conversion factor 0.9 to give the starch content.
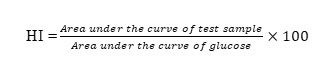
Hydrolysis Index
The hydrolysis index (HI) was derived as the ratio between the areas under the curve of the hydrolysed test samples (pigmented rice and white rice) and the reference sample (i.e. glucose). The areas under the curves were calculated using Sigma plot V14.0, USA.
Predicted Glycemic Index
The HI determined in the experiment was used to compute the pGI applying the equation given by Goñi et al.4: pGI = 39.7 + 0.548 HI.
Statistical Analysis
The results were presented as mean ± standard deviation of three replicates. The data were subjected to one-way analysis of variance (ANOVA) and Tukey HSD at a significance level of p ≤ 0.05 to detect significant differences among the pigmented rice varieties and the control. Pearson’s correlation coefficient was used to ascertain relationships between the carbohydrate components and the pGI at p ≤ 0.05 and p ≤ 0.01 levels. All statistical analyses were performed using SPSS® 16 software, student version.
Results
Dietary Fibre Components
The total dietary fibre (TDF), soluble dietary fibre (SDF) and (insoluble dietary fibre) IDF contents of the samples are presented in Table 2. The TDF content of the experimental samples ranged from 6.66 to 8.53 g/ 100 g. The highest TDF content was found in BKa and the least in RMs. The sample BKa had significantly higher (p ≤ 0.05) TDF content than the other samples. All the experimental samples had significantly higher TDF content compared to WSm.
The SDF content was found to be the highest in RPo (1.55 g/ 100 g) followed closely by RAk (1.49 g %) and RKe (1.48 g %). All the pigmented rice varieties recorded significantly higher SDF than WSm (0.48 g %). The IDF content was highest in BKa (7.04 g/ 100 g) followed by RChe (7.02 g/ 100 g) and least in RMs (5.22 g/100 g) among the pigmented rice varieties. These values were significantly higher (p ≤ 0.05) compared to WSm.
Table 2: Dietary Fibre Profile and Amylose Content of Pigmented Rice Cultivars and White Rice
| Sample | TDF (g/100 g) | SDF (g/100 g) | IDF (g/100 g) | Amylose content (g/ 100 g) |
| BKa | 8.53f ± 0.08 | 1.42c ± 0.09 | 7.04f ± 0.04 | 28.42 c ± 0.1 |
| RChe | 8.29e ± 0.51 | 1.27 b ± 0.45 | 7.02 ef ± 0.31 | 27.12 c ± 0.09 |
| RKku | 7.40c ± 0.18 | 1.48c ± 0.09 | 6.15 d ± 0.05 | 27.14 c ± 0.22 |
| RPo | 8.24e ± 0.41 | 1.55cd ± 0.04 | 6.79 e 0.29 | 27.22 c ± 0.06 |
| RKe | 7.92d ± 0.82 | 1.25b ± 0.13 | 6.44 de ± 0.18 | 27.86 c ± 0.06 |
| BKk | 7.84d ± 0.15 | 1.45c ± 0.25 | 6.29 d ± 0.24 | 26.72 c ± 0.17 |
| RAk | 6.76 b ± 0.03 | 1.49cd ± 1.42 | 5.34 c ± 0.24 | 29.22 c ± 0.12 |
| RMs | 6.66 b ± 0.31 | 1.44bc ± 0.05 | 5.22 b ± 0.17 | 16.42 b ± 0.18 |
| WSm | 2.26 a ± 0.16 | 0.48a ± 1.62 | 1.78 a ± 0.25 | 12.26 a ± 0.08 |
BKa – Kattuyanam, RChe – Chennangi, RKku – Karungkuruvai, RPo – Poonghar, RKe – Kesari, BKk – Karupakavuni, RAk – Aruvadam Kuruvai, RMs – Mapillai Samba and WSm – Sona Masuri (control).
IDF – Insoluble dietary fibre, SDF – Soluble dietary fibre, TDF – Total dietary fibre
Data are Mean ± SD (n = 3). Values in columns with different letters denote statistically significant differences, according to Tukey HSD test (p ≤ 0.05).
Amylose Content
The amylose content (Table 2) was found to be the highest (29.22 g/ 100 g DW) in RAk. However, this was not significantly different from the other pigmented rice varieties except RMs which recorded a lower value of 16.42 g/ 100 g DW. All the experimental samples fall under the high amylose content category (> 25 %) except RMs which belong to low amylose content category (10-20 %) according to the classification given by Kumar and Khush.24 However, all the eight pigmented rice varieties had significantly higher (p ≤ 0.05) amylose content than WSm (12.26 g %).
Total Starch, Resistant Starch, and Digestible Starch
The total starch (TS), resistant starch (RS), and digestible starch (DS) contents of the pigmented rice varieties are given in the Table 3. The percentage of TS in the rice varieties varied from 73.30 to 79.29 g/ 100 g. The RS content was found to be the highest (2.54 g/ 100 g) in BKk. All the pigmented rice varieties had significantly (p ≤ 0.05) higher RS content than WSm. The DS content of the pigmented rice samples ranged from 71.49 to 76.92 g/ 100 g, with the highest and least content in RKe and BKk, respectively. The control, WSm, had significantly higher (p ≤ 0.05) DS than the other samples.
Table 3: Total Starch, Resistant Starch and Digestible Starch Contents of Pigmented Rice Cultivars and White Rice.
| Sample | TS (g/100 g) | RS (g/100 g) | DS (g/ 100 g) |
| BKa | 74.39 c ± 0.04 | 2.28 de ± 0.07 | 72.11 ab ± 0.03 |
| RChe | 73.36 ab ± 0.06 | 2.13 d ± 0.08 | 71.86 a ± 0.13 |
| RKku | 74.41 c ± 0.09 | 2.05 d ± 0.05 | 72.35 ab ± 0.03 |
| RPo | 73.30 a ± 0.08 | 1.52 b ± 0.10 | 71.78 a ± 0.05 |
| RKe | 79.29 e ± 0.03 | 2.37 d ± 0.15 | 76.92 d ± 0.06 |
| BKk | 74.03 c ± 0.14 | 2.54 f ± 0.27 | 71.49 a ± 0.22 |
| RAk | 73.97 b ± 0.15 | 1.75 cd ± 0.10 | 72.22 b ± 0.04 |
| RMs | 75.36 d ± 0.04 | 1.68 c ± 0.07 | 73.68 c ± 0.35 |
| WSm | 78.79 e ± 0.05 | 0.23 a ± 0.11 | 78.56 e ± 0.15 |
BKa – Kattuyanam, RChe – Chennangi, RKku – Karungkuruvai, RPo – Poonghar, RKe – Kesari, BKk – Karupakavuni, RAk – Aruvadam Kuruvai, RMs – Mapillai Samba, and WSm – Sona Masuri (control).
TS – Total starch, RS – Resistant starch, DS – Digestible starch.
Data are Mean ± SD (n = 3). Values in columns with different letters denote statistically significant differences, according to Tukey HSD test (p ≤ 0.05).
Starch Digestibility, Kinetics, and Digestible Fractions
The starch hydrolysis curves for the pigmented rice varieties, WSm and glucose are given in Figure 1. The equilibrium concentration (C∞) and kinetic constant (k) are shown in Table 4. The highest equilibrium concentration (C∞) was observed in glucose (64.11 %) and the least C∞ was foundThe sample BKa had significantly lower C∞ than the other pigmented rice samples. All experimental samples had significantly lower (p ≤ 0.05) C∞ compared to WSm (56.38 %). With respect to the rate of hydrolysis, RPo reached a plateau of 42 % at 90 min while other samples reached equilibrium after 120 min. The starch hydrolysis peak occurred at 30 min for glucose, whereas it occurred at 60 min for all the experimental samples and WSm. The starch hydrolysis peak was also lower in all experimental samples compared to WSm and glucose. The digestibility rate constant (k) was found to be the least in BKa (0.055 min-1) and highest in RKe (0.084min-1). WSm had significantly higher (p ≤ 0.05) k (0.1 min -1) than pigmented rice samples.
The fractions of digested starch (RDS and SDS) of the cooked pigmented rice varieties are presented in Table 3. The amount of RDS in the pigmented rice cultivars was in the range of 28.31 to 36.86 g/ 100 g. Significantly lower (p ≤ 0.05) contents of RDS were found in RChe and BKa among the pigmented rice samples. Significantly higher (p ≤ 0.05) amounts of RDS (40.12 g/ 100 g) was noticed in WSm compared to all the pigmented rice varieties.
The SDS content of pigmented rice samples ranged from 7.89 in RKe to 14.23 g/ 100 g in BKa. WSm had a significantly lower (p ≤ 0.05) SDS content (6.26 g/ 100 g) compared to the pigmented rice samples.
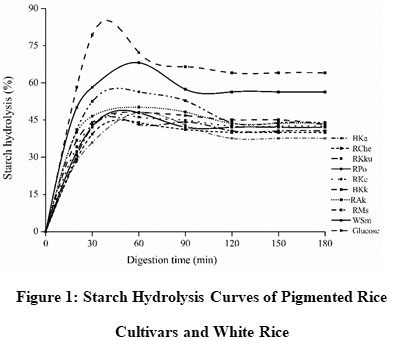 |
Figure 1: Starch Hydrolysis Curves of Pigmented Rice Cultivars and White Rice. |
BKa – Kattuyanam, RChe – Chennangi, RKku – Karungkuruvai, RPo – Poonghar, RKe – Kesari, BKk – Karupakavuni, RAk – Aruvadam Kuruvai, RMs – Mapillai Samba, and WSm – Sona Masuri (control)
Hydrolysis Index and Predicted Glycemic Index
The HI and pGI values of the experimental samples are given in Table 4 and Figure 2, respectively. BKa exhibited the least HI (17.27) and pGI (49.17) values. The highest HI (55.38) and pGI (70) values were found in RMs among the pigmented rice varieties. According to the classification given by Brand Miller et al.53, the experimental samples belonging to the low GI category (< 55) include BKa, RChe, RKku, and RPo; the medium GI category (55 – 69) includes RKe, BKk, and RAk; and the high GI category (70 and above) includes RMs.
Table 4: Equilibrium Concentration of Hydrolyzed Starch, Starch Hydrolysis Rate, Rapidly and Slowly Digestible Starch and Hydrolysis Index of Pigmented Rice Cultivars and White Rice.
| Sample | C∞ (%) | k (min-1) | RDS (g/ 100 g) | SDS (g/ 100 g) | HI |
| BKa | 37.63 a ± 0.04 | 0.055 a ± 0.004 | 28.31a ± 0.07 | 14.23 g ± 0.16 | 17.27 a ± 0.51 |
| RChe | 40.09 ab ± 0.16 | 0.068 b ± 0.007 | 29.81a ± 0.12 | 10.28 de ± 0.06 | 19.53 b ± 0.41 |
| RKku | 40.64 bc ± 0.11 | 0.066 b ± 0.018 | 32.31 b ± 0.03 | 11.63 ef ± 0.06 | 23.13 c ± 0.04 |
| RPo | 42.12bcd ± 0.21 | 0.073 c ± 0.051 | 31.21 b ± 0.16 | 9.43 d ± 0.08 | 26.28 cd ± 0.04 |
| RKe | 42.54 cd ± 0.16 | 0.084 d ± 0.009 | 34.23 bc ± 0.21 | 7.89 b ± 0.17 | 31.62 d ± 0.26 |
| BKk | 43.12 bcd ± 0.07 | 0.059 a ± 0.031 | 30.19 ab ± 0.09 | 13.49 f ± 0.06 | 35.36 e ± 0.55 |
| RAk | 43.68 d ± 0.05 | 0.076 c ± 0.013 | 29.32 a ± 0.03 | 8.31 c ± 0.14 | 47.18 f ± 0.11 |
| RMs | 43.94 d ± 0.06 | 0.078 cd ± 0.014 | 36.86 c ± 0.22 | 8.26 bc ± 0.18 | 55.38 g ± 0.02 |
| WSm | 56.38 e ± 0.04 | 0.100 e ± 0.011 | 40.12 d ± 0.54 | 6.26 a ± 0.22 | 66.47 h ± 0.46 |
BKa – Kattuyanam, RChe – Chennangi, RKku – Karungkuruvai, RPo – Poonghar, RKe – Kesari, BKk – Karupakavuni, RAk – Aruvadam Kuruvai, RMs – Mapillai Samba, and WSm – Sona Masuri (control).
C∞ – equilibrium concentrations, k – Digestibility rate constant, RDS – Rapidly digestible starch, SDS – Slowly digestible starch, HI – hydrolysis index,
Data are Mean ± SD (n = 3). Values in columns with different letters denote statistically significant differences, according to Tukey HSD test (p ≤ 0.05).
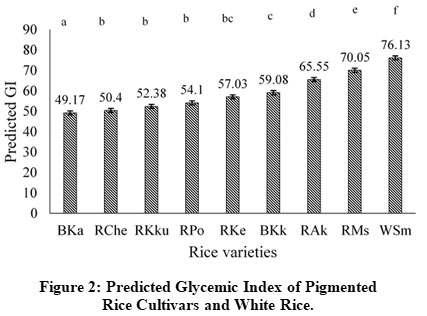 |
Figure 2: Predicted Glycemic Index of Pigmented Rice Cultivars and White Rice. |
BKa – Kattuyanam, RChe – Chennangi, RKku – Karungkuruvai, RPo – Poonghar, RKe – Kesari, BKk – Karupakavuni, RAk – Aruvadam Kuruvai, RMs – Mapillai Samba, and WSm – Sona Masuri (control)
Values are Mean ± SD (n = 3). Letters above the bars indicate homogeneous groups and denote statistically significant differences, according to Tukey HSD test (p ≤ 0.05)
Correlation Among Carbohydrate Components
The results of the correlation analysis among the different carbohydrate components are presented in Table 5. A highly significant positive correlation (at p ≤ 0.01) was observed between RS and all dietary fibre components, TDF (r = 0.889), SDF (r = 0.857), and IDF (r = 0.876). A strong positive correlation was also observed between amylose and dietary fibre contents at p ≤ 0.01. RS also had a significant (p ≤ 0.05) positive correlation with amylose content. With respect to digestible starch fractions, RDS had a significant negative correlation with amylose content, dietary fibre components and RS. Rapidly digestible starch had significant (p ≤ 0.05) positive correlation with the total starch content. A significant negative correlation was observed between total DS and TDF as well as IDF (r = 734; p ≤ 0.05).
Table 5: Pearson’s Correlation Coefficient Between Different Carbohydrate Components.
| TDF | SDF | IDF | AC | TS | RS | DS | RDS | SDS | |
| TDF | 1.000 | ||||||||
| SDF | 0.916** | 1.000 | |||||||
| IDF | 0.996** | 0.879** | 1.000 | ||||||
| AC | 0.878** | 0.947** | 0.845** | 1.000 | |||||
| TS | -0.577 | -0.483 | -0.585 | -0.507 | 1.000 | ||||
| RS | 0.889** | 0.858** | 0.877** | 0.784* | -0.384 | 1.000 | |||
| DS | -0.734* | -0.660 | -0.734* | -0.650 | 0.966** | -0.599 | 1.000 | ||
| RDS | -0.837** | -0.870** | -0.811** | -0.906** | 0.747* | -0.724* | 0.838** | 1.000 | |
| SDS | 0.655 | 0.621 | 0.648 | 0.563 | -0.588 | 0.691 | -0.706* | -0.722* | 1.000 |
TDF – Total dietary fibre, SDF – Soluble dietary fibre, IDF – insoluble dietary fibre, AC – Amylose content, TS – Total starch, RS – Resistant starch, DS – Digestible starch, RDS – Rapidly digestible starch, SDS – Slowly digestible starch
Correlation significant at *p ≤ 0.05, and ** p ≤ 0.01.
Correlation Between Carbohydrate Components and Pgi
The correlation results between in vitro glycemic response, pGI and carbohydrate components are presented in Table 6. A highly significant (p ≤ 0.01) negative correlation was observed for pGI with IDF (r = – 0.891;), RS (r = – 0.865) and TDF (r = – 0.84). SDS too showed a significant (p ≤ 0.05) negative correlation (r = – 0.745) with pGI. A non-significant negative correlation was observed for pGI with amylose content (r = – 0.742) and SDF (r = – 0.593).
Table 6: Pearson’s Correlation Coefficient of Carbohydrate Components with Hydrolysis Index and Predicted Glycemic Index.
| Variables | Hydrolysis index | Predicted glycemic index |
| Total dietary fibre | -0.841** | -0.840** |
| Soluble dietary fibre | -0.595* | -0.593 |
| Insoluble dietary fibre | -0.891** | -0.891** |
| Amylose | -0.732 | -0.742 |
| Total starch | 0.565 | 0.564 |
| Resistant starch | -0.865** | -0.865** |
| Digestible starch | 0.614 | 0.613 |
| Rapidly digestible starch | 0.593 | 0.589 |
| Slowly digestible starch | -0.753* | -0.745* |
Correlations are significant at *p ≤ 0.05, and ** p ≤ 0.01
Discussion
Carbohydrate Components
Dietary Fibre Components
Dietary fibre has been reported to exert several physiological health benefits such as loss of weight, laxative effect, lowering blood cholesterol levels, dietary management during diabetes, and improving gut health among others.25 The TDF and IDF values of the experimental pigmented samples were similar to the range reported by Deepa et al.26 i.e. TDF – 5.82 to 8.08 g/ 100 g and IDF – 5.39 to 7.56 100 g/100 g, but the SDF content of the experimental samples was slightly higher than the reported value (0.43 to 0.52 g/ 100 g) for two red rice varieties, Jyothi and Njavara from India. However, the SDF contents of the experimental samples were similar to the content reported (0.90 to 1.25 g/ 100 g) by Savitha and Singh27 for four other red rice varieties from India. The experimental samples had higher TDF content than those reported (2.82 to 4.51 g/100 g) in nine pigmented rice varieties from Thailand, Sri Lanka and China.28 The bran of pigmented rice is reported to contain 2 to 35 % higher dietary fibre content than bran of white rice varieties.29 Cellulose, arabinoxylans and pectin are the main classes of dietary fibre reported to be present in rice bran layer.30 The partially milled and parboiled sample, RMs had the least TDF and IDF content among the pigmented rice samples. It was reported by Savitha and Singh27 that on parboiling, 5 to 11% reduction of dietary fibre content was observed in 4 red rice varieties from India.
Amylose Content
Amylose has a lot of industrial importance in terms of medical treatments, improving food product properties, films and packaging development, textiles and paper making, optical fibres, printed circuit boards, electronic chips, etc.31 Amylose contents of the experimental samples were similar to the values reported by Thuengtung et al11 for red and black rice varieties (20 to 28 g/100 g) from Thailand. However, the experimental samples had higher amylose content than the values reported (22.7 and 22.9 g/100 g) for two other red rice varieties from India26 which could be due to varietal differences. The high amylose pigmented rice varieties identified in this study can have an important nutritional role by slowing the rate of starch digestibility and hence glucose release in the body, beneficial particularly to diabetics. Ingestion of high amylose rice in human volunteers have been earlier reported to significantly delay digestion and/ absorption of carbohydrates and to reduce serum glucose and insulin response.32
Rice starch Components
Total starch and digestible starch contents of the experimental samples were slightly lower than the values reported (TS – 79.56 to 84.30 g/ 100 g, DS – 79.16 to 83.96 g/ 100 g) by Deepa et al15 for two red rice varieties from India. The differences could be due to genotypic variation. However, Thuengtung et al11 reported similar TS content ranging from 71.44 to 73.76 g/ 100 g for three pigmented rice cultivars from Thailand.
Among all the starch components, Resistant starch (RS) has gained a lot of importance for its functional properties such as its lower influence on the sensory quality of food in comparison with traditional fibre sources. Its physicochemical properties like gel forming ability, swelling ability, viscosity, and water-binding capacity are more desirable, making it a beneficial ingredient in the food industry. More importantly, RS is reported to beneficially impact the working of the gastrointestinal tract, gut microbiota, the blood cholesterol level, and the glycemic index thereby, assisting in the regulation of glycaemic response, and hence, management of diabetes.33 The RS content of the experimental pigmented samples were within the range (0.35 to 2.57 g/ 100 g) reported in Jyothi and Njavara, two red rice varieties from India15, but were higher than the values reported (0.14 to 0.39 g/ 100 g) by Thuengtung et al11 for pigmented rice varieties from Thailand.
To understand the nutritional importance of starch, the concept of slowly digestible starch and rapidly digestible starch has been evolved. The positive health effects of SDS are related to regulated glucose metabolism, diabetes management, and satiety.34 The SDS contents of the experimental pigmented samples were higher than the range reported (0.3 to 6.2 %) for commercial white rice cultivars of different sizes from Canada, U.S, Italy, and Thailand.35 The RDS starch content of the pigmented rice varieties was lower than reported values (79.4 to 87.9 %) in the same study. The SDS content of the experimental samples were slightly lower than the reported value (48 %), and the RDS content was similar to the reported value (24.8 %) for Riceberry, a red rice from Thailand.14
Correlation Among Carbohydrate Components
The strong positive correlation observed between resistant starch (RS) and amylose level were in agreement with the literature.36Amylose content has been classified as a type of resistant starch, hence rice varieties having higher amylose content have been known to contain higher resistant starch.37 Several reasons have been speculated for the positive correlation between resistant starch and amylose content. The main enzyme accountable for amylose synthesis is granule bound starch synthase1 (gbssI) in the starch biosynthetic pathway. The RS content of rice grain is facilitated by soluble starch synthase enzyme which in turn requires high levels of gbssI expression38, hence leading to high amylose and RS content. Resistant starches are of different types. Type 5 RS is a stable complex formed between amylose and lipid. 8,34 The high amylose content recorded in the experimental samples could have contributed to the formation of type 5 RS, and overall a higher content of RS in the pigmented rice samples. A study reported that twenty rice varieties showed a positive correlation between RS and amylose content and confirmed that amylose could be used as a determining factor to correlate with RS in rice. 39
The positive correlation between RS and DF could be because RS is one of the many components that comprise dietary fibre. Resistant starches have also been reported to function similarly to dietary fibre in the large intestine.40 Deepa et al15 also reported a positive but insignificant correlation between RS and IDF (r = 0.624), and TDF (r = 0.6).
In Vitro Starch Digestibility and Hydrolysis Index
Cereals having low digestibility are desirable especially in the dietary management of metabolic conditions like diabetes.41 The C∞ of the experimental pigmented rice samples were lower than the values reported (61.5 and 65.2 %) for two red rice varieties from India15, but were higher than the reported values (9.52 to 13.25 %) for two red and two purple rice varieties from Thailand.13 Similar to the current study, this study also reported a lower C∞ in Thai pigmented rice varieties than the white rice, Hom Mali. The digestibility rate constant values of all the studied pigmented rice samples were similar to the values (k = 0.073 to 0.095) reported by Deepa et al for two other red rice varieties from India (Njavara and Jyothi).15 The hydrolysis indices of the studied pigmented samples were lower than the reported values (60.9 to 63.9) in two Indian red rice varieties15, and similar to the range reported (37.46 to 47.03) in pigmented rice varieties from Thailand13.
The lower starch digestibility of experimental pigmented rice varieties could be due to the presence of high RS. The digestibility of starchy foods like cereals has been reduced considerably due to the presence of RS which cannot be hydrolyzed by amylase enzymes.42 The dietary fibre, α-cellulose present in pigmented rice bran has been reported to inhibit α-amylase activity and slow the starch digestion rate through competitive inhibition due to the greater affinity of α-amylase for α-cellulose than starch.30 The role of amylose in slowing starch digestibility reported previously43 could be confirmed by the negative correlation observed between amylose and hydrolysis index in the present study. Low amylose content results in low hydrogen bonds formed between chains which induces weak arrangement of the crystalline starch structure, which could result in a greater vulnerability to enzyme hydrolysis and an increase in the kinetic rate constant.44 The significantly lower resistant starch and amylose content in WSm could have contributed to its rapid starch digestion rate.
In Vitro Glycemic Response and Influence of Carbohydrate Components
The pGI values indicative of in vitro glycemic response of the experimental pigmented rice samples were lower than the values reported (pGI – 73.1 to 74.8) by Deepa et al.15 and lower or similar to the values reported (pGI – 60.79 to 70.36) by Kumar et al.38 for different pigmented and brown rice varieties from Southern and Eastern regions of India, respectively. Majority of the samples in the present study also recorded lower pGI values compared to those (pGI 65 to 83) reported in ten pigmented rice cultivars from Thailand.45,14 The pGI values of the experimental samples BKa and BKk were similar to the in vivo GI values of the same varieties (BKa – 47 and BKk – 56) reported by Meera et al.16 indicating the robustness of the in vitro method used. Two other varieties in the same study have recorded GI greater than 60. In an in vivo study on four Sri Lankan pigmented rice46 only one variety (Wedaheenati) was reported to have a low GI (52.5), whereas the other three rice varieties were reported to have medium GI values (56.3 – 64). The higher pGI of RMs in this study could be because the sample was partially milled and had relatively lower levels of dietary fibre and amylose content. Somaratne et al.47reported that the in vivo GI of red rice basmati varieties, CIC-RB and CIC-RF increased by 11% and 17.6% respectively, when the rice milling level was increased from 10 % to 100 %.
The low pGI experimental pigmented rice varieties could be used as a gluten free healthier alternative, especially in the global dietary management of diabetes.
Among all the starch fractions, RS was observed to be one of the key factors affecting the glycemic index of the experimental rice samples. Kumar et al.38 in their study on 24 rice genotypes also observed a strong correlation between RS and pGI. Van Hung et al.48 also reported a significant negative correlation (r = – 0.747; p ≤ 0.01) between RS and predicted GI in a study on white rice varieties from Vietnam. The other carbohydrate fractions with a major influence on glycemic response were IDF and TDF. In line with this observation, Wolever49 also reported a significant correlation (r = – 0.461; p ≤ 0.05) for TDF and IDF from different carbohydrate-based foods with their in vivo GI values. Similar to our study, Odenigbo et al.50 reported a negative correlation between SDS and pGI in a study on starch digestibility of fried sweet potato.
Amylose content has been reported to negatively correlate with glycemic index8 as observed in the present study. However, in the present study it was not found to be a significant correlation. This could be because all the experimental pigmented rice varieties except RMs had similar high amylose content. The significant differences in the predicted glycemic index among all the experimental samples having similar amylose content indicate that factors other than amylose content, such as granule size, physicochemical properties, and degree of crystallinity could also play a major role in affecting the starch digestibility51 , hence the resultant glycaemic response. A recent review has reported non-starch components such as dietary fibre to have a greater influence on the starch digestibility of rice than factors such as amylose content52 as observed in the present study.
This study has helped to identify four pigmented rice varieties from the southern part of India having low, and three having medium in vitro GI which could be beneficial to the huge rice-eating population. The study indicates that the levels of IDF, TDF and RS could be used to get a preliminary assessment of the glycemic response of pigmented rice cultivars as they were found to be significantly inversely related to pGI. The study revealed that processing (milling and parboiling) of pigmented rice sample affect the GI and needs to be considered while evaluating their glycemic response. Some of the experimental samples exhibiting high levels of resistant starch, dietary fibre, amylose content and slowly digestible starch content could also provide several other physiological health benefits making them a choice ingredient in designing functional foods.
Acknowledgement
The authors are grateful to the founder Chancellor and acknowledge the management, Sri Sathya Sai Institute of Higher Learning, Andhra Pradesh, India for the research facilities provided.
Funding Sources
The first author acknowledges SSSIHL for the research fellowship. The research was supported by the Indian Council of Medical Research (ICMR) through a project grant (No. 5/9/1205/2019-Nut) to the corresponding author.
Conflict of Interest
The authors declare no conflict of interest.
References
- Hu E. A., Pan A., Malik V., Sun Q. White rice consumption and risk of type 2 diabetes: meta-analysis and systematic review. BMJ. 2012; 344: e1454
CrossRef. - Venn B. J., Green T. J. Glycemic index, and glycemic load: measurement issues and their effect on diet–disease relationships. Eur J Clin Nutr. 2007; 61(S1): S122.
CrossRef. - Germaine K. A., Samman S., Fryirs C. G., Griffiths P. J., Johnson S. K., Quail K. J. Comparison of in vitro starch digestibility methods for predicting the glycaemic index of grain foods. J Sci Food Agric. 2008; 88(4): 652-658.
CrossRef. - Goñi I., Garcia-Alonso A., Saura-Calixto F. A starch hydrolysis procedure to estimate glycemic index. Nutr Res. 1997; 17(3): pp.427-437.
CrossRef. - Granfeldt Y., Eliasson A. C., Björck I. An examination of the possibility of lowering the glycemic index of oat and barley flakes by minimal processing. J Nutr. 2000; 130(9): 2207-2214.
CrossRef. - Englyst K. N., Englyst H. N., Hudson G. J., Cole T. J., Cummings J. H. Rapidly available glucose in foods: an in vitro measurement that reflects the glycemic response. Am J Clinl Nutr. 1999; 69(3): 448-454.
CrossRef. - Wang Q., Xia W., Zhao Z., Zhang H. Effects comparison between low glycemic index diets and high glycemic index diets on HbA1c and fructosamine for patients with diabetes: A systematic review and meta-analysis. Prim Care Diabetes. 2015; 9(5): 362-369.
CrossRef. - Miller J. B., Pang E., Bramall L. Rice: a high or low glycemic index food? Am J Clinl Nutr. 1992; 56(6): 1034-1036.
CrossRef. - Björck I., Granfeldt Y., Liljeberg H., Tovar J., Asp N. G. Food properties affecting the digestion and absorption of carbohydrates. Am J Clin Nutr. 1994; 59(3): 699S-705S/.
CrossRef. - Atkinson F. S., Foster-Powell K., Brand-Miller J. C. International tables of glycemic index and glycemic load values: 2008. Diabetes Care. 2008; 31(12): 2281-2283.
CrossRef. - Thuengtung, Niwat C., Tamura M., Ogawa Y. In vitro examination of starch digestibility and changes in antioxidant activities of selected cooked pigmented rice. Food Bio Sci. 2018a; 23: 129-136.
CrossRef. - Thuengtung S., Ogawa Y. Morphological structure, starch fractions and starch digestibility of three pigmented rice cultivars cooked by microwave cooking. J Food Sci Agri Tech. 2018b; 4: 17-22.
- Ratseewo, Warren F. J., Siriamornpun S. The influence of starch structure and anthocyanin content on the digestibility of Thai pigmented rice. Food Chem. 2019; 298: 124949.
CrossRef. - Thiranusornkij L., Thamnarathip P., Chandrachai A., Kuakpetoon D., Adisakwattana, S. Comparative studies on physicochemical properties, starch hydrolysis, predicted glycemic index of Hom Mali rice and Riceberry rice flour and their applications in bread. Food Chem. 2019; 283: 224-231.
CrossRef. - Deepa G., Singh V., Naidu K. A. A comparative study on starch digestibility, glycemic index and resistant starch of pigmented (‘Njavara’and ‘Jyothi’) and a non-pigmented (‘IR 64’) rice varieties. J Food Sci Technol. 2010; 47(6): 644-649.
CrossRef. - Meera K., Smita M., Haripriya S., Sen S. Varietal influence on antioxidant properties and glycemic index of pigmented and non-pigmented rice. J Cereal Sci. 2019; 87: 202-208.
CrossRef. - Official methods of analysis of the association of analytical chemists (16th ed) (Volume II). 1997; Airlington, Virginia, USA: Association of Official Analytical Chemists.
- Ghoora M D, Babu D R, Srividya N. Nutrient composition, oxalate content and nutritional ranking of ten culinary microgreens. J Food Comp Anal. 2020: 103495.
CrossRef. - Lim S. T., Lee J. H., Shin D. H., Lim H. S. Comparison of protein extraction solutions for rice starch isolation and effects of residual protein content on starch pasting properties. Starch‐Stärke. 1999; 51(4): 120-125.
CrossRef. - Kaufman R. C., Wilson J. D., Bean S. R., Herald T. J., Shi Y. C. “Development of a 96-well plate iodine binding assay for amylose content determination.” Carbohydr Polym. 2015; 115: 444-447.
CrossRef. - de Guzman M. K., Parween S, Butardo V. M., Alhambra C. M., Anacleto R., Seiler C., Sreenivasulu N. Investigating glycemic potential of rice by unraveling compositional variations in mature grain and starch mobilization patterns during seed germination. Sci Rep. 2017; 7(1): 1-14.
CrossRef. - Goñi I., Garcia-Diz L., Mañas E., Saura-Calixto F. Analysis of resistant starch: a method for foods and food products. Food Chem. 1996; 56(4):445-9.
CrossRef. - Frei M., Siddhuraju P., Becker K. Studies on the in vitro starch digestibility and the glycemic index of six different indigenous rice cultivars from the Philippines. Food Chem. 2003; 83(3): 395-402.
CrossRef. - Kumar I., Khush G. S. Gene dosage effect of amylose content in rice endosperm. J. Genet. 1986; 61:559-568.
CrossRef. - Schweizer T. F., Würsch P. The physiological and nutritional importance of dietary fibre. Experientia. 1991; 47(2): 181-186.
CrossRef. - Deepa G., Singh V., Naidu K. A. Nutrient composition and physicochemical properties of Indian medicinal rice–Njavara. Food Chem. 2008 106(1): 165-171.
CrossRef. - Savitha Y. S., Singh V. Status of dietary fiber contents in pigmented and non-pigmented rice varieties before and after parboiling. LWT-Food Sci Tech. 2011; 44(10): 2180-2184.
CrossRef. - Sompong R., Siebenhandl-Ehn S., Linsberger-Martin G., Berghofer E. Physicochemical and antioxidative properties of red and black rice varieties from Thailand, China, and Sri Lanka. Food Chem. 2011; 124(1): 132-140.
CrossRef. - Kalpanadevi C., Singh V., Subramanian R. Influence of milling on the nutritional composition of bran from different rice varieties. J Food Sci Tech. 2018; 55(6): 2259-2269.
CrossRef. - Dhital S., Gidley M. J., Warren F. J. Inhibition of α-amylase activity by cellulose: Kinetic analysis and nutritional implications. Carbohydr Polym. 2015; 123: 305-312.
CrossRef. - Guo Z., Wang Y., Zhang J., Zhang Y., Wang J., Xie Z., Chen Z. Development of transgenic high-amylose potato using a novel RNAi vector. Acta Agro Sini. 2009; 35(5): 809-815.
CrossRef. - Goddard, M. S., Young, G., Marcus, R. The effect of amylose content on insulin and glucose responses to ingested rice. Am J Clinl Nutr. 1984; 39(3): 388-392.
CrossRef. - Fuentes-Zaragoza E., Riquelme-Navarrete M. J., Sánchez-Zapata E., Pérez-Álvarez J. A. Resistant starch as functional ingredient: A review. Food Res Int. 2010; 43(4): 931-942.
CrossRef. - Lehmann U., Robin F. Slowly digestible starch–its structure and health implications: a review. Trends Food Sci Technol. 2007; 18 (7): 346-355.
CrossRef. - Chung H. J., Liu Q., Huang R., Yin Y., Li A. Physicochemical properties, and in vitro starch digestibility of cooked rice from commercially available cultivars in Canada. Cereal Chem. 2010; 87(4): 297-304
CrossRef. - Eggum B. O., Juliano B. O., Perez C. M., Acedo E. F. The resistant starch, undigestible energy and undigestible protein contents of raw and cooked milled rice. J Cereal Sci. 1993; 18(2): 159-170.
CrossRef. - Kim J. C., Mullan B. P., Hampson D. J., Pluske J. R. Effects of amylose content, autoclaving, parboiling, extrusion, and post-cooking treatments on resistant starch content of different rice cultivars. Aust J Agric Res. 2006; 57(12): 1291-1296.
CrossRef. - Kumar A., Sahoo U., Baisakha B., Okpani O. A., Ngangkham U., Parameswaran C., Sharma S. G. Resistant starch could be decisive in determining the glycemic index of rice cultivars. J Cereal Sci. 2018; 79: 348-353.
CrossRef. - Ramadoss B. R., Gangola M. P., Agasimani S., Jaiswal S., Venkatesan T., Sundaram G. R., Chibbar R. N. Starch granule size and amylopectin chain length influence starch in vitro enzymatic digestibility in selected rice mutants with similar amylose concentration. J Food Sci Tech. 2019 56(1): 391-400.
CrossRef. - Muir J. G., O’dea K. Measurement of resistant starch: factors affecting the amount of starch escaping digestion in vitro. Am J Clin Nutr. 1992; 56(1): 123-127.
CrossRef. - Grabitske H. A., Slavin J. L. Low-digestible carbohydrates in practice. J Amer Diet Assoc. 2008; 108(10): 1677-1681.
CrossRef. - Biliaderis C. G., Izydorczyk M. S. (Eds.). Functional food carbohydrates. 2006; CRC Press, Boca Raton, Florida, USA.
CrossRef. - Juliano B. O., Goddard M. S. Cause of varietal difference in insulin and glucose responses to ingested rice. Plant Food Hum Nutr. 1986; 36(1): 35-41.
CrossRef. - Jane J. L., Wong K. S., McPherson A E. Branch-structure difference in starches of A-and B-type X-ray patterns revealed by their Naegeli dextrins. Carbohydr Res. 1997; 300(3): 219-27.
CrossRef. - Ponjanta J., Chomsri N. O., Meechoui S. Correlation of pasting behaviors with total phenolic compounds and starch digestibility of indigenous pigmented rice grown in upper Northern Thailand. Funct Food Health Dis. 2016; 6(3): 133-143.
CrossRef. - Prasantha B. D. R. Glycemic index of four traditional red pigmented rice. Integr Food Nutr Metab. 2018; 5(5): 1-3.
CrossRef. - Somaratne G. M., Prasantha B. D. R., Dunuwila G. R., Chandrasekara A., Wijesinghe D. G. N. G., Gunasekara D. C. S. Effect of polishing on glycemic index and antioxidant properties of red and white basmati rice. Food Chem. 2017; 237: 716-723.
CrossRef. - Van Hung P., Chau H. T., Phi N. T. L. In vitro digestibility and in vivo glucose response of native and physically modified rice starches varying amylose contents. Food Chem. 2016; 191: 74-80.
CrossRef. - Wolever T. M. Relationship between dietary fiber content and composition in foods and the glycemic index. Am J Clin Nutr. 1990; 51(1): 72-75.
CrossRef. - Odenigbo A., Rahimi J., Ngadi M., Amer S., Mustafa A. Starch digestibility and predicted glycemic index of fried sweet potato cultivars. Funct Food Health Dis. 2012; 2(7): 280-289.
CrossRef. - Panlasigui L. N., Thompson L. U., Juliano B. O., Perez C. M., Yiu S. H., Greenberg G. R. Rice varieties with similar amylose content differ in starch digestibility and glycemic response in humans. Am J Clin Nutr. 1991; 54(5): 871-877.
CrossRef. - Khatun A., Waters D. L., Liu L. A review of rice starch digestibility: effect of composition and heat‐moisture processing. Starch‐Stärke. 2019; 6: 1-14.
CrossRef. - Brand Miller J., Foster-Powell K., Colagiuri S., Leeds A. The GI Factor. Rydalmere, NSW: Hodder Headline Australia, 1998.
Scopus Citation(s): 13
Accepted on: 1/9/2020
Second Review by: LAURA OKPALA Nigeria
Final Approval by: Suhad Maatoug Bahijri


Web of Science Coverage
Emerging Sources Citation Index (ESCI)
2024 Journal Impact Factor: 1.1
Scopus Journal Metrics
CiteScore 2025: 2.6
CiteScore Details
Sustainable Nutrition: Food Systems, Nutrient Retention, and Public Health Impact
![]()
This journal is a member of, and subscribes to the principles of, the Committee on Publication Ethics (COPE)


