


Introduction
Naturally, astaxanthin (3,3′-dihydroxy-β,β-carotene-4,4′-dione) found in various sources of marine and aquatic animals. Among the green microalgae, Hematococcus Pluvialis produces the highest amount of astaxanthin which is about 3.8% of dry weight.1 Astaxanthin provides a red or pink color related to the special molecular structure. Natural astaxanthin has two similar asymmetric carbon atoms at C-3 and C-3′, allowing three optical isomers of all-trans chain configuration: (3S,3′S) in which different organisms produced astaxanthin in different stereoisomer ratios. Meanwhile, a synthetic form has a mixture of isomers (3S,3′S), (3S,3R) and (3R,3′R) at a ratio of 1:2:1 respectively.2
The potency of astaxanthin antioxidant activities has been compared in many studies that reported the efficacy of astaxanthin to be 65 times more than vitamin C, 54 times higher than β-carotene, 10 times stronger than other carotenoid derivatives; and 100 times powerful than α-tocopherol.3,4,5,6,7 Recent studies on astaxanthin were conducted in a variety aspects such as decrease oxidative stress and inflammatory,8 anti-diabetic effects,9 anti-cancer10 and anti-lipid peroxidation activity.11
Currently, many researchers have focused their attention on developing foods containing natural phytochemicals extracted from seaweed and algae.12,13 Application of marine algae can be useful for the purpose of functional food enriched with antioxidant ingredients that can inhibit lipid oxidation. Lipid oxidation is one of the phenomena occurring in the food system, particularly for food containing lipid. Unpleasant flavors and odors in food products are produced as lipid oxidation, which affects food quality and shortens shelf life. Rancidity produced from the oxidation of lipid which renders them unacceptable for consumption.14
Exposing food lipid to factors such as heat, light, or metal ions could contribute to the creation of double bond hydrogen atoms and the development of free or alkyl radicals that could accelerate oxidation reactions.15 Hydroperoxide is one of the primary oxidation products formed by a complex process of initiation, propagation and termination.16 Generally, the primary oxidation products are unstable, thus promoting the formation of carbonyl compounds such as aldehyde, ketones and alcohol.17 The presence of lipid oxidation products may have adverse effects on human health which lead to mutagenic, carcinogenic and cytotoxic properties.16
Nowadays, astaxanthin represents its market interest in numbers of new food products, such as in sports nutrition and powdered instant beverages that provide a distinctive feature and added health benefits.18 In the food industry, astaxanthin not only used as a food colorant agent but also as a functional ingredient for anti-aging and immune enhancement19 also used as a raw material for dietary supplements.18 Taking into account its antioxidant power, astaxanthin has been commercialized in the form of nutraceutical capsules gel. This study is aimed to investigate the antioxidant capacity of astaxanthin in the samples that were dissolved in different organic solvents and the lipid stability of cookies contain different concentrations of astaxanthin powder after kept at different storage temperature and time.
Materials and Methods
Materials
Astaxanthin powder purchased from the BGG company in China (AstaZine®; SDHP-05) was tested for its antioxidant activity and used to make cookies. The sample contains 97% pure astaxanthin and 3% supporting carotenoids that were extracted from green microalgae of Hematococcus pluvialis. It was stored below 8°C and vacuum-packed using a foil bag. Analytical solvent (for astaxanthin dissolving) acetone, DMSO and n-methanol were all purchased from Fisher Scientific (M) Sdn. Bhd. The wheat flour was purchased from the local market in Kuala Terengganu.
Sample Preparation
Astaxanthin (10 mg) was dissolved in (20 ml) acetone 40% (v/v), DMSO and n-methanol at room temperature (28°C) under dim light, the dissolved samples were centrifuged at 5000 rpm for 10 min at 4°C. The supernatant was aspirated and stored at a chiller (3°C) with the no-oxygen condition until used.
Antioxidant Activities of Astaxanthin
Astaxanthin antioxidant activity was determined by DPPH assay (2,2-diphenyl-1-picrylhydrazyl) using the method described by.20 Briefly, 100 µl of the sample was mixed 3900 µl of purple methanolic DPPH (Sigma-Aldrich) that was freshly prepared. Complete mixture carried to 4.0 ml. The samples were incubated at ambient temperature for 30 min and the absorbance was taken by UV-spectroscopy (Spectroquart® Phano300) at 515 nm. All procedures were performed in dim light. The percentage of the DPPH free radical was calculated using the following equation:
%DPPH radical scavenging (%) = [(Ablank – Asample) /Ablank] *100
The astaxanthin’s antioxidant activity dissolved in different solvents was determined by its hydroxyl radical (OH•) scavenging activity as according to 21 with some modification. The stock solution prepared contains phosphate buffer saline (PBS, 0.01M, pH 7.4), phenanthroline (0.75 M) and ferrous sulphate (0.75 mM). Then the solution was mixed with 2ml of phenanthroline and 4ml phosphate buffer, 2ml ferrous sulphate followed by 2 ml of astaxanthin sample, finally added 2 ml 0.01% H2O2(w/v). The absorption of the resulting sample was measured at 536 nm after 1 hr room temperature incubation. Sample volume and hydrogen peroxide were substituted by distilled water using the same volume. The scavenging activity on hydroxyl radicals (HRSA) was calculated by using the equation:
HRSA (%) = [(Acontrol – Asample) /Acontrol] *100
The FRAP method was carried out according22 with some modification. The FRAP solutions included 300 mM of acetate buffer, TPTZ (2,4,6 Tripyridyl-s-triazine) solution (10 Mm) was dissolved in 40 mM HCl and 20 mM Iron (III) chloride hexahydrate (Fecl3-6H2O). The fresh solution was prepared by mixing astaxanthin 0.15 ml with 25 mL acetate buffer, 2.5 mL TPTZ solution, and 2.5 mL FeCl3 – 6H2O solution, followed by incubation at room temperature for 30 min. The reading for colored solutions was taken at 593 nm. All steps were carried out in a dark room. Data were interpreted by using the Trolox standard curve linear at different concentrations between 25 and 800 mM. The results are expressed in mMTE/g of the astaxanthin sample.
Cookie Formulation and Preparation
Cookie formulation was prepared regarding to American Association of Cereal Chemistry (AACC) standard with some modification. Cookies consisted of 10%, 15% and 20% of astaxanthin in proportion to wheat and pastry flour content. The control sample was prepared without the addition of astaxanthin. Certain ingredients used: shortening, sugar, sodium bicarbonate, salt and water as shown in (Table 1). All the components were mixed in a mixer (Hobart C- 100) and kneaded with an electric laminator to improve dough properties and reduce dough thickness by using a standard 1.3 mm steel matrix. The cookie dough was spread to a 5 mm thickness by using the kitchen roller and was cut into similar pieces by cookie-cutter at 46 mm diameter for the same shape in all formulations. The cookies were placed in metal trays and were baked in an electrical oven (SOUTHSTAR model) at 150°C for 17 min. The cookies were then allowed to cool at room temperature, packed in an airtight and dark plastic bag before being stored at room temperature (28°C).
Table 1: Formulation Cookies with Different Levels of Astaxanthin.
| Ingredients (g/100g) | Level of substitution | |||
| Control | 10%/100g | 15%/100g | 20%/100g | |
| Wheat flour (g) | 112.00 | 101.25 | 95.60 | 90.00 |
| Pastry flour (g) | 112.00 | 101.25 | 95.60 | 90.00 |
| Shortening fat (g) | 60.00 | 60.00 | 60.00 | 60.00 |
| Brown sugar (g) | 100.00 | 100.00 | 100.00 | 100.00 |
| Sodium bicarbonate (g) | 1.00 | 1.00 | 1.00 | 1.00 |
| Salt (g) | 2.10 | 2.10 | 2.10 | 2.10 |
| Water (ml) | 80.00 | 80.00 | 80.00 | 80.00 |
| Astaxanthin powder (g) | 0.00 | 22.50 | 33.75 | 45.00 |
Sensory Evaluation
Sixty untrained panelists from Fisheries and Food Science school, University Malaysia Terengganu were selected to evaluate product acceptability. 9-points hedonic scale was used with 1- “like very much”, 5- “either like nor dislike” and 9- “dislike very much”. Every panelist received a score sheet to help them to note their expression. Three-digit random code numbers were assigned to each sample by using the Table of Random Digits. Then, the sample presentation order was arranged according to Random Permutation Table with several arrangements to avoid bias. The attributes are chosen to evaluate the cookies including the appearance, color, aroma, taste, sweetness and texture. The data was analyzed using Turkey test of variance analysis (ANOVA) and the results were interpreted as the average of individual scores.
Physical Properties
Cookie diameter and thickness were measured at three different places using a vernier caliper and the mean was calculated for each one. The weight of cookies was measured using an electrical weighing scale (SARTORIUS, Germany) by weighing three cookies of each formula, and the average was calculated for each one.
Color Analysis
Cookies color was measured by handheld tristimulus reflectance colorimeter (Konica Minolta, B8204473). It was measured by using L*, a*, b* uniform color space, so that L* indicates of lightness, while a* indicates to chromaticity the green color (-) and red color (+) and, b* parameter indicates to chromaticity goes from blue (-) to yellow (+). Three points were measured on each cookie and the mean of measurements was registered. Meanwhile, the total color difference (∆E) and hue chroma were determined by the following equations:
∆E = [(∆a)2 + (∆b)2 + (∆L)2]1/2
chroma = [(∆a)2 + (∆b)2]1/2
Texture Analysis
The baked cookies texture profile was measured using a texture analyzer (TA.TX-PLUS) in compression mode including hardness and fracturability. The penetration test conditions included an HDP13PB probe with a 6.5 mm diameter and a load cell of 30 kg. Triplicates for each penetration recorded the hardness and the maximum peak force. The peak force reported breaking the cookies as a feature force in Newton (N).
Proximate Analysis
The chemical composition of the enriched cookies with different concentrations of astaxanthin (10%, 15% and 20%) were evaluated for moisture, ash, crude fiber, crude protein, fat and carbohydrate content. All analysis was carried out as in accordance to AOAC methods.23
Stability of Lipid Fraction in Cookies
The stability of lipid fraction from the formulated cookies was measured as in accordance to.24 Cookies of 100 g were ground and the lipid was extracted using 250 ml diethyl ether at 37oC for 60 min by placing it in a water bath shaker (memmert, WNB). The mixture was filtered and separated by using Smith filter paper (101 Qualitative Ø125), the sample was evaporated at 50°C using a rotary evaporator (BucHI Rotavapor R200). The extracted lipids were frozen at (−18°C) for further use. Cookies lipid fraction stability was observed periodically at different temperatures (room temperature (28 oC), 40oC and 50°C) at 0, 7, 14 and 21 days of storage. Stability of astaxanthin-containing cookies was evaluated by determining the following measurement:
Peroxide Value (PV) Determination
Peroxide value was measured by dissolving 5 g of cookies sample into 10 ml of chloroform, mixing with 15 ml glacial acetic acid and 1 ml of saturated potassium iodide (KI) solution. The mixtures were placed in a dark room for 5min before adding 75 ml of distilled water and vigorously shaken the mixture. Then 1ml of 1% starch was added, making the mixture color turned to dark blue. After- that the final solution was titrated with 0.002 N sodium thiosulphate (Na2S2O3) until the color change. The procedure was repeated as same for blank (without lipid).24 For triplicate samples, the values were measured. For peroxide value was calculated as:
PV= (V1– V0)* N* 1000 / W
Where:
V1 = amount of Na2S2O3 used for titration (ml)
V0 = amount of Na2S2O3 used for the blank (ml)
N = normality of Na2S2O3
W = amount of sample (mg)
p-Anisidine Value (p-AV) Determination
p-Anisidine solution (Sigma Aldrich) was obtained by mixing 250 mg in 100 ml glacial acetic acid. In this experiment, 100 mg of lipid extraction was dissolved with 25 ml of isooctane (test solution a). Then 5 ml of solution (a) mixed with 1 ml of p-anisidine (test solution b). The reference solution was prepared by mixed 1ml p-anisidine solution stock with 5 ml of isooctane. The solution was incubated at room temperature (28°C) for 10 min, then shaken vigorously (ling et al., 2013). The absorbance for the reference solution and samples were measured at 350 nm by visible spectroscopy (Thermospectronic). P-anisidine value was determined by the following equation:
P-Anisidine value = 25 (1.2A1– A2) / m
Where:
A1 = absorbance of test solution (b) at 350 nm
A2 = absorbance of test solution (a) at 350 nm
m = mass of the substance to be examined in test solution (a), in mg
Total Oxidation Value (TOTOX) Determination
The TOTOX value was calculated as equal to the sum of the p-AV value plus twice the PV as the following equation:
TOTOX value = (2PV+p-AV)
Fatty Acid Composition Determination
Fatty acid methyl esters (FAME) were prepared by dissolving 20 mg of lipid extraction in 800 µl of hexane and adding 200 µl of 1M sodium methoxide. Until processing, The samples were freshly prepared before testing and were conducted under dim light. They were analyzed using a gas chromatograph (SHIMADZU) with an FID detector and Omega wax™ 320 column (30m×0.32mm×0.25mm). The gas flow rates used were 400 ml/min using H2 as a carrier gas. The sample injection rate (split) was 1/10, the temperature of the injector and detector were set at 260°C. Although, the column temperature was programmed to 50°C for 2min, followed by a ramp of 4°C /min up to 210°C. The carrier was set at isothermal temperature 25 cm/sec. Total analysis time was 82min and injections of 1 µL were performed. The identification of the peaks of the samples was interpreted with FAME standards (Supelco). Fatty acids were calculated as the ratio of the partial area to the area of the total peaks.
Statistical Analysis
All the experiments were repeated in triplicates and the results were expressed as the mean ± SD. Statistical analysis of variance analysis (ANOVA) was applied followed by Tukey’s HSD post hoc test (IBM SPSS software, version 20). The results were considered significantly different if P<0.05. Lipid peroxidation was examined using two-way ANOVA in which the difference between treatments was analyzed using a multiple range test. The interaction between treatments was evaluated using Tukey’s HSD post hoc test with multiple range test.
Results and Discussion
Antioxidant Activity
The level of astaxanthin extraction and antioxidant activity may be affected by the solubility of astaxanthin in the extractant or solvent used. Lipophilic properties in astaxanthin structure limited its solubility and bioavailability. Poor aqueous solubility of astaxanthin is used particularly in an aqueous-phase antioxidant.25 Comparison of antioxidant activity of astaxanthin dissolved in acetone 40%, DMSO and methanol were analysed using DPPH, HRSA and FRAP assays. Antioxidant activity analysed using DPPH assay showed no significant difference between different dissolving reagents as shown in (Table 2). Meanwhile, for HRSA and FRAP assays, the highest antioxidant activities were examined in acetone 40% and DMSO, respectively.
Table 2: Antioxidant activities of astaxanthin in different organic solvents as determined by the DPPH, HRSA and FRAP activity#.
| Samples | DPPH (%) | HRSA (%) | FRAP (µm TE/g) |
| ASTA in 40% acetone | 90.72 ± 0.01a | 38.00 ± 0.02a | 243.90 ± 0.03b |
| ASTA in DMSO | 97.33 ± 0.01a | 22.21 ± 0.02b | 389.40 ± 0.05a |
| ASTA in methanol | 91.04 ± 0.00a | 16.01± 0.00b | 219.30 ± 0.02b |
#All values are calculated as the mean of three replicates.
Values are mean ± SD within a column with a different letter (a-c) are significantly different (p≤0.05).
DPPH assay is based on measuring antioxidant compounds to act as free radical scavengers or hydrogen donors.26 Although, antioxidant power using FRAP assay is based on reduction capacity Fe3+ to Fe2+ which causes a colored ferrous-TPTZ complex to form.27 In this study, astaxanthin using DMSO showed the highest ability to reduce Fe3+ to Fe2+ in FRAP assay. The presence of a conjugated double bond at the center of the compound was believed to act as an active antioxidant by electrons donating and reacting free radicals to promote highly stable products.28 Astaxanthin capacity to quench hydroxyl radicals could be associated with lipid peroxidation prevention.
Typically, the results showed that DMSO presented the best astaxanthin solubility solvent. This is in accordance with29 that mentioned astaxanthin extractability from Hemattococcus pluvialis using DMSO was substantially higher than acetone and methanol. Previously, natural astaxanthin recovery has been evaluated including the effect of the type of solvents used for extraction, pretreatment techniques, extraction using vegetable oils, microwave or ultrasound-assisted solvent extraction.30 As the composition of the food is complex and the separation of each antioxidant compound is varied, different assays of antioxidant activity would give different results. It is difficult to compare results from different assays as each assay was affected by several variables; substrates, reaction conditions and quantitation methods.31
Sensory Evaluation
The results of the sensory evaluation of cookies for different concentrations of astaxanthin is presented in (Table 3).
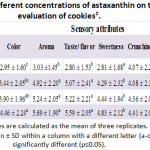 |
Table 3: Effect of different concentrations of astaxanthin on the sensory evaluation of cookies#. |
According to the data, increasing the mean value means the recognition of the particular attribute decreases. The result shows that the appearance, color, aroma, taste, sweetness, mouthfeel and overall acceptability provided the considerable difference in acceptability between the non-added astaxanthin and the cookies formulated with astaxanthin. However, increasing astaxanthin concentration to 20% did not affect the aroma, taste/flavor, sweetness, mouthfeel and overall acceptability of the astaxanthin formulated cookies. The rise in astaxanthin only significantly affected the appearance and color of the cookies. This may be due to the increased red color intensity of astaxanthin that psychologically affected the respondent’s perception towards the cookies. Due to its natural taste and appearance of astaxanthin is not always acceptable for ingested every day, so the addition is suggested intentionally for nutritious food or as a favorite beverage.32 It is recommended to develop the product by adding flavor like vanilla, chocolate, honey or nuts to decrease fishy taste, further research to use proper packaging material you will able to avoid costs and keep the product safe against spoilage.
Significant difference in taste and aroma for astaxanthin added cookies than the control (0% astaxanthin), could be due to the fishy flavor that naturally exists in the microalgae extracted astaxanthin. In general, the addition of astaxanthin from 10 to 20% of astaxanthin did not affect the acceptability for most of the sensory attributes including the taste, aroma, sweetness, crunchiness, mouthfeel and overall acceptability. It was reported that the stability of astaxanthin could be influenced by its properties such as astaxanthin color degradation and composition as affected by the properties of fatty acid present in the extracted compound.33
Physiochemical Evaluation
Visualized food color is one of the main factors affecting consumer product acceptability in the market. color and texture of cookies evaluation are summarised in (Table 4). The results showed that the lightness of cookies (L*) decreased significantly with the increase astaxanthin at (P≤0.05). The decrease of L* indicated that the color was darker at a higher level of plant pigment level.34 Thus, a contrast pattern was noted for the redness (a*) value, while decreased for yellowness (b*) value. This finding is in agreement with,35 in which major color variations were observed with astaxanthin in their three types of flour cookies. Changes in cookie color can also occur due to chemical reaction between reducing sugars and amino acids, known as Maillard reaction36, as well as the natural color of brown sugar. Another reaction called caramelization could lead to browning of cookies when sugar is heated during baking.47
The most important feature observed in the study was the hardness of cookies, in which the hardness decreased significantly at (p≤0.05) in the sample with 15% and 20% of astaxanthin. The decreased in hardness might be due to changes in gluten content35 corresponding to the wheat flour. Another factor contributing to the hardness might be due changing in the water holding capacity related to the nature of starch-protein interface.37
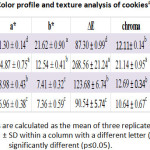 |
Table 4: Color profile and texture analysis of cookies#. |
Table 5 indicates the chemical composition contains in the cookies or different concentrations of astaxanthin. The addition of astaxanthin did not affect the moisture, ash, carbohydrate and protein content of cookies. Although, there was no significant difference in moisture content, however, the trend showed that the addition of astaxanthin potentially increased the moisture value. This result is in agreement with the study conducted by35 whose using wholemale barley in their cookies with the presence of astaxanthin. It was explained that the increasing of moisture content in cookies could be influenced by the properties of the water holding capacity (WHC) of the flour used, such as the composition of starch, protein and fiber.38 The presence of astaxanthin in the formulation significantly decreased the fiber content, whereas the fat content of the cookies increased significantly (p≤0.05). The increase in fat might be due to the nature of astaxanthin that is composed of 5% of free fatty acid, 70% of monoesters and 25% diesters.39 Other compositions including ash, protein and carbohydrate showed no significant difference, meaning that the presence of astaxanthin in the cookies did not cause any changes in the component.
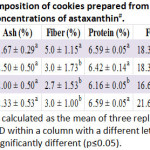 |
Table 5: Chemical composition of cookies prepared from the different concentrations of astaxanthin#. |
Lipid Oxidation of Cookies
The potential of astaxanthin in controlling lipid peroxidation was analyzed by treating the cookies with different astaxanthin concentrations, storage temperature and storage time (Table 6). The peroxide value (PV) was analyzed to determine the presence of peroxides in lipid-containing food at the beginning of lipid oxidation. PV is known to be influenced by storage time and temperature and also light exposure. All the measurements in different treatments showed that the range of the PV was lower than 10 mEq/kg, which indicated that the samples were in an acceptable range of the value.49 Starting on Day 1 of the storage, all the cookies indicated equal PV measurement (P ≥ 0.05). However, prolonged storage at the same temperature for the same sample (either room temperature, 40oC or 50oC) caused a significant reduction in PV among samples (P ≤ 0.05). The study clearly showed that increasing astaxanthin concentration would decrease the PV. The 20% astaxanthin samples revealed the lowest value after 21 days at all storage temperatures (Table 6). PV data shows a significant difference in the interaction of different storage time and storage temperature (P ≤ 0.05) at different astaxanthin concentrations.
The secondary oxidation of cookies was measured using the p-Anisidin value (p-AV) which can be used to measure products generated during the decomposition of hydroperoxides that usually correlates with flavor.26 Table 6 shows the p-AV at different storage time and temperatures.
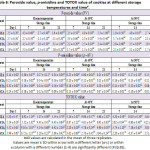 |
Table 6: Peroxide value, p-anisidine and TOTOX value of cookies at different storage temperatures and time#. |
All cookies indicated the good quality of lipid composition due to the low value of p-AV which was less than 10.41 Prolonged storage time and increased temperature for the same concentration showed positive indication on secondary peroxidation due to the decrease in the p-AV. The 20% astaxanthin sample also recorded the lowest p-AV after 21 days at different storage temperatures. Positive interaction between different storage time and temperature at (P ≤ 0.05) was measured at different concentrations of astaxanthin. The presence of conjugated double bonds and hydroxyl groups in astaxanthin may decrease the oxidation rate. The previous study mentioned that adding astaxanthin could effectively reduce lipid peroxidation in flaxseed oil when heated at 40 – 60oC.46 In fact, the use of natural antioxidants has been proved as an effective way to improve antioxidant activity and minimize lipid oxidation in cookies.42,43
The TOTOX value is useful to indicate the level of oxidative stability in most food products. As expected, for most different storage conditions, cookies with 20% astaxanthin recorded the lowest value at day 21. A significant reduction of TOTOX value (P ≤ 0.05) was measured for the cookies stored at room temperature between different concentrations and storage periods. Statistically, there was also significant interaction at (P ≤ 0.05) between storage time and temperature. Generally, the TOTOX value was quite low in most of the experimental cookies stored at various storage times and temperatures. As a result, astaxanthin could stabilize lipid oxidation in cookies. A possible explanation for these results may be the presence of saturated fatty acid in the astaxanthin that more resistance toward oxidation.41 This result confirms that 44 It is believed that the presence of hydroxyl and carbonyl functional groups in astaxanthin contributes to excellent antioxidants activity.
Fatty Acid Composition
Table 7 shows the proportion of saturated fatty acid (SFA), monounsaturated fatty acid (MUFA) and polyunsaturated fatty acid (PUFA) in cookies. The distributional proportions of these fatty acids in the samples were not the overall fatty acids.
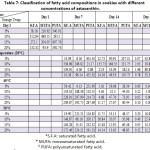 |
Table 7: Classification of fatty acid compositions in cookies with different concentrations of astaxanthin. |
All samples were gone through the same conditions and processes along the experiment period. The results showed that the cookies contained all types of fatty acid including SFA, MUFA and PUFA. Data showed a substantial decline in SFA in all the samples at different storage temperatures. When cookies of 0% and 10% astaxanthin added were stored at 40°C and 50°C, certain differences in SFA percentage were found. This was likely due to the protective impact of mixed wall content covering astaxanthin containing ALA and EPA against oxidation.48 The astaxanthin concentrations and storage temperature was found not to influence the MUFA percentage significantly (P<0.05). Only the storage time found to significant (p<0.01) effect on MUFA. Increasing the storage temperature up to 40°C have negatively affected on MUFA composition even in a high concentration of astaxanthin.
As can be seen from Table 7, there was no significant effect of astaxanthin concentration and temperature on PUFA (p>0.05), while only storage time was significant (p<0.01). The most surprising aspect of the data is that the samples contained 15% and 20% astaxanthin and stored at high temperatures identified to contain a high composition of fatty acid, which correlated with low PV. This study showed cookies enriched with astaxanthin mainly composed of palmitic acid (C16:0), linoleic (C18:2n6c), oleic (C18:1n9c), DHA (C22:6n3) and EPA (C20:5n3) acids. This might be due to SFA normally contains just around 28% of the total amount of fatty acid, while PUFA recorded around 48% and MUFA around 24%.45
Conclusions
The research work demonstrated that natural astaxanthin which has coloring properties exhibits free radical scavenging and high antioxidant activity. This study clarified the potential use of natural astaxanthin to improve cookies functional and biological activity. Combining different astaxanthin concentrations with flour could significantly increase the physical properties of cookies including color and texture properties, as well as significantly increased the cookies stability stored at various times and temperatures. This study can contribute to the consumption of natural bioactive compounds in food that promote to potential health benefits
Funding Sources
The authors would like to acknowledge the University Malaysia Terengganu, Malaysia for providing financial support (PGRG Research Grant No: 55193/7) for this project.
Conflict of Interest
No potential conflict of interest was reported by the authors.
Acknowledgments
The authors would like to thanks all the staff of the Food Chemistry Lab from the Faculty of Fisheries and Food Science who gave support and valuable input in the success of this research.
References
- Aminuddin F., Ismail K., Radzun, K. A. Comparison Growth Performance for Pluvialis via an Automated Microalgal Nutrient Screening System against Flask Scale Cultivation. J Appl Environ Biol Sci. 2017; 7(1): 63-69.
- Han, D., Li Y., Hu Q. Astaxanthin in microalgae: Pathways, functions and biotechnological implications. Algae. 2013; 28(2): 131-147.
CrossRef - Borowitzka M. A. High-value products from microalgae—their development and commercialisation. Appl. Phycol. 2013; 25: 743–756 (2013).
CrossRef - Koller M., Muhr A., Braunegg, G. Microalgae as versatile cellular factories for valued products. Algae Res. 2014; 6: 52-63.
CrossRef - Pérez-López P., González-García S., Jeffryes C., Agathos S. N., McHugh E., Walsh D. Life-cycle assessment of the production of the red antioxidant carotenoid astaxanthin by microalgae: from lab to pilot scale. Clean. Prod. 2014; 64: 332–344.
CrossRef - Cyanotech (2018). BioAstin – Natural Astaxanthin. Available online at: http://www.cyanotech.com/bioastin.html ( Retrieved at 31 January, 2018).
- Capelli B., Bagchi D., Cysewski, G. R. Synthetic astaxanthin is significantly inferior to algal-based astaxanthin as an antioxidant and may not be suitable as a human nutraceutical supplement. Nutrafoods. 2013; 12(4): 145–152.
CrossRef - Fang Q., Guo S., Zhou H., Han R., Wu P., Han, C. Astaxanthin protects against early burn-wound progression in rats by attenuating oxidative stress-induced inflammation and mitochondria-related apoptosis. Rep. 2017; 7(9): 1–13.
CrossRef - Yamashita E. Astaxanthin as a Medical Food. food health dis. 2013; 3(7): 254–258.
CrossRef - Xie , Wang X., Proud, C. G. (2016). mTOR inhibitors in cancer therapy. F1000Research. 2016; 5: 2078.
CrossRef - Dose J., Matsugo S., Yokokawa H., Koshida Y., Okazaki S., Seidel U., Eggersdorfer M., Rimbach G., Esatbeyoglu, T. (2016). Free radical scavenging and cellular antioxidant properties of astaxanthin. J. Mol. Sci. 2016; 17(1): 1–14.
CrossRef - Alves C., Pinteus S., Simoes T., Horta A., Silva J., Tecelao C., Pedrosa R. Bifurcaria bifurcata: A key macro-alga as a source of bioactive compounds and functional ingredients. Int J Food Sci Tech. 2016; 51: 1638–1646.
CrossRef - Kadam S. U., Tiwari B. K., O’Donnell C. P. Extraction, structure and biofunctional activities of laminarin from brown algae. Int J Food Sci Tech. 2015; 50: 24-31.
CrossRef - Li J., Solval K. M., Alfaro L., Zhang J., Chotiko , Delgado J. L. B., Chouljenko A., Bankston D., Bankston P. J., Sathivel, S. Effect of blueberry extract from blueberry pomace on the microencapsulated fish oil. J Food Process Pres. 2015; 39(2): 199-206.
CrossRef - Lee , Koo N., Min D. B. Reactive oxygen species, aging, and antioxidative nutraceuticals. Compr. Rev. Food Sci. Food Saf. 2004; 3(1): 21-33.
CrossRef - Keller J., Camaré C., Bernis C., Astello-García M., de la Rosa A. P. B., Rossignol M., Diaz M. D. S. S., Salvayre R., Negre-Salvayre A., Guéraud F. Antiatherogenic and antitumoral properties of Opuntia cladodes: inhibition of low density lipoprotein oxidation by vascular cells and protection against the cytotoxicity of lipid oxidation product 4-hydroxynonenal in a colorectal cancer cellular model. Arch Physiol Biochem. 2015; 71(3): 557-587.
CrossRef - Tirosh O., Shpaizer A., Kanner Lipid peroxidation in a stomach medium is affected by dietary oils (olive/fish) and antioxidants: the Mediterranean versus western diet. J. Agric. Food Chem. 2015; 63(31): 7016-7023.
CrossRef - Ting Z., Xiaofei , Yun J., Cuijuan S., Kan G. Stability application and research of astaxanthin integrated into food. IOP Conference Series: Mater. Sci. Eng. 2018; 394: 1-5.
CrossRef - Choubert G., Cravedi J. P., Laurentie Effect of alternate distribution of astaxanthin on rainbow trout (Oncorhynchus mykiss) muscle pigmentation. Aquac. 2009; 286(1-2): 100-104.
CrossRef - Ni L., Shi W. Composition and Free Radical Scavenging Activity of Kernel Oil from Torreya grandis , Carya Cathayensis and Myrica Rubra. Iran J Pharm Res. 2013; 13(11): 221-226.
- Zhao X., Zhang X., Fu L., Zhu , Zhang, B. Effect of extraction and drying methods on antioxidant activity of astaxanthin from Haematococcus pluvialis. Food Bioprod Process. 2016;99(13):197–203.
CrossRef - Thaipong K., Boonprakob U., Crosby K., Cisneros-Zevallos L., Hawkins Byrne D. Comparison of ABTS, DPPH, FRAP, and ORAC assays for estimating antioxidant activity from guava fruit extracts. J Food Compost Anal. 2006 ; 19(6–7): 669–675.
CrossRef - Official Methods of Analysis of AOAC International, 17th ed.; AOAC International: Gaithersburg, MD, 2005.
- Tadesse N., Reta R., Beyero N. Level of saturation and anti-oxidant value of heat and spice treated animal butter. Food and Public Health. 2017; 7(4): 81-90.
- Chen X., Chen R., Guo , Li C. Li P. The preparation and stability og the inclusion complex of astaxanthin with β-cyclodextrin. Food Chem. 2007; 101: 1580 – 1584.
CrossRef - Ling L. M., Md S. Y., Matanjun P., Abu Bakar M. F. Antioxidant activity , Total Phenolic and Flavonoid Contents of Selected Commercial Seaweeds of Sabah , Malaysia. Int. J. Pharm. Phytopharmacological Res (EIJPPR). 2013; 3(3): 234–238.
- Zuluaga M., Barzegari A., Letourneur D., Gueguen V., Pavon-Djavid G. Oxidative Stress Regulation on Endothelial Cells by Hydrophilic Astaxanthin Complex: Chemical, Biological, and Molecular Antioxidant Activity Evaluation. Med. Cell. Longev. 2017; 2017: 1-15.
CrossRef - Guerin M.; Huntley M.E. Olaizola M. Haematococcus astaxanthin: Applications for human health and nutrition. Trends Biotechnol. 2003; 21: 210–216.
CrossRef - Sarada R., Vidhyavathi , Usha D., Ravishankar G. A. An efficient method for extraction of astaxanthin from green alga Haematococcus pluvialis. J. Agric. Food Chem. 2006; 54(20): 7585–7588.
CrossRef - Khoo K. S., Lee S. Y., Ooi C. W., Fu , Miao X., Ling T. C. Show P. L. Recent advances in biorefinery of astaxanthin from Haematococcus pluvialis. Bioresour. Technol. 2019; 288 (2019): 121606.
CrossRef - Huang D., Ou B. Prior R. L. The chemistry behind Antioxidant Capacity Assays. Agric. Food Chem. 2005; 53: 1841-1856.
CrossRef - Ooi Y., Kitamura A., Yamashita E. Baked food produced from astaxanthin containing dough. Patent application . 2018; NO.15/836,375.
- Koomyart I., Nagamizu H., Khuwijitjaru P., Kobayashi T., Shiga H., Yoshii H. Adachi Astaxanthin stability and color change of krill during subcritical water treatment. Int J Food Sci Tech. 2017; 54(10): 3065-3072.
CrossRef - Laguna L., Varela P., Salvador N. A., Sanz T., Fiszman S. M. Balancing texture and other sensory features in reduced fat short-dough biscuits. J. Texture Stud. 2011; 43(3): 235-245.
CrossRef - Hossain A. K. M. M., Brennan M. A., Mason S. L., Guo X., Zeng A., Brennan C. S. The Effect of Astaxanthin-Rich Microalgae “Haematococcus pluvialis” and Wholemeal Flours Incorporation in Improving the Physical and Functional Properties of Cookies. Foods. 2017; 6(8): 57.
CrossRef - Pasqualone A., Bianco A. M., Paradiso V. M., Summo C., Gambacorta G. Caponio, F. Physico-chemical, sensory and volatile profiles of biscuits enriched with grape marc extract. Food Res Int. 2014; 65: 385-393.
CrossRef - Inglett E., Chen D., Liu, S. X. Physical properties of gluten-free sugar cookies made from amaranth-oat composites. LWT – Food Sci Technol. 2015; 63(1): 1-7.
CrossRef - Mais A., Brennan, C. S. Characterization of flour, starch and fibre obtained from sweet potato (kumara) tubers, and their utilization in biscuit production. Int J Food Sci Tech. 2008; 43: 373-379.
CrossRef - Sung W. C., Lin, Y. C. Qualities of Cookie Made With Beeswax-Coconut Oil Organogels as Replacement for Shortening. J Food Nutr Res. 2017; 5(9): 697–707.
CrossRef - Ling A. L. M., Md S. Y., Matanjun P., Abu Bakar M. F. Antioxidant activity , Total Phenolic and Flavonoid Contents of Selected Commercial Seaweeds of Sabah, Malaysia. j. pharm. phytopharm. Res. 2013; 3(3): 234–238.
- Pragasam A., Naik V. M., Tallur P. N. Assessment of Physico-Chemical Characteristic Deterioration of Lipids by FTIR Spectra for Successively Used Soy Bean and Sunflower Oils in Frying Spice Food Stuffs. Appl. Chem. 2015; 8(3): 47–51.
- Caleja C., Barros L., Antonio A. L., Oliveira M. B. P. P. Ferreira, I. C. F. R. A comparative study between natural and synthetic antioxidants: Evaluation of their performance after incorporation into biscuits. Food Chem. 2016; 216: 342 – 346.
CrossRef - Bialek M., Rutkowska J., Bialek A. Adamska, A. Oxidative stability of lipid fraction of cookies enriched with chokeberry polyhenols extract. Pol J FoodNutr 2016; 66(2): 77-84.
CrossRef - Liu X. Osawa T. Cis astaxanthin and especially 9-cis astaxanthin exhibits a higher antioxidant activity in vitro compared to the all-trans Biochem. Biophys. Res. Commun. 2007; 357(1): 187-193.
CrossRef - Alves C., Pinteus S., Simoes T., Horta A., Silva J., Tecelao C., Pedrosa R. Bifurcaria bifurcata: A key macro-alga as a source of bioactive compounds and functional ingredients. Int J Food Sci Tech. 2016; 51: 1638–1646.
CrossRef - Pu J., Bechtel P. J. Sathivel S. Extraction of shrimp astaxanthin with flaxseed oil: Effect on lipid oxidation and astaxanthin degradation rates. Eng. 2010; 107: 364-371.
CrossRef - Laguna L., Varela P., Salvador A., Sanz T., & Fiszman S. M. Balancing texture and other sensory features in reduced fat short-dough biscuits. Texture Stud. 2012; 43(3): 235–245.
CrossRef - Takeungwongtrakul S., Benjakul S. Biscuits fortified with micro-encapsulated shrimp oil: characteristics and storage stability. Int J Food Sci Tech. 2017; 54(5): 1126-1136.
CrossRef - Kilcast D., Subramaniam P. (Eds.). (2011). Food and beverage stability and shelf life. Elsevier.
CrossRef

This work is licensed under a Creative Commons Attribution 4.0 International License.