
Introduction
The prevalence of obesity along with its complications, is increasing rapidly, particularly in developing countries such as Indonesia. Among obese people, adipocyte accumulation is considered a critical event because these fat cells function as active endocrine organs influencing many crucial functions of various systems of the body. As adipocytes enlarge, their metabolic roles change and the expression of proinflammatory cytokines increases.1 Therefore, obesity has been proposed as a chronic low-grade inflammatory disease.1-3 Severely obese people are at a high risk of obesity-related comorbidities, such as CVD, diabetes, and non-alcoholic fatty liver disease.4,5 In addition to BMI, other parameters are commonly used for obesity determination, such as For instance, lipid accumulation product (LAP)—an adiposity index for adults correlated with abdominal fat storage and adiposity dysfunction—is calculated using waist circumference (WC) and triglyceride (TG) level.6-8 Along with waist-to-height ratio (WHtR) and the conicity index (C-Index) (which is calculated using WC, body weight (BW), and height (BH)), LAP is strongly correlated with visceral fat accumulation.9 A combination of environmental, lifestyle, and genetic factors determines the individual risk for comorbidity development and progression; in addition, nutrition, drug intake, metabolic disarrangement, toxin exposure, and infection can be modifying environmental factors. Therefore, careful nutritional modification may aid in managing the aforementioned conditions caused by over accumulation of body fat, particularly visceral fat. Elizondo et al10 reported that the content of n-3 PUFA and long chain (LC)-PUFA of the -erythrocyte phospholipids was 30% and 35% lower in obese people than in nonobese people, respectively. Furthermore, the content of n-3 PUFA [i.e., α-linolenic acid (ALA)] and LC-PUFA (i.e.EPA and DHA) was 56% and 59% lower in obese people than in nonobese people, respectively; in other words, the levels of n-6 PUFA [i.e., linoleic acid (LA)] and LC-PUFA (i.e. arachidonic acid) were relatively higher in obese people than in their nonobese counterparts. The n-6:n-3 LC-PUFA ratio was consequently 144% higher in obese people than in nonobese controls. Therefore, food intake with a high n-6:n-3 ratio may increase the risk of various metabolic and degenerative diseases, because n-6 PUFA is associated with proinflammatory markers.11 Modifying nutrition by increasing the dietary content of n-3 PUFA is an approach that may aid in reducing the risk of metabolic diseases; the dietary inclusion of canola oil (n-6:n-3 PUFA ratio, 2:1) can be suitable for this intervention.12 Because canola oil is high in n-3 PUFA (ALA) content, it can potentially modulate the inflammatory response and reduce the risk of obesity-associated metabolic syndrome.11 In this study, we elucidated the effect of canola oil supplementation on body fat accumulation in young obese women in Bali, Indonesia.
Material and Methods
Research Design, Participants, and Intervention
A double-blind, randomised-controlled trial was conducted during May–September 2013.13.A total of 80 young women (aged 18–25 years) who felt obese and showed their interests to participate in the study were screened. Out of these 80 women, 74 women met the following entry criteria: BMI ≥ 25kg/m2, unmarried (single) status, ready as a subject and comply fully with the study protocol and procedure, and living in Denpasar for several years and at least next one year.
Women who were on body weight control program using pharmacologic or herbal regimen, on routineusing supplementation of antioxidants, vitamins, or minerals, on treatment of chronic diseases using steroid or non steroid anti inflammation, and alcoholic (daily consumption of more than 20 g alcohol) were excluded from the study.
These 74 women were equally allocated to either the Intervention or Control group (n= 37 in each group). Informed consent was obtained before commencing the study, and the participants’ anonymity was maintained throughout. The study protocol was approved by the Research Ethics Committee of Udayana University-/Sanglah Hospital (Ethical Clearance No. 787/UN.14.2/Litbang /2012, 17 September 2012). The study was registered as Clinical trial ID ACTRN12615000757516.
The Intervention group received daily supplementation of 30 mL of emulsion containing either 10 g of canola oil (700 mg SFA, 6100 mg MUFA, 2100 mg LA, and 1100 mg ALA, and the Control group received daily supplementation of 2 g palm oil (66 mg SFA, 1000 mg MUFA, 240 mg LA, and 100 mg ALA; control group) for 12 weeks (June–September 2013). Participants in Intervention and Control groups were also recommended to restrict their daily energy intake to less than 1500 Kcal/day. To maintain the participants’ compliance, weekly meetings with clinical investigators were done every Sunday, wherein subjects performed 1-h exercise with an aerobic instructor. During this meeting, the participants were provided 1 week’s supply (250 mL) of emulsion. Any complaints or adverse effects potentially caused by the supplementation were also monitored and reported. The remaining emulsion in a used bottle container was measured weekly in order to ensure that the emulsion was consumed as instructed. Eight participants (10.8%) dropped out during the course of the study (4 from each group), leaving a total of 66 participants (33 in each group) who completed the study and included in the final analyses. Summary of recruitment and participation during the trial is summarised in Figure 1.
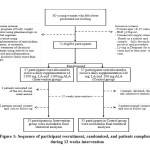 |
Figure 1: Sequence of participant recruitment, randomised, and patients complience during 12 weeks intervention.Click here to View Figure |
Data Collection
Assessment of Food Intake
Dietary intake was assessed twice at the baseline and the endline, by two trained dietitians, using Food Frequency Questionnaire (FFQ) and Semi-Quantitative FFQ (SQ-FFQ) methods. Food patterns were calculated from FFQ as number of foods frequency consumed per day. Conversion of food to nutrient intakes per day from SQ-FFQ data was done using Nutrisurvey software developed by Erhardt in 2007 and distributed by SEAMEO RECFON, Universitas Indonesia14 resulting in the quantity of macronutrients (energy, protein, fat, carbohydrates, fiber, and cholesterol).
Anthropometric and Biochemical Assessments
Anthropometric and biochemical variables were assessed three times: on the first day of week-1 (baseline), on the last day of week-6 (midline), and on the last day of week-12 (endline).
All anthropometric variables were measured twice, and for the final analyses mean values were used. Body weight (BW) was assessed using a digital scale (Omron HBF-362 model, Kyoto, Japan), with a precision of 0.1 kg. Body height (BH) was assessed using a stature meter (General Care No 26SM), with a precision of 0.1 cm. Waist circumference (WC) was measured using a flexible non-elastic tape, exactly at the middle level of the abdomen, with a precision of 0.1 cm.
Triglyceride (TG) concentrations were measured from blood serum using a colorimetric method (Cobas 6000; Roche Diagnostics, Mannheim, Germany), with a precision of 1 mg/dL.
Calculation of Body Fatness
BMI was calculated as BW (kg)/[BH (m)]2. WHtR was calculated as WC (cm)/BH (cm), and C-Index was calculated as WC (cm)/{0.109 × √[BW (kg)/BH (cm)]}.9 Finally, LAP for women6-8 was calculated as [WC (cm) − 58] × TG (mmol).
Statistical Analyses
Statistical analyses were performed using Stata 12.1 (Stata Corp, College Station, TX, USA). The normal distribution of continuous data is presented as mean ± standard error of the mean (SE). Comparison within groups were tested using general linear model, and changes between groups were compared using an independent t test. Statistical significance was set at p<0.05.
Results
All participants, in the intervention and the control-groups were comparable in baseline characteristics, namely; age, occupations, ethnicities, selected nutrients intake (except fiber), anthropomeric and body fat index values. However, there were extreme values for certain nutrients intake, such as for cholesterol and fiber. Cholesterol intake of the both group were relatively high (more than 250 mg), especially in the Intervention group (319 mg), although it was not different between group. On the contrary, both groups had a very low fiber consumption when compared with Indonesian RDA (2014) for that of age and gender group (32 g). The Intervention group (8.1 g) had a particularly lower fiber intake than those the Control group (11.9 g) (p=0.024) (Table 1). Most of the energy intake came from tradional Balinese food such as, rice, chicken, tempeh, and tofu, with additional energy from street and fast food (Table 2).
Table 1: Baseline characteristics of participants.
| Parameters | Group | p | |
| Intervention | Control | ||
| Age (years) (mean±SE) | 20.9±1.8 | 20.6±1.5 | 0.413 |
| Occupation (f(%)) | |||
| Student | 30(90.9) | 30 (90.9) | 1.000 |
| Officer staff | 2 (6.1) | 2 (6.1) | |
| Unemployment | 1(3.0) | 1 (3.0) | |
| Ethnicity (f(%)) | |||
| Balinese | 30 (90.9) | 30 (90.9) | 0.613 |
| Javanese | 2 (6.0) | – | |
| Chinese | – | 1 (3.0) | |
| Indian | 1 (3.0) | 2 (6.0) | |
| Selective Nutrients Intake (mean±SE) | |||
| Energy (Kcal) | 1803±107 | 1812±118 | 0.956 |
| Fat (g) | 78.6±6.67 | 66.0±7.08 | 0.679 |
| PUFA (g) | 18.9±2.50 | 16.1±2.50 | 0.832 |
| Cholesterol (mg) | 319±25.9 | 265±25.3 | 0.109 |
| Fiber (g) | 8.1±0.68 | 11.9±1.60 | 0.024 |
| Anthropometric (mean±SE) | |||
| Body weight (kg) | 76.5±2.71 | 76.3±2.14 | 0.929 |
| BMI (kg/m2) | 30.3±0.97 | 30.5±0.75 | 0.766 |
| Waist circumference (cm) | 92.3±2.15 | 92.7±2.15 | 0.899 |
Presented in mean±SE, analysed using independent student t-test.
Presented in f (%), tested using chi-square. PUFA= poly unsaturated fatty acid, BMI= body mass index. All characteristics variables between both were comparable, except it was very low intake of fiber in both group, especially in intervention group.
Table 2: Food consumption frequency pattern (time/day) of total participants. (n=66)
| Food Sources | f(%) | Mean±SE |
| Carbohydrates | ||
| ₋Rice | 66(100) | 2.23±0.12 |
| ₋Noodle | 64(97.0) | 0.19±0.03 |
| ₋Bread | 63(95.5) | 0.47±0.13 |
| ₋Table sugar | 45(68.2) | 1.39±0.36 |
| ₋Snack (biscuit, commercial snack) | 40(60.6) | 0.81±0.14 |
| ₋Soft drink | 43(65.2) | 0.19±0.06 |
| Proteins | ||
| ₋Beef | 35(53.0) | 0.20±0.05 |
| ₋Pork | 45(68.2) | 0.17±0.04 |
| ₋Lamb | 20(30.3) | 0.26±0.09 |
| ₋Chicken | 65(98.5) | 1.13±0.17 |
| ₋Fish (salt water) | 58(87.9) | 0.59±0.17 |
| ₋Fish (fresh water) | 40(60.6) | 0.20±0.03 |
| ₋Eggs | 63(95.5) | 0.48±0.05 |
| ₋Full cream milk | 30(45.5) | 0.21±0.06 |
| ₋Low fat milk | 28(42.4) | 1.14±0.61 |
| ₋Tofu/tempe (soybean) | 64(97.0) | 1.62±0.32 |
| Fat and cooking oil | ||
| ₋Cheese | 40(60.6) | 0.24±0.07 |
| ₋Butter/margarine | 28(42.4) | 0.16±0.02 |
| ₋Coconut oil | 10(15.2) | 0.26±0.13 |
| ₋Palm oil | 53(80.3) | 1.98±0.24 |
| ₋Olive oil | 7(10.6) | 1.35±0.86 |
| Fast food and street food | ||
| ₋Fried chicken | 53(80.3) | 0.37±0.28 |
| ₋Pizza with cheese | 45(68.2) | 0.04±0.01 |
| ₋Meat balls | 55(83.3) | 0.17±0.03 |
| ₋Fried food | 59(89.4) | 0.40±0.09 |
| Fruits and vegetables | ||
| ₋Apple | 51(77.3) | 0.74±0.12 |
| ₋Papaya | 46(69.7) | 0.71±0.18 |
| ₋Orange | 38(57.7) | 0.50±0.13 |
| ₋Water melon | 43(65.1) | 0.50±0.15 |
| ₋Melon | 41(62.1) | 0.48±0.14 |
| ₋Banana | 20(30.3) | 0.88±0.20 |
| ₋Water spinach | 50(75.8) | 0.70±0.11 |
| ₋Spinach | 42(63.6) | 0.40±0.16 |
Overall, the energy intake of both the intervention and control groups significantly decreased from the baseline measurements (p<0.001 and p=0.001, respectively; Table 3). The decrease energy intake was most probably due to the reduction of rice consumption.
Among the unadjusted or adjusted by the reduced energy intake, after intervention compared with the baseline. Specifically, BMI, WC, WHtR and C-Index significantly decreased at the midline (unadjusted: p=0.007, p<0.001, p<0.001, and p=0.001; adjusted: p=0.08, p<0.001, p<0.001 and p=0.001, respectively) and end line (the same p value among unadjusted and adjusted: p=0.005, p<0.0001, p<0.001, and p<0.001, respectively). Notably, in the control group, only the parameters calculated considering WC decreased at the end line, compared with that at the baseline weather that with unadjusted or adjusted by reduced energy intake (p=0.007 or p=0.06; and 0.006 or 0.005 for WC and WHtR, respectively); however, the C-Index decreased at midline as well as end line (p=0.019 and 0.001, respectively), and the reduction in BMI was non-significant (Table 3). We next observed that TG consentrartion in the intervention-group participants significantly decreased at the end line, compared with that at the baseline with unadjusted and adjusted by reduced energy intake (p=0.021, and p=0.022); by contrast, TG concentration demonstrated no significant changes in the control group (Table 3). Furthermore, LAP also decreased significantly in the intervention group at the midline (p=0.033) and end line (p<0.001), compared with that at the baseline; by contrast, the control group demonstrated no significant change in LAP (Table 3).
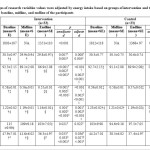 |
Table 3: Changes of research variables values were adjusted by energy intake based on groups of intervention and time of assessments at baseline. |
p within-group, comparison of baseline, midline and endline mean tested by general linear model, adjusted by the reduced energy intake from base-line to end-line.
Baseline week-0, midline week-6, endline week-12.
†; baseline vs midline,§;midline vs endline,‡; baseline vs endline
BMI; body mass index, WC;waist circumference, WHtR; waist to height ratio, CIndex; conicity index, TG; triglyceride, LAP; lipid accumulation product.
Between group analyses, the declined of energy intake after 12 weeks supplementation did not differ among two groups (p=0.961). BMI, WC and WHtR declined statisitically different from the baseline to the endline in the Intervention group compared to the Control group (p=0.038, p=0.047, and p=0.052, respectively). No differences in changes of C-index, TG concentrations, and LAP were observed between Intervention and Control groups (Table 4).
Table 4: Comparison of changes of research variables values between intervention vs control groups during the intervention.
| Parameters | Time Interval(Week) | Groups – value changes | p | |
| Intervention(mean±SE) | Control(mean±SE) | |||
| Energy intake | 0-12 | -451±115 | -443±116 | 0.961 |
| BMI | 0-6 | -0.40±0.14 | 0.21±0.29 | 0.100 |
| 6-12 | -0.11±0.09 | 0.03±0.07 | 0.275 | |
| 0-12 | -0.50±0.17 | 0.24±0.29 | 0.038* | |
| WC | 0-6 | -3.21±0.78 | -1.58±0.81 | 0.153 |
| 6-12 | -2.20±0.67 | -1.16±0.70 | 0.283 | |
| 0-12 | -5.41±0.92 | -2.74±0.95 | 0.047* | |
| WHtR | 0-6 | -0.02±0.00 | -0.01±0.00 | 0.161 |
| 6-12 | -0.01±0.00 | -0.01±0.00 | 0.295 | |
| 0-12 | -0.03±0.01 | -0.02±0.01 | 0.052* | |
| C Index | 0-6 | -0.04±0.01 | -0.03±0.01 | 0.639 |
| 6-12 | -0.03±0.01 | -0.02±0.01 | 0.329 | |
| 0-12 | -0.06±0.01 | -0.04±0.01 | 0.329 | |
| TG | 0-6 | -6.27±7.50 | -8.24±6.01 | 0.838 |
| 6-12 | -6.06±6.45 | 2.82±5.11 | 0.285 | |
| 0-12 | -12.33±5.09 | -5.42±8.11 | 0.473 | |
| LAP | 0-6 | -6.32±2.84 | -5.66±2.29 | 0.871 |
| 6-12 | -5.28±2.36 | -0.99±2.40 | 0.209 | |
| 0-12 | -11.6±2.70 | -6.65±4.52 | 0.351 | |
BMI: body mass index; WC: waist circumference; WHtR: waist to height ratio; C Index; conicity index; TG: triglyceride; LAP: lipid accumulation product.
p between-group was tested by independent t-test.
Discussion
In present study, we try to identify and elaborate the ways to control body fatness and prevent it’s comorbidities, through optimized the role of nutrition intervention, such as energy restriction and supplementation high dose of low n-6:n-3 PUFA ratio, especially in young obese women.
The energy restriction seemly has the main role to control body fatness. In both, the Intervention and the Control group were significantly decreased energy intake, in the endline compared to the baseline. The reducing energy intake of the Control group, was also followed by decreased of the sensitive body fatness, such as WC, WHtR and C-Index. The reduction of body fat could be optimized by supplementation high dose of low n-6:n-3 PUFA ratio. We observed the significant reduction of all body fat indexes, namely BMI, WC, WHtR, C-Index, TG concentration, and LAP within the Intervention group. Furthermore, between group analyses, some body fatness such as BMI, WC, and WHtR have been reducing more in the Intervention than the Control group.
The most prominent improvement was noted in BMI and WC after 12 weeks of the intervention. During the 12 weeks of intervention, LAP decreased as well. We propose that the supplementation for longer than 12 weeks will have more substantial positive effects. However, because we lost 10.8% of the participants to follow-up in this short-term study, we suggest that participants’ compliance should be ensured for studies exploring the effects of long-term intervention.
Most of studies, both in animals and human reported the positive effects of n-3 PUFA supplementation in weight management. A systematic review15 reported, four of five studies in adults, have concluded the changes in body weight by supplementation with n-3 PUFA. The evidence corroborates the role of n-3 PUFA, in controlling adiposity in obese people. This n-3 PUFA can control pathways involved in lipid metabolism by regulating biomoleculary the gene transcription factors paroxysmal proliferator activated receptor (PPAR)-α, PPARγ, sterol regulatory element binding protein-1 (SREBP-1), and carbohydrate-responsive element-binding protein (ChREBP).16,17 Two mechanisms involving n-3 PUFAs, particularly EPA and DHA, can control adiposity. The first involves endogenous lipid synthesis inhibition and oxidation stimulation; both EPA and DHA reduce endogenous lipid production by inhibiting the expression and processing of SREBP-1 involved in the stimulation of lipogenic gene transcription.16-19 In the second mechanism, n-3 PUFAs also function as potent PPARα and PPARγ activators and inhibitors; both proteins upregulate the expression of several genes involved in stimulation of fatty acid oxidation.16,17,20,21
Roriz et al9 reported that WHtR, C-Index, LAP, and visceral adiposity index (VAI; calculated using WC, BMI, and TG and HDL-cholesterol levels) were correlated with visceral adipose tissue area and assessed through computerised tomography; this is the gold standard for assessing men and women (aged 20–59 years), particularly their WHtRs and C-Index scores. The researchers concluded that for predicting visceral fat accumulation in adults and elderly people of both genders, the simple anthropometric measurements of WHtR and C-Index are more accurate regarding sensitivity and specificity than are those of LAP and VAI, both of which are anthropometric and biochemical measurements. Compared with those of the anthropometric parameters, the LAP and VAI are potentially attributable to the weaker correlations of biochemical parameters used for calculating them (e.g., TG and HDL-cholesterol levels) with visceral fat.22 Other studies have reported that high WHtR and C-Index values are associated with an increased risk of CHD, diabetes, hypertension, and dyslipidemia.22,23 A systematic review reported that in 91% of women, WHtR was more suitable for predicting CVDs than was WC and BMI.24 In addition, visceral fat, commonly responsible for abdominal obesity, has been reported to be the origin of metabolic and degenerative diseases. Thus, the simple parameters WHtR and C-Index are good predictors of abdominal obesity along with visceral fat accumulation.
In present study, supplementation this oil was strongly correlated with reduction in lipid accumulation, indicated by decreased BMI, WC, WHtR, and TG levels. Because adipose cells are considered endocrine organs, which commonly release proinflammatory mediators, this intervention potentially reduces inflammatory and oxidative stress. By limiting both the hypertrophy and hyperplasia of adipocytes, marine n-3 PUFA has an antiadipogenic effect during obesity development.25 Another study26 reported that decreasing the n-6:n-3 PUFA intake ratio to 3:1 reduces plasma TG levels in older people (aged 45–70 years).
Obesity and lipid accumulation are notable risk factors for metabolic and degenerative diseases; therefore, weight loss and body fat reduction (particularly visceral fat) evidently decrease the risk of these diseases. Because most diseases complicated by obesity are actually preventable, developing a simple and reliable strategy for early detection in participants with risks is essential. We suggest performing simple and applicable screenings using C-Index, WHtR, or LAP algorithms for early detection of increasing body fat composition and distribution. However, any confirmed participants at risk should promptly undergo follow-up and treatment with appropriate management, through modified nutrient intake and exercise. Appropriate detection and prevention of a complicated disease at earlier stages is more effective and efficient than is its treatment at advanced stages. Furthermore, most metabolic and degenerative diseases lack definitive pharmacologic regimens, and those currently available in the market are expensive. Hence, developing a simple and applicable approach comprising restricted energy intake through a specific diet high in n-3 PUFA and increased physical activity, as the main appropriate prevention and curative strategy, particularly in obese participants, is warranted.
Adiposa tissue not only roled as the energy deposit, but also an endocrine organs that release pro-inflammatory mediators, that increase oxidative stress of the body. This study may reduce inflammatory and oxidative stress by limiting both hypertrophy and hyperplasia of adipocytes. Ruzckova et al reported, that marine n-3 PUFA has an anti-adipogenic effect during obesity development.26 Another study by Sander et al26 reported that decreasing the n-6:n-3 PUFA intake ratio to 3:1 reduces plasma TG levels in older people (aged 45–70 years).
Obesity and lipid accumulation are notable risk factors for metabolic and degenerative diseases; therefore, weight loss and body fat reduction (particularly visceral fat) may decrease the risk of these diseases. Since the majority of obesity-related diseases are preventable, developing a simple and reliable strategy for early risk detection is essential. We suggest the adoption of these simple and applicable screenings by using BMI, WC, C-Index, WHtR, or LAP algorithms. These parameters can detect the increasing of body fat composition and distribution. Furthermore, any confirmed participants at risk should promptly undergo follow-up and treatment with appropriate management, through modified nutrient intake and exercise. Appropriate detection and prevention of a complicated disease at earlier stages is more effective and efficient than its treatment at advanced stages. Moreover, most metabolic and degenerative diseases are still lacking on definitive pharmacologic regimens, and those currently available in the market are expensive. Hence, developing a simple and applicable approach comprising of restricted energy intake, high n-3 PUFA diet consumption and increased physical activity, as the main appropriate prevention and curative strategy, particularly in obese participants, is warranted.
Diet recommendation should consider not only from the health point of view, but it should also take into account the sustainability of the environment. Plant based food that is produced by converting the forest into plantation, such as palm oil, is less sustainable than the naturally growth plant like coconut oil. Currently, most countries recommended plant rather than animal based food, due to it is not only healthier but also has lower environmental impact.26 Moreover, using plant (canola) oil supplementation in our study offers two advantages. Firstly, it contains high n-3 PUFA (ALA). This will be desaturated and elongated in the human body to form the LC-PUFA (EPA, DPA, and DHA). Secondly, it also contains n-6 PUFA (LA) that will be desaturated and elongated to form dihomo gamma linolenic acid (DGLA). EPA and DGLA will release prostaglandin 3 series and prostaglandin 1 series as anti-inflammatory eucosanoids. These eucosanoids are essential in reducing level of inflammation. 28-30
The reduction in lipid parameters after the supplementation indicated the ability of n-3 PUFA to decrease the health risk of fat accumulation, such as insulin resistance, dyslipidaemia, cardiovascular, fatty liver, and several degenerative diseases.
Conclusion
Optimized energy restriction and daily supplementation of 3000mg PUFAs, n-6:n-3 ratio 2:1 (2100 mg LA and 1100 mg ALA) for 12 weeks decreases body fat accumulation in young obese women in Bali.
Acknowledgments
The authors were grateful to all of the participants of this study. We would like to thank Dr. Widjaja Lukito, PhD. (Faculty of Medicine, Indonesia University, Jakarta), for his expert comment and input. We would also like to thank all the students, dieticians, and aerobics instructors for their support and contributions to this study.
Funding Sources
This study was financially supported by Doctorate Grant Programme of Indonesian Danone Institute.
Conflict of Interest
The authors declare no conflict of interest.
References
- Ouchi N, Parker JL, Lugus JJ, Walsh K. Adipokines in inflammation and metabolic disease. Nat Rev Immunol. 2011; 11:85-97.
- Federico A, D’Aiuto E, Borriello F, Barra G, Gravina AG, Romano M, De Palma R. Fat: a matter of disturbance for the immune system. World J Gastroenterol. 2010;16:4762-72.
- Greenberg AS, Obin MS. Obesity and the role of adipose tissue in inflammation and metabolism. Am J Clin Nutr. 2006;83:461S–5S.
- Mirza MS. Obesity, visceral Fat, and NAFLD: querying the role of adipokines in the progression of nonalcoholic fatty liver d ISRN Gastroenterol. 2011;2011:592404. doi: 10.5402/2011/592404.
- Angulo P. Obesity and Nonalcoholic Fatty Liver Disease. Nutr Rev. 2007;65:S57-S63.
- Kahn HS. The “lipid accumulation product” performs better than body mass index for recognizing cardiovascular risk: a population based comparison. BMC Cardiovasc Disord. 2005;5:26.
- Bedogni G, Kahn HS, Bellentani S, Tiribelli C. A simple index of lipid overaccumulation is a good marker of liver steatosis. BMC Gastroenterol. 2010;10:98. doi: 1186/ 1471-230X-10-98.
- Chiang JK, Koo M. Lipid accumulation product: a simple and accurate index for predicting metabolic syndrome in Taiwanese people age 50 and over. BMC Cardiovasc Disord. 2012;12:78.
- Roriz AKC, Passos LCS, de Oliveira CC, Eickemberg M, Moreira PDA, Sampaio LR. Evaluation of the accuracy of anthropometric clinical indicators of visceral fat in adults and e PLoS ONE. 2014;9:e103499. doi:10.1371/jour nal.pone.0103499.
- Elizondo A, Araya J, Rodrigo R, Signorini C, Sgherri C, Comporti M, Poniachic J, Videla LA. Effects of weight loss on liver and erythrocyte polyunsaturated fatty acid pattern and oxidative stress status in obese patients with non-alcoholic fatty liver disease. Biol Res. 2008;41:59-68.
- Teng KT, Chang CY, Chang LF, Nesaretnam K. Modulation of obesity-induced inflammation by dietary fats: mechanisms and clinical evidence. Nutr J. 2014;13:12.
- McDonald BE. Canola oil: nutritional properties. Canada: Canola Council of Canada; [cited 2014/6/9]; Available from: http://www.canola-council.org/pdf/nutritionalprop.pdf.
- Pocock SJ. Clinical Trials – a practical approach. Chichester: John Wiley and Sons;
- Erhardt J. Nutrisurvey for Windows (only for non-commercial use). University of Indonesia, SEAMEO RECFON. www.nutrisurvey.de
- Martınez-Victoria E, Yago MD. Omega 3 polyunsaturated fatty acids and body weight.British Journal of Nutrition (2012), 107, S107–S116 doi:10.1017/S000711451200150
- Mejía-Barradas CM, Del-Río-Navarro BE, Domínguez-López A, Campos-Rodríguez R, Martínez-Godínez Md, Rojas-Hernández S, Lara-Padilla E, Abarca-Rojano E, Miliar-García Á. The consumption of n-3 polyunsaturated fatty acids differentially modulates gene expression of peroxisome proliferator-activated receptor alpha and gamma and hypoxia-inducible factor 1 alpha in subcutaneous adipose tissue of obese adolescents. Endocrine. 2014;45:98–105. doi: 10. 1007/s12020-013-9941-y
- Wojcik C, Lohe K, Kuang C, Xiao Y, Jouni Z, Poels E. Modulation of adipocyte differentiation by omega-3 polyunsaturated fatty acids involves the ubiquitin-proteasome system. J Cell Mol Med. 2014;18:590-9. doi: 10.1111/jcmm.12
- Yahagi N, Shimano H, Hasty AH, Amemiya-Kudo M, Okazaki H, Tamura Y et al. A crucial role of sterol regulatory element-binding protein-1 in the regulation of lipogenic gene expression by polyunsaturated fatty acids. J Biol Chem. 1999;274:35840-4.
- Xu J, Nakamura MT, Cho HP, Clarke SD. Sterol regulatory element binding protein-1 expression is suppressed by dietary polyunsaturated fatty acids. A mechanism for the coordinate suppression of lipogenic genes by polyunsaturated fats. J Biol Chem. 1999;274:23577-83.
- Brown JD, Plutzky J. Peroxisome proliferator-activated receptors as transcriptional nodal points and therapeutic targets. Circulation. 2007;115:518-33.
- Di Minno MND, Russolillo A, Lupoli R, Ambrosino P, Di Minno A, Tarantino G. Omega-3 fatty acids for the treatment of non-alcoholic fatty liver disease. World J Gastroenterol. 2012;18:5839-47. doi: 3748/wjg.v18.i41.5839.
- Berber A, Gomez-Santos R, Fanghanel G, Sanches-Reyes L. Anthropometric Indexes in the prediction of type 2 diabetes mellitus, hypertension, and dyslipidaemia in Mexican population. Int Obes Relat Metab Disord. 2001;25:1794-99.
- Haun DR, Pitanga FJG, Lessa I. Waist/height ratio compared with other anthropometric indicators of obesity as a predictor of high coronary risk. Rev Assoc Med Bras.2009;55:705-11.
- Browning LM, Hsieh SD, Ashwell M. A systematic Review of waist-to–height ratio as a screening tool for the prediction of cardiovascular disease and diabetes; 0.5 could be a suitable global boundary value. Nutr Res Rev. 2010;23:247-69.
- Ruzckova J, Rossmeisl M, Prazak T, Flachs P, Sponarova J, Vecka M, Tvrzicka E, Bryhn M, Kopecky J. Omega-3 PUFA of marine origin limit diet-induced obesity in mice by reducing cellularity of adipose t Lipid. 2004;39:1177-85.
- Sander TAB, Lewis F, Slaughter S, Griffin BA, Griffin M, Davies I, Milward DJ, Cooper JA, Miller GJ. Effect of varying ratio of n-6:n-3 fatty acid by increasing the dietary intake of α-linolenic, eicosapentaenoic and docosahexaenoic acid, or both on fibrinogen and clotting factor VII and XII in person aged 45-70 y: the OPTILIP Study. Am J Clin Nutr. 2006;84:513-22.
- Food Agrecultural Organisation and Food Research Network. Plates, pyramids, planet Developments in national healthy and sustainable dietary guidelines: a state of play assessment. University of Oxpord, 2016, pp 55-60.
- Patterson E, Wall R, Fitzgerald G F, Ross RP, and Stanton C. Review Article, Health implication of high dietary omega-6 polyunsaturated fatty acids. J Nutr and Metab,2012;Articel ID 539426, 16 pages.doi:10.1155/2012/53942
- Ziboh VA, Miller CC, Cho Y.Metabolism of polyunsaturated fatty acids by skin epidermal enzymes: generation of antiinflammatory and antiproliferative metabolites. Am J ClinNutr. 2000; (1 suppl):361s-6s.PMID: 10617998
- Wu CC, Huang MY, Kapoor R, Chen CH, Huang YS. Metabolism of omega-6 polyunsaturated fatty acids in women with dysmenorrhea. Asia Pac J ClinNutr,2008;17 (S1):216-9 .

This work is licensed under a Creative Commons Attribution 4.0 International License.


