

Introduction
Quinoa (Chenopodium quinoa), a pseudocereal of South American origin is getting popular and globally cultivated for its excellent nutrition and agronomic characteristics.1, 2 It can withstand changing climatic conditions, infestation, demands only less water and nutrients for its growth and is expected to replace commonly cultivated rice and wheat in future.3, 4 The quinoa seed is considered as the superfood of all plant-based foods because of its supreme protein quality.5 It has higher protein content (16.5%) compared to cereals like rice (7.6%), wheat (14.3%), maize (10.22%), barley (10.8%), oat (11.6%) and rye (13.4%).3, 6 Lysine, a deficient amino acid in cereals is enriched in quinoa.7 The relatively greater bioavailability, biological value, net protein utilization and protein efficiency ratio of quinoa protein makes it comparable to milk and egg protein.8 As quinoa being free of gluten, it would not cause inflammation in the villus of people suffering from celiac disease.9 The lower glycemic index (33-53) of quinoa makes it suited for diabetic people.10 Quinoa has a high unsaturated fat profile with a major contribution from essential fatty acids like linoleic and linolenic acid.6 It remains a good source for B complex vitamins and minerals such as calcium, potassium, iron, zinc etc.1,11 Apart from providing essential nutrients, other health promoting properties like antioxidant, antihypertensive, anti-inflammatory, anticarcinogenic and antidiabetic activity make quinoa a functional food.2 Transforming quinoa into a ready-to-eat snack and including it in the dietary pattern of children could be a sustainable approach to overcome prevailing nutrition deficiency due to affordability and accessibility achieved of being a snack.7, 12 Puffing is a simple and low-cost technology in which the whole grains are exposed to high temperature for a short time.13 The heat induces steam generation and vapour pressure increment inside the grain, which at one point burst the outer pericarp or shell of grain thereby expanding the starchy endosperm to several folds.14 Puffed products are porous, crispy, aerated, cellular structured and have good consumer acceptance.15 Besides enhancing palatability, puffing also improves shelf life, increase bioavailability and suppress antinutrients.16-18 Studies have confirmed that the puffing process does not cause significant loss to nutrients because of short exposure time.19 There are different methods of puffing such as hot air puffing, oil popping, sand puffing, microwave puffing, fluidized bed puffing and gun puffing.13 Sand puffing is the conventional method of puffing widely practiced because of its low capital cost involved.20 The conduction mode of heat transfer using particulate solids i.e. sand as a medium serves as an effective method compared to hot air puffing. It involves the mixing of grains in a bed of hot sand to ensure uniform heat transfer.21, 22 The principle phenotypic characteristics of grain influencing puffing quality are kernel size and shape, density, husk interlocking, endosperm type and amylose content.23, 24
The manufacturers buy the raw grains in weight and sell the puffed grain in terms of volume to derive profit.19 On the other hand, the consumer expects the puffed product to have uniform puffing, free from contamination and tough hulls, good color, crispiness, tenderness, fluffiness and other organoleptic qualities.24, 25 Optimization of processing conditions becomes crucial to have a greater puffing yield, reducing wastage, increasing expansion volume, enhancing the sensory quality and retaining the nutrients.26, 27 Though there are previous studies on microwave puffing and gun puffing of quinoa, the high capital and operational cost involved in these methods pose a limitation.28,29 Being a widely used low-cost puffing method, sand puffing could be used for the production of puffed quinoa commercially, but the optimum process condition is still not explored. Therefore, the present work is aimed to study the effect of varying the pretreatments and sand puffing conditions on puffing quality of quinoa followed by statistical optimization of independent factors using response surface methodology.
Materials and Methods
Sample Preparation
The dried white quinoa whole grains containing 11.86 ± 0.13% moisture (wet basis) was procured from Organic India Private Limited, Bangalore. About 10g of grains were used for each experimental trial and they were hydrated by adding a definite quantity of water or salt solution. The grains were then tempered for about 30 minutes at 27 ºC to achieve equilibrium. The cooking pan containing fine sand was heated using a LPG burner and the heat supply was controlled by adjusting the knob. The temperature of the sand bed was monitored using a high precision infrared thermometer. Once the desired temperature reached, the tempered grains were added into sand bed and mixed continuously for a specific time. After separating the grains from sand, grains were packed in low-density polyethylene pouches and taken for analysis.
Experimental Design and Statistical Analysis
The puffing experiment was designed using Box-Behnken design with 4 process variables having 3 levels each and 5 response parameters to get 29 experimental trials. Design Expert 12 (Trial Version StatEase) software was used to examine the statistical significance of model terminologies. The independent process variables chosen in the study were moisture added (0.2-1 ml/10g), salt concentration (0-1%), puffing temperature (200-240ºC) and puffing time (20-60 s) with coding as A, B, C and D respectively. The five important puffing quality measures such as puffing yield (%), expansion ratio, flake size (mm3), bulk density (g/ml) and overall acceptability were taken as dependent variables. All the trials were replicated thrice and its mean value was used for analysis. The optimized model was verified for its significance by one-way analysis of variance (ANOVA) at a 5% level of significance (p<0.05) using Minitab 19 statistical software.
Sample Analysis
Puffing Yield
Puffing yield measures the quantity of grains fully puffed out of raw grains taken for puffing. The grains were considered fully puffed only when the grain has expanded or bulged endosperm structure with a disintegrated hull. The mixture containing both puffed and unpuffed quinoa was separated into fractions by handpicking and the weight of fractions was recorded. Puffing yield was calculated using the following formula,22
![]()
Expansion Ratio
Volume expansion ratio determines the degree of expansion of grains during puffing and it has a positive correlation with profit on sales. The popped grains were filled in 100ml graduated cylinder and volume was measured after tapping it 12 times. The expansion ratio can be expressed as follows,27
![]()
Flake Size
Flake size also called puff size is a measure of final average puffed volume for individual puffed grain. The volume of 100 fully popped grains was recorded. It was calculated as follows,26
![]()
Bulk Density
Bulk density measures the degree of lightness of the puffed product. It was measured by the tapping method. The following formula was used for its calculation,15
![]()
Sensory Evaluation
The sensory evaluation of puffed quinoa was conducted by 10 semi-trained panel members. The samples were coded using a random three-digit number and served to panelists with written instructions for evaluating in terms of appearance, taste, odour, flavour, texture and overall acceptability. The scores were provided based on 9 point hedonic scale.30
Results and Discussion
Effect of Process variables on Puffing Yield
From Table 1, it could be observed that puffing yield ranged from 0.19 to 78.80%. The quadratic model was well fitted to the data and statistical significance for linear, interaction and quadratic terms were calculated for puffing yield as shown in Table 2. The model has F value of 8.10 which implies that the model is significant (p<0.001). Liner coded terms such as A, C and D, and quadratic term C2 are highly significant. The non-significance of Lack of fit shows the good fit of the model to the data. Moreover, the model adequacy evaluated with predicted R2 of 0.596 is in reasonable agreement with adjusted R2 of 0.7801 and therefore this model can be used to navigate the design space. The model equation expressing the effect of process variables on puffing yield in terms of coded values is given as,

Comparing the F value of process variables in Table 2, the greater F value of puffing temperature indicates that it is the most influencing factor followed by puffing time and moisture. Salt concentration has an insignificant effect on puffing yield. The positive model coefficient of linear terms such as puffing temperature (C) and puffing time (D) implies that it has a positive effect on puffing yield whereas the term moisture added (A) has a negative correlation.
Table 1: Experimental design and effect of independent variables on their corresponding dependent variables for sand puffing of quinoa.
| Trial | Independent Variables | Dependent Variables | |||||||
| A | B | C | D | Puffing Yield (%) | Expansion Ratio | Flake Size (mm3) | Bulk Density (g/ml) | Overall Acceptability | |
| 1 | 0.6 | 0.5 | 220 | 40 | 64.03 | 2.54 | 6.66 | 0.45 | 7.50 |
| 2 | 1 | 0.5 | 200 | 40 | 1.21 | 0.13 | 2.33 | 0.58 | 4.38 |
| 3 | 0.6 | 1 | 220 | 20 | 30.01 | 2.23 | 5.00 | 0.53 | 6.80 |
| 4 | 0.6 | 1 | 240 | 40 | 51.64 | 2.65 | 5.33 | 0.43 | 7.25 |
| 5 | 0.6 | 0.5 | 240 | 60 | 63.00 | 2.52 | 5.33 | 0.43 | 6.43 |
| 6 | 0.6 | 0.5 | 200 | 60 | 27.77 | 1.75 | 4.80 | 0.51 | 5.50 |
| 7 | 0.6 | 0 | 220 | 60 | 73.43 | 2.94 | 7.33 | 0.40 | 8.00 |
| 8 | 1 | 1 | 220 | 40 | 38.40 | 2.20 | 6.00 | 0.51 | 6.53 |
| 9 | 0.6 | 1 | 200 | 40 | 3.20 | 0.43 | 3.00 | 0.55 | 4.70 |
| 10 | 0.2 | 1 | 220 | 40 | 66.59 | 2.70 | 7.33 | 0.43 | 8.20 |
| 11 | 1 | 0 | 220 | 40 | 60.70 | 2.46 | 6.33 | 0.49 | 6.80 |
| 12 | 0.6 | 0.5 | 220 | 40 | 59.62 | 2.66 | 6.33 | 0.47 | 8.20 |
| 13 | 0.2 | 0.5 | 220 | 20 | 42.79 | 2.91 | 6.80 | 0.47 | 7.50 |
| 14 | 1 | 0.5 | 240 | 40 | 63.60 | 2.59 | 5.00 | 0.45 | 7.00 |
| 15 | 0.6 | 1 | 220 | 60 | 63.12 | 2.75 | 7.80 | 0.45 | 7.82 |
| 16 | 1 | 0.5 | 220 | 60 | 54.65 | 2.50 | 7.33 | 0.47 | 6.95 |
| 17 | 0.6 | 0.5 | 220 | 40 | 27.24 | 2.54 | 6.33 | 0.47 | 7.90 |
| 18 | 0.6 | 0.5 | 220 | 40 | 61.86 | 2.77 | 8.66 | 0.46 | 8.00 |
| 19 | 0.2 | 0.5 | 240 | 40 | 78.58 | 2.72 | 7.66 | 0.36 | 8.10 |
| 20 | 0.6 | 0 | 200 | 40 | 2.71 | 0.85 | 3.30 | 0.53 | 4.70 |
| 21 | 0.6 | 0 | 220 | 20 | 30.53 | 2.70 | 5.33 | 0.50 | 7.00 |
| 22 | 0.2 | 0 | 220 | 40 | 74.76 | 3.05 | 7.66 | 0.40 | 8.50 |
| 23 | 0.6 | 0.5 | 220 | 40 | 63.60 | 2.67 | 6.66 | 0.45 | 8.15 |
| 24 | 0.6 | 0.5 | 200 | 20 | 0.19 | 0.03 | 0.83 | 0.55 | 4.50 |
| 25 | 0.2 | 0.5 | 200 | 40 | 3.80 | 1.26 | 5.00 | 0.50 | 5.25 |
| 26 | 0.6 | 0.5 | 240 | 20 | 65.00 | 2.90 | 5.70 | 0.45 | 7.53 |
| 27 | 0.6 | 0 | 240 | 40 | 63.24 | 2.68 | 7.00 | 0.44 | 7.76 |
| 28 | 0.2 | 0.5 | 220 | 60 | 78.80 | 3.05 | 8.33 | 0.36 | 8.65 |
| 29 | 1 | 0.5 | 220 | 20 | 29.13 | 2.27 | 4.33 | 0.55 | 6.42 |
A-Moisture added (ml/10g sample), B-Salt Concentration (%), C-Puffing Temperature (ºC), D-Puffing Time (s)
Table 2: One-way analysis of variance (ANOVA) for model parameters.
| Source | F Value | ||||
| Puffing Yield (%) | Expansion Ratio | Flake Size (mm3) | Bulk Density (g/ml) | Overall Acceptability | |
| Model | 8.10S | 105.65S | 15.15S | 51.47S | 26.55S |
| A-Moisture Added | 5.56S | 74.82S | 26.36S | 62.80S | 46.87S |
| B-Salt Concentration | 1.60 | 17.66S | 1.24 | 4.38S | 1.52 |
| C-Puffing Temperature | 69.85S | 804.75S | 56.39S | 97.38S | 160.78S |
| D-Puffing Time | 15.51S | 36.42S | 33.56S | 41.33S | 9.21S |
| AB | 0.349 | 0.145 | 0 | – | 0.001 |
| AC | 0.268 | 17.91S | 0.0001 | – | 0.112 |
| AD | 0.192 | 0.145 | 1.30 | – | 0.819 |
| BC | 0.255 | 2.72 | 1.13 | – | 0.554 |
| BD | 0.167 | 1.40 | 0.385 | – | 0.0009 |
| CD | 1.53 | 78.99S | 11.34S | – | 9.40S |
| A2 | 0.188 | 0.117 | 0.504 | – | 2.24 |
| B2 | 0.239 | 0.778 | 0.382 | – | 2.90 |
| C2 | 16.54S | 403.81S | 73.76S | – | 141.42S |
| D2 | 0.236 | 2.47 | 3.44 | – | 6.73S |
| Lack of Fit | 0.405 | 1.65 | 0.2025 | 4.27 | 1.72 |
| R2 | 0.8901 | 0.9906 | 0.9381 | 0.8956 | 0.9637 |
| Adjusted R2 | 0.7801 | 0.9812 | 0.8761 | 0.8782 | 0.9274 |
| Predicted R2 | 0.5960 | 0.9537 | 0.8159 | 0.8418 | 0.8197 |
| Standard Deviation | 11.96 | 0.1181 | 0.6443 | 0.0193 | 0.3432 |
| C.V % | 25.82 | 5.23 | 11.02 | 4.10 | 4.92 |
S– Significant terminologies (p<0.05)
AB, AC, AD, BC, BD and CD – Interaction Terms; A2, B2, C2 and D2 – Quadratic Terms R2– Coefficient of Determination, C.V % – Coefficient of Variance
It can be seen from Fig. 1 that puffing yield gets increased with an increase in puffing temperature and puffing time because of the increment in vapour pressure inside the grain leading to the puffing of the maximum number of grains.20 The quadratic term C2 has a negative effect due to the charring of grains at a very high temperature (240 ºC). Similar findings have been reported by Nakade et al., 2020 in which the popping yield of rice increased with an increase in puffing temperature, but got reduced at excessive temperature conditions (280 ºC).31 The increase in the quantity of moisture added reduced the puffing yield (Fig. 2) because of softening of pericarp or hull portion making the grain unable to withstand the internal pressure for puffing.29 Vorwald & Nienhuis, 2009 observed decrease in popping (%) of Nuna bean with an increase in moisture from 2.5 to 20%.32
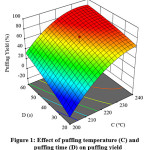 |
Figure 1: Effect of puffing temperature (C) and puffing time (D) on puffing yield Click here to View figure |
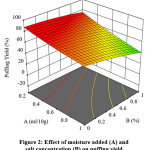 |
Figure 2: Effect of moisture added (A) and salt concentration (B) on puffing yield Click here to View figure |
Effect of Process variables on Expansion Ratio
The data of the expansion ratio of quinoa on the puffing experiment ranged from 0.03 to 3.05 (Table 1). The quadratic model was suggested and the F value of model (105.65) implies that the model is highly significant (p<0.0001) (Table 2). Lack of fit is not significant and therefore the model has good fitness for the data. The linear coded terms such as A, B, C, and D, interaction terms such as AC and CD, and quadratic term C2 are significant. The model can be used to navigate the design space because the predicted R2 value of 0.9537 is in reasonable agreement with the adjusted R2 of 0.9812. The regression equation representing the effect of process variables on expansion ratio is given below,

From F values given in Table 2, the expansion ratio is greatly affected by puffing temperature followed by moisture added, puffing time and salt concentration. The greater the puffing temperature (C) and puffing time (D), the greater is the expansion ratio as interpreted from its positive model coefficients. The moisture added (A) and salt concentration (B) has a negative correlation with the expansion ratio. It can be observed from Fig. 3 that increase in puffing temperature and puffing time increases expansion ratio because of the conversion of moisture present in the grain into steam thereby increasing the pressure gradient necessary for greater expansion.33, 34 Similar results have been found by Chauhan et al., 2015 in which the expansion ratio of pearl millet was increased with an increase in puffing temperature.16 Mishra et al., 2015 stated that greater residence time for puffing increased the expansion ratio of sorghum.27 The negative C2 and CD value imply that the expansion ratio reduced at a very high temperature with longer puffing time combination because of carbonization induced shrinkage of puffed grains.21 The increase in moisture decreased expansion ratio (Fig. 4) because the pericarp ruptures at a moment when the pressure inside the kernel is low leading to less expanded structure.35 Swarnakar et al., 2020 stated that an increase in the moisture content of rice from 8% to 12% decreased the expansion ratio on puffing.36 In case moisture content is high, high temperature is essential for puffing to cause more expansion as inferred from the positive coefficient of interaction term AC. As the salt concentration increased, expansion ratio decreased (Fig. 4) because salt bounds the free water and retards the rate of evaporation thereby reducing vapour pressure necessary for expansion.37, 38
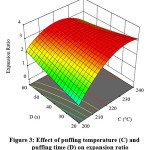 |
Figure 3: Effect of puffing temperature (C) and puffing time (D) on expansion ratio Click here to View figure |
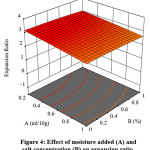 |
Figure 4: Effect of moisture added (A) and salt concentration (B) on expansion ratio Click here to View figure |
Effect of Process Variables on Flake Size
Larger flake size is desirable for a puffed product. Flake size varied from 0.83 to 8.66 mm3 during the puffing experiment (Table 1). The one-way analysis of variance (ANOVA) given in Table 2 shows a significant model F value of 15.15 (p<0.0001) and a non-significant lack of fit indicates that the quadratic model can be used for fitting experimental data. The magnitude of F value expresses the significance of linear coded terms such as A, C and D, interaction term CD and quadratic term C2. The difference of predicted R2 value of 0.8159 and adjusted R2 value of 0.8782 is less than 0.2 and this agreement allows the navigation of design space. The equation of the model fitted for flake size of puffed quinoa in coded form of process variables is given below,

The magnitude of the β-coefficient of model terms revealed that puffing temperature (C) is the most influencing process variable followed by puffing time (D) and moisture added (A). Salt concentration (B) has an insignificant effect on flake size. The puffing temperature and puffing time have a positive correlation with flake size, whereas moisture added is negatively correlated. In Fig. 5, on increasing the puffing temperature and puffing time, the flake size of puffed quinoa increases because of the greater degree of expansion.39 The negative interaction term CD indicates the reduction of flake size under the combination of a very high puffing temperature (240 ºC) with more exposure time (60 s). Moisture increment from 0.2 ml to 1 ml/10g sample significantly reduce the flake size (Fig. 6) because of lesser expansion resulting from the collapse of grain pericarp.26 García-Pinilla et al., 2019 found the reduction in flake size of popcorn with an increase in moisture from 9.62 to 14.62%.35
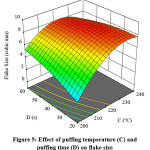 |
Figure 5: Effect of puffing temperature (C) and puffing time (D) on flake size Click here to View figure |
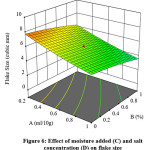 |
Figure 6: Effect of moisture added (C) and salt concentration (D) on flake size Click here to View figure |
Effect of Process Variables on Bulk Density
The higher the degree of expansion volume, the lower is the bulk density. Bulk density data of puffed quinoa ranged from 0.36 to 0.58 g/ml (Table 1). The linear model was found to fit well for the data and the model F value of 51.47 implies that the model is highly significant (p<0.0001) (Table 2). Lack of fit test is not significant and predicted R2 value is compatible with adjusted R2 value. The regression equation for bulk density is as follows,
![]()
All the 4 linear parameters are significant and out of which puffing temperature (C) is the most influencing parameter on bulk density followed by moisture added (A), puffing time (D) and salt concentration (B). It can be observed from Fig. 7 that increase in puffing temperature and puffing time reduces the bulk density of puffed quinoa because greater volume expansion at this condition resulted in light product incorporating many void spaces.40 On the other hand, if moisture added and salt concentration increased, bulk density also increased (Fig. 8) because of retardation of expansion and a high specific gravity of salt.41, 42 Similar results have been obtained by Pardhi et al., 2019 in which the bulk density of brown rice grits based extrusion puffed snack increased with an increase in moisture and a decrease in temperature.43
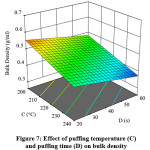 |
Figure 7: Effect of puffing temperature (C) and puffing time (D) on bulk density Click here to View figure |
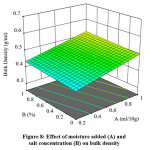 |
Figure 8: Effect of moisture added (A) and salt concentration (B) on bulk density Click here to View figure |
Effect of Process Variables on Overall Acceptability
Based on sensory analysis, the average values of the overall acceptability of puffed quinoa obtained from different experimental trials ranged between 4.38 and 8.65 (Table 1). The higher F value of 26.55 indicates that the suggested quadratic model is significant (p<0.0001) and lack of fit test was proved to be insignificant (Table 2). The predicted R2 value of 0.8197 is in reasonable agreement with an adjusted R2 value of 0.9274. The following is the model equation providing the effect of independent variables on overall acceptability of puffed quinoa in terms of coded values,

Significant model terms include linear terms such as A, C and D, interaction term CD and quadratic terms such as C2 and D2. Salt has an insignificant effect on overall acceptability. Based on one-way analysis of variance (ANOVA) for model terminologies, puffing temperature (C) is the most influencing factor followed by moisture added (A) and puffing time (D).
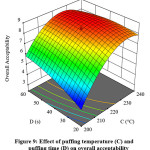 |
Figure 9: Effect of puffing temperature (C) and puffing time (D) on overall acceptability Click here to View figure |
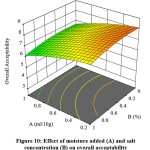 |
Figure 10: Effect of moisture added (A) and salt concentration (B) on overall acceptability Click here to View figure |
The 3D plot given in Fig. 9 projects the increment in overall acceptability with an increase in puffing temperature and puffing time because the greater expansion at this condition enhances crispiness of product thereby providing good mouthfeel on consumption.39 Similar findings have been reported by Joshi, 2011 in which overall acceptability of puffed rice increased with an increase in preheating temperature and puffing time.33 The negative C2 term is because of the charring effect at an excessive temperature (240 ºC) providing a bitter taste and unappealing black color to puffed quinoa. The negative coefficient of interaction term CD infers that very high puffing temperature (240 ºC) with long puffing time (60 s) should not be preferred to get an acceptable overall acceptability score. From Fig. 10, an increase in moisture and salt reduces overall acceptability because of increased hardness and decreased expansion of puffed quinoa.20 Mishra et al., 2015 found that the overall acceptability of puffed sorghum reduced with an increase in moisture and excessive levels of salt.27
Optimization of Sand Puffing Conditions
Numerical optimization was performed for the process variables to obtain puffed quinoa having a minimum bulk density and maximum puffing yield, expansion ratio, flake size and overall acceptability. A higher weightage was provided for puffing yield, expansion ratio and overall acceptability. Out of 100 solutions generated by the software, the best outcome having maximum desirability of 0.988 was chosen as optimum. The optimum process variables are 0.2 ml moisture/10g quinoa grains, 0.2% salt concentration, 229 ºC puffing temperature and 55 s puffing time. From the optimized condition, puffing yield of 86.23%, expansion ratio of 3.08, flake size of 8.21 mm3, bulk density of 0.36 g/ml and overall acceptability of 8.65 can be achieved.
Verification of the Model
The Puffing experiment was conducted at the optimum condition with three replications for verification of model by one-way analysis of variance (ANOVA). Under this condition, puffing yield of 84.77%, expansion ratio of 3.04, flake size of 8.12 mm3, bulk density of 0.38 g/ml and overall acceptability value of 8.47 was obtained. The actual response was found to have no significant difference (p<0.05) with the predicted response which confirms the suitability of the produced model.
Conclusion
The experiment on sand puffing of quinoa using response surface methodology established the effect of moisture addition, salt concentration, puffing temperature and puffing time on quality measures such as puffing yield, expansion ratio, flake size, bulk density and overall acceptability. The puffing temperature was found to be the most influencing parameter for all the responses measured. The lower moisture addition (0.2 ml/10g sample) with low salt concentration (0.2%) and puffing at high temperature (229 ºC) and time (55 s) within critical limit would produce puffed quinoa having superior qualities satisfying manufacturers as well as consumers. As quinoa is enriched with essential nutrients and bioactive compounds, the developed healthy snack has the potential for combating malnutrition.
Acknowledgement
The authors would like to thank the teaching and non-teaching staff of the Department of Food Technology, Kongu Engineering College for their support and guidance.
Funding
The authors received no financial support for the research, authorship, and/or publication of this article
Conflict of Interest
The authors declare no conflict of interest.
References
- Satheesh N. & Fanta S. W. Review on structural, nutritional and anti-nutritional composition of Teff (Eragrostis tef) in comparison with Quinoa (Chenopodium quinoa Willd.). Cogent Food & Agriculture. 2018;4(1):1-27.
- Valcárcel-Yamani B. & Lannes S. C. Applications of Quinoa (Chenopodium quinoa willd.) and Amaranth (Amaranthus Spp.) and their influence in the nutritional value of cereal based foods. Food and Public Health. 2012; 2(6):265-275.
- Jancurova M., Minarovičová L. & Dandar A. Quinoa – a review. Czech J. Food Sci. 2009;27(2):71-79.
- Camaggio G. & Amicarelli V. The ancient crop of Quinoa for world food security. In: Miśniakiewicz M. & Popek S. Commodity Science in Research and Practice- Future Trends and Challenges in Food Sector. 1. Cracow: Polish Society of Commodity Science; 2014:31-45.
- Bhathal S., Grover K. & Gill N. Quinoa-A treasure trove of nutrients. Journal of Nutrition Research. 2015;3(1):45-49.
- Filho A. M. M., Pirozi M. R., Borges J. T. D. S., Santana H. M. P., Chaves J. B. P. & Coimbra J. S. D. R. Quinoa: Nutritional, Functional and Antinutritional Aspects. Rev. Food Sci. Nutr. 2017;57(8):1618-1630.
- Graf B. L., Rojas-Silva P., Rojo L. E., Delatorre-Herrera J., Baldeon M. E. & Raskin I. Innovations in health value and functional food development of Quinoa (Chenopodium quinoa Wild.). Rev. Food Sci. Food Saf. 2015;14(4):431-445.
- Abdellatif A. S. A. Chemical and technological evaluation of Quinoa (Chenopodium quinoa willd) cultivated in Egypt. Acta Scientific Nutritional Health. 2018;2(7):42-53.
- Martin M. I. G., Moncada G. W., Fischerb S. & Escuredoc O. Chemical characteristics and Mineral composition of Quinoa by Near-Infrared Spectroscopy. Sci. Food Agric. 2014;94(5):876-881.
- Gordillo-Bastidas E., Diaz-Rizzolo D. A., Roura E., Massanes T. & Gomis R. Quinoa (Chenopodium quinoa willd), from nutritional value to potential health benefits: an integrative review. Nutr. Food Sci. 2016;6(3):497.
- El-Sohaimy S. A., Mohamed S. E., Shehata M. G., Mehany T. & Zaitoun M. A. Compositional analysis and functional characteristics of quinoa flour. Annual Research & Review in Biology. 2018;22(1):1-11.
- Baltork F., Torbati M., Damirchi S. & Savage G. P. Quality properties of puffed corn snacks incorporated with sesame seed powder. Food Sci. Nutr. 2018;6(1):85-93.
- Mishra G., Joshi D. C. & Panda B. K. Popping and puffing of cereal grains: a review. Journal of grain processing and storage. 2014;1(2):34-46.
- Dharmaraj U., Ravi R. & Malleshi N. G. Physicochemical and textural characteristics of expanded finger millet. International journal of food properties. 2012;15(2), 336-349.
- Kumar L., Mishra N., Patel S., Khokhar D. & Lakra A. Rice puffing characteristics of some selected varieties. Trends in Biosciences. 2017;10(30):6263-6267.
- Chauhan S. S., Jha S. K., Jha G. K., Sharma D. K., Satyavathi T. & Kumari J. Germplasm screening of Pearl Millet (Pennisetum glaucum) for popping characteristics. Indian J. Agric. Sci.2015;85(3):344-348.
- Huang R., Pan X., Lv J., Zhong W., Yan F., Duan F. & Jia L. Effects of Explosion Puffing on the nutritional composition and digestibility of grains. J. Food Prop. 2018;21(1):2193-2204.
- Pilat B. E. A. T. A., Ogrodowska D. & Zadernowski R. Y. S. Z. A. R. D. Nutrient Content of Puffed Proso Millet (Panicum miliaceum L.) and Amaranth (Amaranthus cruentus L.) Grains. Czech J. Food Sci. 2016;34(4):362-369.
- Swapna G. Popcorn – a healthy nutritional speciality corn value added product. International Journal of Food and Nutritional Science. 2017;6(2):1-5.
- Joshi N. D., Mohapatra D., Joshi D. C. & Sutar R. F. Puffing characteristics of parboiled milled rice in a domestic convective–microwave oven and process optimization. Food Bioprocess Technol. 2014;7(6):1678-1688.
- Hoke K., Housova J. & Houska M. Optimum conditions of rice puffing. Czech J. Food Sci. 2005;23(1):1-11.
- Kapoor P. Nutritional and functional properties of popped Little Millet (Panicum sumatrense). [Ph.D. dissertation]. Quebec, Canada: Dept. Bioresource. Eng., McGill University Libraries; 2013.
- Solanki C., Saha D., Kudos S. A. & Gupta R. K. Effect of popping methods on popping characteristics of Amaranth grain. J. Chem. Stud. 2018;6(2):2779-2782.
- Biswal S., Mohapatra S. R. & Panda M. K. Designing and development of a portable rice puffing machine. International Journal of Latest Trends in Engineering and Technology. 2017; 8(1):140-147.
- Jele P., Derera J. & Siwela M. Assessment of popping ability of new tropical popcorn hybrids. J. Crop Sci. 2014;8(6):831-839.
- Sweley J. C., Rose D. J. & Jackson D. S. Quality traits and popping performance considerations for popcorn (Zea mays Everta). Food reviews international. 2013;29(2):157-177.
- Mishra G., Joshi D. C. & Mohapatra D. Optimization of pretreatments and process parameters for Sorghum popping in microwave oven using Response Surface Methodology. Food Sci. Technol. 2015;52(12):7839-7849.
- Zapana F, de Bruijn J., Vidal L., Melín P., González M. E., Cabrera G. & Bórquez R. Physical, chemical and nutritional characteristics of puffed quinoa. International Journal of Food Science & Technology. 2020;55(1):313-322.
- Rahman H. L., Salleh M. H. M. L. & Salim N. S. Effect of moisture content and microwave power on puffed yield and expansion volume of Malaysian paddy variety Mr297. Appl. Biol. 2019;48(1):139-143.
- Lavanya A., Reddy D. K., Maloo S. & Bhasker V. Development and standardization of pasteurized sliced vegetable mix preserved with cover liquid. International Journal of Food Science and Nutrition. 2019;4(2):1-3.
- Nakade K., Khodke S., Kakade A. & Othzes N. Optimization of Process Technology for Popping of Sorghum. International Journal of Current Microbiology and Applied Sciences. 2020;9(1):180-192.
- Vorwald J. & Nienhuis J. Effects of seed moisture content, cooking time and chamber temperature on Nuna Bean (Phaseolus vulgaris L.) popping. HortScience. 2009;44(1):135-137.
- Joshi N. D. Technology development for production of ready-to-eat puffed rice using microwave energy. [D. dissertation]. Anand, India: Dept. Food. Process Tech. Bioenergy., Anand Agricultural University; 2011.
- Sangeetha A., Swathi K., Saranya A., Devanampriyan R. & Sathyaraayan A. N. Optimization of domestic garlic flavoured conventional parboiled puffed rice (Oryza sativa L.) using RSM. International Journal of Scientific & Technology Research. 2020;9(4):2510-2513.
- García-Pinilla S., Gutiérrez-López G. F., Hernández-Sánchez H., Cáez-Ramírez G., García-Armenta E. & Alamilla-Beltrán L. Quality parameters and morphometric characterization of hot-air popcorn as related to moisture content [Published online ahead of print date]. Drying Technology. 2019. https://doi.org/10.1080/07373937.2019.1695626.
- Swarnakar A. K., Srivastav P. P. & Das S. K. Optimization of pressure parboiling conditions and pre-conditioned moisture content of brown rice (unpolished rice) for microwave puffing and its comparison with hot sand bed puffing. International Journal of Food Studies. 2020;9:11-16.
- Chen J. Y., Zhang H. & Miao Y. The effect of quantity of salt on the drying characteristics of fresh noodles. Agriculture and Agricultural Science Procedia. 2014;2:207-211.
- Mohapatra M. & Das S. K. Mechanizing the conditioning process of rice before puffing.ORYZA-An International Journal on Rice. 2011;48(2):114-118.
- Jaybhaye R. V. & Srivastav P. P. Development of barnyard millet snack food: Part I. Food Science Research Journal. 2015;6(2):238-245.
- Mir S. A., Bosco S. J. D., Shah M. A., Mira M. M. & Sunooj K. V. Process optimization and characterization of popped brown rice. J. Food Prop. 2016;19(9):2102-2112.
- Singh R. R., Majumdar R. K. & Venkateshwarlu G. Optimum extrusion-cooking conditions for improving physical properties of fish-cereal based snacks by response surface methodology.Journal of food science and technology. 2014;51(9):1827-1836.
- Pitts K. F., Favaro J., Austin P. & Day L. Co-effect of salt and sugar on extrusion processing, rheology, structure and fracture mechanical properties of wheat–corn blend. Journal of Food Engineering. 2014;127:58-66.
- Pardhi S. D., Singh B., Nayik G. A. & Dar B. N. Evaluation of functional properties of extruded snacks developed from brown rice grits by using response surface methodology. Journal of the Saudi Society of Agricultural Sciences. 2019;18(1):7-16.

This work is licensed under a Creative Commons Attribution 4.0 International License.


