

Introduction
Consumers purchase organic food items mainly because they believe that they are more environment-friendly, better in taste and healthier than food crops cultivated using chemical pesticides and fertilizers. 1, 2, 3, 4, 5 Organic rice is the most consumed organic food products in Indonesia.6 Rice produced with organic products, without any synthetic pesticides or synthetic chemical fertilizers, is believed to meet the health concerns in terms of the absence of or reduced levels of undesired chemical residues.7 The percentage of organic rice consumption compared to the total rice consumption in Indonesia increased from 1.62 in 2011 to 5.02 in 2017.8 In order to explore the degree to which organic rice production and consumption contribute to expected sustainability and health outcomes, not only the manner of production but also considering the method of consumption and the intake of organic rice.9, 10 The primary production of organic rice and a part of the processing is regulated according to set organic standards (e.g. IFOAM 2008), while further processing and eating are not regulated by any recognized body (WHO, DGE). Nevertheless, organic rice can also be consumed as brown rice (partly polished) or as white rice (polished).
Whole grain rice comprises unpolished grains, commonly called brown rice, which is hulled directly from rough rice, which remains the bran 6%-&% and also the embryo 2%-3%.11 It contains a higher amount of micro-nutrient components, as compared to white rice.11, 12, 13, 14 Milling is one of the simple ways to achieve rice stability and sensory properties even though nutrients also get depleted.15, 16 During the milling process, the reduction of protein and minerals13, 17 Like other nutrients, phenolic and flavonoid content is inevitably lost during the process of milling rice. The outer layer of brown rice consists rich of nutrient including amino acids, dietary fibre, and vitamins. Our research group has reported that bioactive compounds derived from rice bran fractions consist of ferulic acid, adenosine and L-tryptophan.18, 19, 20 Besides, other researchers reported that bioactive compounds also consist of phenolic compounds, dietary fibres and g-aminobutyric acid.21 Even though high of bioactive content the consumption is still low due to the sensory attributes.14
The research revealed that the high white rice consumption might lead the micro-nutrient deficiencies.12, 13, 22, 23 Some researcher has reported there is a link the intake of refined carbohydrates and the risk of diabetes.24, 25 In the other hand, brown rice is linked to a lower risk of a non-communicable disease,26, 27, 28, 29, 30, 31 as well as reduce the risk of metabolic-related diseases and cancers.32, 33, 34, 35 However, polished rice has more value in marketplaces across the world, including Indonesia.36
In the response of organic 3.0, organic food it must have a role model for the sustainable food system,37 which mean, include primarily healthy diets.9, 10, 38, 39, 40 Therefore, a demanding of organic principles from farm to table is necessary. The critical question is how to determine the processing methods for organic raw materials.41, 42 The acceptance of whole-grain foods is essential to connect better sustainable organic agricultural practices and processing techniques sustainable processing for promoting a healthy diet. 43 In these papers, we, introducing rice milling methods to bioactive compounds and sensory properties.
Materials and Methods
Sample
The organic rice samples of Sintanur cultivar were harvested in July from a tropical rain-fed rice field located in Tasikmalaya, Indonesia. The organic rice field was certified according to the Indonesian National Standard SNI 6729-2016 Sistem Pertanian organik. The sample (organic rice) was cultivated by an organic farming group (Gapoktan Simpatik member of AOI – Indonesia Organic Alliance). A batch of 50 kg was transported directly after harvest to the laboratory Technopark, Bogor Agricultural University, Bogor. From this lot, a sample of 250 grams in three replications was successively milled for interval 30s from 0s to 120s with Rice Test Mill Model TM05C (Satake Co., Hiroshima, Japan). Each sample (50 g each) were contained and kept at room temperature storage. The study was designed, as shown in Fig. 1.
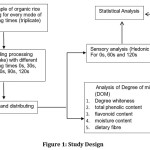 |
Figure 1: Study Design. Click here to View figure |
Determination of Degree of Milling
The Degree of Milling (DOM) based on the equation where the weight of the rice bran compares to whole brown rice as formulated below 44:
DOM = [1-(weight of milled rice/weight of brown rice)] x 100 %
Determination of degree of whiteness
The analysis of the degree of whiteness using Kett Photoelectric Tube Whiteness Meter for Powder C300.
Determination of total phenolic content
Folin Ciocalteu method was used to calculated total phenolic content (TPC).45 Extract of 125 µL aliquot diluted with 0.5ml distillate water and react with reagent Folin- Ciocalteu about six minutes. Then, 7% aqueous Na2CO3 was added for about 1.25 ml up to 3 ml. After incubation for 90 minutes, the mixture was determined by spectrometer UV-1800 at 760 nm. The standard was gallic acid equivalent (GAE) per 100 g dry basis (db).
Determination of total flavonoid content
The colourimetric method was used to determine total flavonoid content. 45 Extract of 300 µL was added 1.5 ml distilled water. After that, 5% of NaNO2 solution was added about 90 µL, then incubate for six minutes and diluted for up to 3 ml. Measurement of absorbance at 510 nm by suing UV-1800 spectrometer and the measurement must be immediately after incubation. Catechin equivalent used as the standard per 100 g dry matter sample.
Analysis of moisture content (AOAC 2006)
The moisture content was calculated as following steps: 1) Weighing of the empty dish after three hours with a lid in the oven at a temperature of 105 °C and transferred to a desiccator for cooling. 2) Weighing 3 g of the sample then after three hours with a lid in the oven at a temperature of 105 °C for three hours after it was transferred to a desiccator for cooling. 3) Re-weighing the dish and its dried sample. The moisture content was calculated on db.
Analysis of dietary fibre
The sample was prepared in 0.3 mesh and mix with buffer phosphate, then 0,1 ml were added in the water bath for 15 minutes with temperature 100 °C and shake interval 5 minutes—adjusted pH to 7.5 by adding 0.275 NaOH and let the sample to cool down. Further, 5 g protease and 0.1 ml of enzyme solution are added. The sample is incubated for 30 minutes. Subsequently, it is allowed to cool, and 10 ml of 0.325 M HCL is added. Then adjusted to 4.0–4.6; by adding 0.3 ml of amyloglucosidase; after that, incubated at a temperature of 60 °C for 30 minutes with continued agitation. Addition of 280 ml of 95% ETOH and heated at a temperature of 60 °C for 60 minutes. Add 0.1 mg celite with 78% ETOH and filtered. Add the residue by using 20 ml of 78% ETOH (3x), 10 ml of 95% of ETOH and 10 ml Acetone (1x). Dried the residue in a vacuum oven at a temperature of 70 °C or 105 °C, until the constant weight. Then weighed and calculated by using DF = a – (b)/w x 100, where a = weight of sample constant; b = weight of ash; w = weight of initial samples.
Sensory analysis
A total of 40 university students (16 male and 24 female) were recruited in the Sensory Evaluation Laboratory, Universitas Bakrie, Jakarta. The sensory evaluation follows the norm of ISO 13299: 2016 Sensory-methodology-general guidance for establishing a sensory profile. 46 sample was cooked in a rice cooker with a rice-to-water ratio of 1:2.5 for 45 minutes. A ratio scale was prepared to measure panellist response by using a scale line, 0 cm indicates extreme dislike and the 10 cm indicates extreme-like. Panellist evaluates attribute of aroma, taste, colour, texture as well as the overall liking. Discriminant analyses were used to predict to which group an observation would belong. Data were presented by using a Principle Component Analysis (PCA) to describe the characteristics of the subjects’ responses.
Statistical Analysis
One-way statistical of ANOVA (SPSS 16.0, SPSS Inc., Chicago, IL, USA). Significant different at p < 0.05. The XLStat Sensory performed the Principle Component Analysis (PCA).
Results and Discussion
Degree of milling (DOM)
The increase in the milling time (0 s, 30 s, 60 s, 90 s, 120 s) corresponded to increasing average DOM values at 0, 9.73, 13.08, 18.05 and 26.19% respectively (Fig. 2). According to the Indonesian rice standard SNI 2015 6128, the best quality of rice required 100% DOM. The higher of DOM resulted in higher sensory acceptance and implied higher market value.13 Furthermore, the study on rice’s DOM was related to cultivar. 47 However, the relationship between nutritional and sensory properties and the DOM was not investigated in their study.
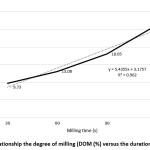 |
Figure 2: Relationship between the degree of milling (DOM (%) and the duration of milling (s) Click here to View figure |
Milling is the step in the processing of rice, where husk and bran are removed. According to the Indonesian rice standard 2015 (SNI 6128:2015), premium rice should meet the requirement of 100% polishing, or it should be equivalent to 54.47% degrees of whiteness (for long grain) and 61.07% degrees of whiteness (for short grain). After the harvest, paddy rice undergoes the milling process. In this process, pre-cleaner, de-stoner, rubber rolls husker, paddy separator, polishing (abrasive whitening, friction whitening, mist polishing), grading and packaging is performed. During the polishing, rice is separated into rice bran and brewer rice. Polished rice in the milling processing aims to remove the caryopsis, mainly the aleuronic, but minimize the break/damage to grain. In the effect of milling, processing whole kernels at 55%, broken kernels at 15%, and rice bran and polished rice at 10% and hulls at 20% is obtained.48
The relation between milling time and moisture content
Moisture content indicates the rice grain quality. Rice grains under 14% (d.b.) could prevent spoilage during storage. According to the Indonesian rice standard SNI 6128: 2015, premium rice should not have more than 14% (db) moisture content. In this study, the moisture content of rice ranged from 12.03 to 12.30 %.(db); and no relationship between increasing milling time and moisture content. A previous study stated that brown rice could be stashed away for 3–6 months at room temperature (23–34 °C) in the quality relatively constant if the grain is 14% moisture content.49, 50 and in modified atmospheres packaging as well as vacuum packaging showed a slow decline in the quality.51, 52
Milling time versus the degree of whiteness
There was a change in the rate constant (slope) during the milling process.13 As the degrees of whiteness increases, the DOM also increases, from 27.63% to 51.62% as seen in Table 1. These trends confirmed those of previous studies. 13, 53, 54 According to the Indonesian rice standard 2015 (SNI 6128:2015), a degree of whiteness of 51.48% for the short grain is equal to 95% DOM..55
The relation between milling time and TPC
TPC significantly decreases with the increase in milling time (p < 0.05) from 295.41±6.99 GAE/100gDW to 32.01±1.79 GAE/100gDW, as seen in Table 1. The decrease in the TPC between 0 s to 30 s of milling time was two times greater compared to 60 s to120 s. The study confirmed the result of other studies that reported a decrease in TPC due to increased milling time. 44 Previous studies revealed that the relationship between nutrient loss and the DOM shows that the loss of lipids, proteins, vitamins and minerals enhanced significantly as the DOM increased. 11, 12, 13, 56
Whole brown rice can be potential as a source of active compounds that are beneficial for micronutrient deficiency. 57 58 The brown rice consumption is potentially preventing chronic diseases. 59, 60 The increasing the milling time has significantly lowered the phenolics content in brown organic rice.
The relation between the milling time and the flavonoid content
The phenolic profiles and flavonoid content were present in the bran layer. 13, 61 The flavonoid content significantly decreases with the increase in milling time (p < 0.05), as seen in Table 1. At 30 s to 60 s, a high amount of flavonoid content is released from the rice during the milling process. The flavonoids fall from 3.92 to 2.42 mg CE/100g DW as the milling time rose from 0 s to 120 s.
The effect of rice processing to bioactivty of brown rice; it has been reported that TPC declined approximately 55.6% and the total antioxidant activity decreased in approximately 92.8% during the milling of brown rice till up to 9.6% of DOM. 44 Additionally, bound forms of the total phenolic and flavonoids decreased with an increase in the DOM. Other research works revealed that the flavonoid content of coloured rice is higher compare to white rice. 62
Table 1: Characteristic physicochemical in the difference of 0s, 30s, 60s, 90s and 120s milling times.
| Categories | Milling time (s) | ||||
| 0 | 30 | 60 | 90 | 120 | |
| DOM (%) | – | 9.73 | 13.08 | 18.05 | 26.19 |
| Degree of Whiteness (%) | 27.63e ±0.01 | 33.92d±0.12 | 40.74c±0.75 | 47.39b±0.56 | 51.62a±1.5 |
| Total Phenolics Contents (mg GAE/100g DW) | 295.41a±6.99 | 107.11b±2.66 | 53.53c±1.20 | 39.46d±0.55 | 32.01e±1.79 |
| Flavonoids (mgCE/100gDW) | 3.92a±0.03 | 3.64b±0.07 | 3.02c±0.07 | 2.81d±0.04 | 2.42e±0.02 |
| Dietary fiber (%) | 11.61a±0.14 | 11.34b±0.25 | 11.33b±0.11 | 11.29c±0.01 | 11.17d±0.06 |
| Moisture Content (% d.b) | 12.29±0.02 | 12.30±0.03 | 12.30±0.01 | 12.23±0.06 | 12.03±0.15 |
a b c d e Different superscript letters in the same row indicate significant differences (p < 0.05)
data means ± standard deviation
The relation between the milling time and dietary fibres
Dietary fibres decreased significantly with an increase in the milling time (p < 0.05), from 11.61±0.14% to 11.17±0.06%, as shown in Table 1. A study has reported that several phenolic acid profiles, as well as total antioxidant activity of brown rice, decreased while the available carbohydrates increased with polishing. 61
Sensory Analysis
The sensory analysis employed in this study does not reflect the panellists’ acceptability. This analysis only shows that panellists could recognize the differences between the samples depending on the milling time (0 s, 60 s and 120 s) (Fig. 3).
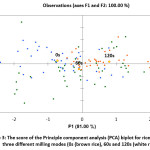 |
Figure 3: The score of the Principle component analysis (PCA) bi plot for rice samples in three different milling modes (0s (brown rice), 60s and 120s (white rice) Click here to View figure |
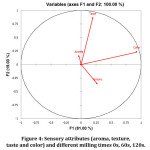 |
Figure 4: Sensory attributes (aroma, texture, taste and color) and different milling times 0s, 60s, 120s. Click here to View figure |
Discriminant analysis has been widely used as is classified as ungrouped cases. From the study, discriminant analysis model was generated to identify a characteristic aroma, texture, taste, and colour (Fig. 4). Panellists perceived the taste and colour in the upper-right quadrant, like the centroid of white rice (120 s). Colour, appearance, texture, taste, and overall quality of white rice were strongly preferred over brown rice by the consumers. The aroma resides in the upper-left quadrant, a similar quadrant to that of brown rice (0 s). 63 A probable explanation for this difference in the aroma intensities could use a universal aromatic scale, the references with low intensities, which may aid panellists in evaluating the intensities of the aroma of rice samples. 64
The texture lies in the lower-right quadrant, opposite to the others. The texture characteristics and the flavour of cooked rice have been found to be influenced by the DOM and the hedonic score for a branny taste and decrease in chewiness with an increase in the milling time. 61, 64
The 60 s milled rice samples were scattered in almost all quadrants, suggesting that panellists may have difficulty in detecting a sensory difference. However, for 0 s and 120 s, the panellists had a consensus that 0 s mostly lay in the upper-lower left quadrant, and 120 s mostly lay in the upper-lower right quadrant. These results indicate that the DOM played a significant role in modulating the sensory aspects of organic rice. The study revealed that rice bran plays a crucial role in determining the sensory aspects of rice. 66
Overall liking
The overall liking of the product and sensory experience may have a significant impact on consumers’ buying decisions. Knowledge regarding sensory preference is crucial for the producers and marketers of organic rice to offer the product and communication strategies that meet consumers’ expectations. With increased milling time, the overall liking of organic rice increased, as shown in Figure 5. There was a slight difference in the degree of liking between men and women; however, both preferred organic rice with 120 s milling time as compared to 0 s and 60 s.
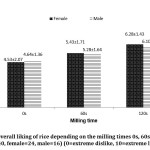 |
Figure 5: Overall liking of rice depending on the milling times 0s, 60s, and 120s (n=40, female=24, male=16) (0=extreme dislike, 10=extreme like) Click here to View figure |
The attributes of brown rice were not favourable by the panellist since they were more familiar with white rice.67 Several studies have reported that its chewy texture and poor appearance are the primary reasons for the lower acceptance of brown rice.63, 68 Unlike brown rice, both the attributes of white rice (chewy texture and good appearance) are preferred by the consumer. The study has been done for Asian consumers resulted that they did not evaluate brown rice positively. 61, 68
Conclusion
This study demonstrates that DOM affects the Nutri-health aspects and sensory attributes of organic rice. Our findings confirm that organic brown rice (0 s of milling time) has a significantly higher number of bioactive compounds (TPC, flavonoids and dietary fibre) but lower sensory acceptance as compared to intensive milling (120 s). Considering the criteria for the nutritional and functional properties for healthy food, the degree of milling may be an essential factor for setting the standard for organic rice in Indonesia. It must be accomplished by spreading information about its benefits and taking proactive measures towards encouraging its use by consumers and other stakeholders, such as public services. To set the milling time as part of the standard is a political process between the actors. The actions required would entail, for example, revealing nutritional information to the consumers, as well as introducing less polished rice in restaurants and canteens. Moreover, the introduction of coloured rice cultivars, along with lower DOMs may enhance consumer acceptance for the product.
Acknowledgements
The research has supported by Aliansi Organis Indonesia (AOI) and Ristekdikti. The authors gratefully acknowledge the technical assistance of Ms Syifa Fauziah.
Conflict of Interest
We are declaring, and there is no conflict of interest
References
- Tauscher B., Brack G., Flachowsky G., Henning M., Koepke U., Meier-Ploeger A., Muenzhing K., Niggli U., Pabst K., Rahmann G., Willhoerf C and Mayer-Miebach E. Bewertung von Lebensmitteln verschiedener Herkunft. Statusberict 2003. BMEL-senatsarbeitsgruppe Qualitative Bewertung von Lebensmitteln aus alternativer und konventionaller Produktion. Final Report, Karlsruhe, 2003.
- Torjusen H., Sangstad L., O’Doherty-Jansen K and Kjaenes U. European consumers perception of organic food: a review of available research. Project report 4- 2004 for the national institute for consumer research. Oslo, Norway. 2004.
- Stolz H., Stolze M., Janssen M., Hamm U. Preferences and determinants for the organic, conventional and conventional-plus product-the case of occasional organic consumers. Food Quality Preference 2011; 22 (8): 772-779.
- Pino G., Peluso A.M., Guido G. Determinant of regular and occasional consumer’s intentions to buy organic food. Journal Consum Aff. 2012; 46 (1): 157-169.
- Zagata L. Consumers beliefs and behaviour institutions toward organic food. Evidence from the Czech Republic. Appetite, 2012; 59 (1): 81-89.
- David W and Ardiansyah. Organic agriculture in Indonesia: challenges and opportunities. Organic Agriculture. 2017; 7 (3), 329–338.
- David W and Ardiansyah. Perception of young consumers towards organic food in Indonesia. International Journal of Agriculture Resources, Governance and Ecology. 2017; (13) 4, 315
- Hidayat A.S and Lesmana T. The development of organic rice farming in Indonesia. RIEBS, 2011; 2 (1) 71-87.
- Nutrition and food systems. A raport by the High Level Panel of Experts on the Food Security and Nutrition of the Committee on World Food Security, Rome. 2017.
- Kahl J., Strassner C., Hertwig J., Gould D., Bugel S., Paoletti F., Lairon D. Learning from the organic food system as a model for sustainable food systems – the Organic Food System Program. In: Sustainable value chains for sustainable food systems. Eds. Meybeck A, Redfern S, FAO. 2016.
- Chen H., Sibenmorgen T.J., Griffin K. Quality characteristic of long-grain rice milled in two commercial systems. Cereal Chem. 1998; 75 (4), 560-565.
- Itani T., Tamaki M., Arai E & Horino T. Distribution of amylose, nitrogen, and minerals in the rice kernel with various characters. Journal of Agriculture and Food Chemistry, 2002; (50) 5326-5332.
- Lambert L., De Bee E, Vandeputte G.E., Veraverbecke W.S., Derycke V., De Man W et al. Effect of milling on color and nutritional properties of rice. Food chemistry 200; 100 14-96-1403.
- Ohtsubo K., Suzuki K., Yasui Y., Kasumi T. Bio-fucntional components in the process pre-germinated brown rice by a twin screw extruder. Journal food composition and analysis 2005; 18 (4): 303-316.
- Finocchiaro F., Ferrari B., Gianinetti A., Dall’Asta C., Galaverna G., Scazzina F. Characterization of antioxidant compounds of red and white rice and changes in total antioxidant capacity during processing. Mol Nutr Food Res. 2007; 51:1006–1019.
- Ha T.Y., Ko S.N., Lee S.M., Kim H.R., Chung S.H., Kim S.R., Yoon H.H., Kim I.H. Changes in nutraceutical lipid components of rice at different degrees of milling. Eur J Lipid Sci Technol. 2006; 108:175–181.
- Prom-u-Thai C., Fukai S., Godwin I.D., Huang L.B. Genotype variation of iron partitioning in rice grain. Journal of the Science of food and Agriculture 2007; 87 (11): 2049-2054.
- Ardiansyah A., Shirakawa H., Koseki T., Ohinata K., Hashizume K., Komai M. Rice bran fractions improve blood pressure, lipid profile, and glucose metabolism in stroke-prone spontaneously hypertensive rats. J Agric Food Chem. 2006; 54, 1914–1920.
- Ardiansyah A., Shirakawa H., Shimeno T., Koseki T., Shiono Y., Murayama T., Hatakeyama E., Komai M. Adenosine, an identified active component from the Driselase-treated fraction of rice bran, is effective to improve metabolic syndrome in stroke-prone spontaneously hypertensive rats. J Agric Food Chem. 2009; 57, 2558-2564.
- Ardiansyah A., Shirakawa H., Inagawa Y., Koseki T., Komai M. Regulation of blood pressure and glucose metabolism induced by L-tryptophan in stroke-prone spontaneously hypertensive rats. Metab. 2011; 8: 45.
- Cho D.H., Lim S.T. Germinated brown rice and its biofunctional compounds. Food Chem. 2016; 196:259–271.
- David, W. Mini review of conventional rice milling: It is suitable for organic rice. Asia Pacific Journal of Sustainable Agriculture Food and Energy. 2017; 5 (2) 1-2.
- Radhika G., Van Dam R.M., Sudha V., Ganesan A & Mohan V. Refined grain consumption and the metabolic syndrome in Urban Asian Indians (Chennai Urban Rural Epidemology Study 57). 2009; 58: 675-681.
- Hu F.B., Manson J.E., Stampfer M.J., Colditz G, Liu S, Solmon C.G., Willet W.C. Diet, lifestyle, and risk of type 2 diabetes mellitus in women. N Engl J Med. 2001; (13) 345: 790-797.
- Villegas R., Liu S, Gao Y.T., Yang G., Li H., Zheng W., Shu XO. Prospective study of dietary carbohydrate, glycemic index, glycemic load, and incidence of type 2 diabetes mellitus in the middle-aged Chinese women. Arch Intern Med. 2007; 167 (21): 2310-6.
- Hu F.B., Willet W.C. Optimal diets for prevention of coronary heart diseases. JAMA 2002; (288) 2569-2578.
- Fung T.T., Hu F.B., Pereira M.A., Liu S, Stampfer M.J., Colditz G.A., Willet W.C. Whole grain intake and the risk of type 2 diabetes: A prospective study in men. Am J Clin Nutr, 2002; 76,535-540.
- Liu S. Intake of refined carbohydrates and whole grain food in relation to risk of type 2 diabetes mellitus and coronary heart disease. J Am Coll Nutr. 2002; (21) 298-306.
- McKeown N.M, Meigs J.B., Liu S., Wilson P.W., Jacques P.F. Whole grain intake is favorable associated with metabolic risk factor for type 2 diabetes and cardiovascular disease in the Framingham Offspring Study. Am J Clin Nutr 2002; (76) 390-398.
- de Munter J.S., Hu F.B., Spiegelman D., Franz M., van Dam R.M. Whole grain, bran and germ intake and risk of type 2 diabetes: A prospective cohort study and systematic review. 2007; 4 e261.
- Esmaillizadeh A., Mirmiran P., Azizi F. Whole grain consumption and the metabolic syndrome: A favorable association in Tehranian adluts. Eur J Clin Nutr. 2005; 59, 353-362.
- Schatzkin A., Park Y., Leitzmann MF.,Hollenbeck AR., Cross AJ. Prospective study of dietary fiber, whole grain foods, and small intestinal cancer, Gastroenterology 2008; 135: 1163–1167.
- Nettleton J.A., Steffen L.M., Loehr L.R., Rosamond WD., Folsom AR. Incident heart failure is associated with lower whole-grain intake and greater high-fat dairy and egg intake in the Atherosclerosis Risk in Communities (ARIC) study, Am. Diet. Assoc. 2008; 108: 1881–1887.
- Sun Q., Spiegelman D., van Dam RM., Holmes MD., Malik VS., Willett WC., Hu FB. White rice, brown rice, and risk of type 2 diabetes in US men and women, Int. Med. 2010; 170: 961–969.
- Kristensen M., Toubro S., Jensen M.G., Rosa AB., Riboldi G., Petronio M., Bugel S., Tetens I., Astrup A. Whole grain compared with refined wheat decreases the percentage of body fat following a 12-week, energy-restricted dietary intervention in postmenopausal women, Nutr. 2012; (142) 710–716.
- Champagne E.T. Brown Rice stabilization. In: Marshall WE, Wadsworth JI (eds) Rice science and technology. Marcel Dekker, Inc., New York, 1994. pp 17–35
- Rahmann, G., Reza Ardakani, M., Bàrberi, P., Boehm H., Canali S., Chander M., David W., Dengel L., Erisman JW., Calvis-Martinez AC., Hamm U., Kahl J., Kopke U., Kuhne S., Lee SB., Loes AK., Moos JH., Nuutila JK., Olowe V., Opperman R., Rembialkowska E., Riddle J., Rasmussen IA., Schade J., Sohn SM., Tadesse M., Tashi S., Thatcher A., Uddin N., von Fragstein und Niemdorff P., Wibe A., Wivstad M., Wenliang W., Zanoli R. Organic Agriculture 3.0 is innovation with research. Agr. 2017; 7: 169
- FAO/WHO. Second International Conference on Nutrition. Report of the joint FAO/WHO Secretariat on the conference Rome. FAO. 2015.
- Kesse-Guyot E., Boudry J., Assman KE., Galan P., Herberg I and Lairon D. Prospective association between consumption frequency of organic food and body weight change, risk of overweight or obesity: results from the Nutrinet Sante Study. British J Nutrition. 2017; 117 (2) 325-334.
- Meybeck A., Gitz V. Sustainable diets whitin sustainable food systems. Proceeding of the Nutrition society, 2017; 76: 1-11.
- Kahl J., Alborzi F., Back A., Bugel S., Busscher N., Geier U., Matt D., Meischner T., Paoletti F., Pehme S., Ploeger A., Rembialkowska E., Schmid O., Strassner C., Taupier-letage B., Zalecka A. Organic food processing: a framework for concept, starting definitions and evaluation. Journal of the Science of food and agriculture 2014; 94 (13): 2582-2594.
- Strassner C., Cavoski I., Di Cagno R., Kahl J., Kesse-Guyot E., Lairon D., Lampkin N., Loes A.K., Matt D., Niggli U., Paoletti F., Pehme S., Rembialkowska E., Schader C., Stolze M. How the organic food system supports sustainable diets and translates this into practice. Frontier Nutrition. 2015; 2 (19) doi: 10.3389/fnut.2015.00019.
- Chung H.J., Cho A. & Lim S.T. Utilization of germinated and heat-moisture thread brown rice in sugar –snap cookies. LWT-Food Science and Technology. 2014; 57, 260-266.
- Liu L., Guo J., Zhang R., Wei Z., Deng Y., Guo J., Zhang M. Effect of degree of milling on phenolic profiles and cellular antioxidant activities of whole brown rice. Food Chemistry. 2015; (185) 318- 325.
- Dewanto V., Wu X., Adom K. K. & Liu R. H. Thermal processing enhances the nutritional value of tomatoes by increasing total antioxidant activity. J Agric and Food Chem. 2002; 50, 3010-3014.
- International Standard Organization (ISO) 13299: 2016, Sensory analysis — Methodology — General guidance for establishing a sensory profile.
- Siebenmorgen T.J., Matsler A.L., Easrp C.F. Milling characteristics of rice cultivars and hybrids. Cereal Chemistry 2006; 83 (2): 169-172.
- Shih FF. An update on the processing of high-protein rice product. Nahrung. 2003; 47 (6): 420-4.
- Champagne ET., Grimm CC. Stabilization of brown rice product using ethanol vapors as antioxidant delivery system. Cereal Chemistry. 1995; 72 (3) 255-258
- Das A., Das S., Subudhi H., Mishra P., Shrama S. Extension of shelf life of brown rice with some traditionally available materials. Indian J Tradit Knowl 2012; 11(3):553–555
- Sharp R., Timme L. Effects of storage time, storage temperature, and packaging method on shelf life of brown rice. Cereal Chem 1986; 63(3):247–251
- Genkawa T., Uchino T., Inoue A., Tanaka F., Hamanaka D. Development of a low-moisturecontent storage system for brown rice: storability at decreased moisture contents. Biosyst Eng. 2008; 99(4):515–522.
- Lanning S.B., Siebenmorgen T.J. Comparison of milling characteristics of hybrids and pureline rice cultivars. Appl Eng Agric. 2011; (27) 787-795.
- Zong Y., Liu W., Xu X., Liu C and Tu Z. Correlation analysis between color parameters and sensory characteristic of rice with different milling degrees. J food process pres 2014; 38 1890-1897.
- SNI 6128: 2015. Indonesian National Standard on Rice. Badan Standarisasi Nasional.
- Rohrer C.A., Sibermorgen T.J. Nutracetical concentration within the bran of various rice kernel thickness fractions. Bio systems engineering 2004; 88 (4): 453-460.
- Friedman M. Rice brans, rice brans oil, and rice hulls: composition, food and industrial uses, and bioactivities in humans, animals, and cells. J agric. Food Chem. 2013; 61(45) 10626-10641.
- Tian S., Nakamura K., Kayahara H. Analysis of phenolic compound in white rice, brown rice and germinated brown rice. J Agric Food Chem. 2004; 52 (15) 4808-13.
- Okarter N, Liu RH. Health benefits of whole grain phytochemicals. Crit Rev Food Sci Nutr. 2010; 50 (3) 193-208.
- Zhou Z., Robards K., Helliwell S and Blanchard C. the distribution of phenolic acid in rice. Food Chemistry, 2004; (87) 401-406.
- Shobana S., Malleshi N., Sudha V., Spiegelman D., Hong B., Hu F. Effect nutritional and sensory profile of two indian rice varieties with different degrees of polishing. International Journal of Food Science Nutrition, 2011; (62) 800-810.
- Shen Y., Jin L., Xiao P., Lu Y., Bao J. Total phenolic, flavonoids, antioxidant capacity in rice grain and their relations to grain colour, size and weight. J Cereal Sci 2009; 49:106–111
- Sudha V., Spiegelman D., Hong B., Malik V., Jones C., Wedick N.M., Hu F.B., Willet W., Bai M.R., Ponnalagu M.M., Arumugam K., Mohan V. Consumer acceptance and preference study (CAPS) on brown and under milled Indian rice varieties in Chennai, India. J Am Coll Nutr. 2014; 32 (1): 50-57.
- Champagne E.T. Rice aroma and flavor: a literature review. Cereal Chem. 2008. 85: 445-454.
- Champagne E.T., Bett K.L., Vinyard B.T., Webb B.D., McClung A.M., Barton II FE Lyon BG., Moldenhauer K., Linscombe S., Kohlwey D. Effect of drying conditions, final moisture content and degree of milling on rice flavor. Cereal Chem. 1997; (74) 566-570.
- Rodriguez-Arzuaga M., Cho S., Billiris M.A., Siebenmorgen T., Seo H.S. Impact of degree of milling on the appearance and aroma characteristic of raw rice. J sci Food Agric, 2016; (96) 3017-3022.
- Wu F., Chen H., Yang N., Wang J., Duan X., Jin Z., Xu X. Effect of germination time on physicochemical properties of brown rice flour and starch from different rice cultivars. J Cereal Sci 2013; 58(2):263–271.
- Zhang G., Malik VS., Pan A , Kumar S., Holmes MD., Spigelman D., Lin X., Hu FB. Substituting brown rice for white rice to lower diabetes risk: a focus-group study in Chinese adults. J Am Diet Assoc 2010; 110(8):1216–1221.

This work is licensed under a Creative Commons Attribution 4.0 International License.


