Sensory Evaluation of Noodles Substituted by Sweet Potato Flour and Rice Bran
 , Ardiansyah*
 Department of Food Science and Technology, Universitas Bakrie, Jakarta, Indonesia.
Corresponding Author Email: ardiansyah@bakrie.ac.id
DOI : http://dx.doi.org/10.12944/CRNFSJ.8.1.13
Download this article as:
![]()
The substitution of the noodle is one of the strategy to enhance the acceptance of the product, instead of increasing of nutrition. Sweet potato flour (SPF) with high content of carbohydrate and rice bran (RB) have rich of active compounds. This study aims to evaluate the sensory profile in different concentrations of SPF (35, 30, and 25 %) and RB (10, 15, and 20 %) with and without the addition of mushroom flour. We used mushroom flour in order minimize the bitter taste of final product. The process of noodle production according previous studies with modifications. Projective Mapping (Napping) with 75 naïve panellists were performed to evaluate the colour, taste, flavour and the texture of six samples and one commercial product as a benchmark. The results showed that the noodles substituted with 35% of SPF and 10% of RB without mushroom flour had the nearest value with the benchmark. This was indicated to be preferable as compared to other samples. Moreover, the addition of RB resulted the lower consumer acceptance owing to the bitter taste. Furthermore, the addition of mushroom flour did not provide the influence against the selection of the noodles.
KEYWORDS:Noodle; Projective Mapping (Napping); Rice Bran; Sensory Evaluation; Sweet Potato Flour
Introduction
The world Instant Noodles Association (2019) states that Indonesia is the second biggest consumer of noodle after China. According to the association, China and Hong Kong consumed the most instant noodles last year with 40.25 million servings, followed by Indonesia with 12.54 million.1 The quality of noodles, based on its production involving wheat flour as a binding agent during the making of the dough, since the good quality is characterised by a firm and elastic texture.2 Generally, people prefer noodles with a hard texture (firm, chewy and elastic or resilient bite).2 Purple sweet potato can be used as an alternative ingredient to wheat flour substitute in the processing of noodles, as seen in previous studies that utilise purple sweet potato in noodle processing.3
The substitute ingredient often influences the sensory characteristics. Therefore, there needs to be a sensory test on the overall attributes of the product to the consumers.4 Sensory evaluation (SE) has been used to evaluate the sensory characteristics and consumer acceptance of the product. Hence, determination of the consumer expectations and the expression of consumer demands is classified into scientifically sound sensory descriptors. It provides an opportunity to describe and compare food samples, as well as to match consumer demands.5
The use of sweet potato flour (SPF) and rice bran (RB) in noodle research has attracted the sensory attributes of the consumers.6 SPF is high in carbohydrates as compared to wheat flour and had the high anthocyanin which 519 mg/100g on wet basis.7 Anthocyanin has a high level of antioxidants which has the function as antioxidant and have capacity to capture free radicals.8 It is also gives a good taste and flavour well-received by consumers in recent studies.9
RB had the flavour which was well-received by consumers, but it had a bitter taste, dark colour and hard texture, which were less preferable.10-12 RB is by-product of the rice milling process with a high amount of bioactive compounds that are potential sources of functional food. Ardiansyah et al., (2000) have shown that RB improves blood pressure, plasma blood glucose and lipid levels in stroke-prone spontaneously hypertensive rats.13 Therefore, RB was used to increase the value of the nutrition of the noodles.
Thus, with some deficiencies, the use of wheat flour is added to decrease the hard texture and dark colour. In addition, mushrooms have been reported as therapeutic foods and wider biological properties such as antibacterial, antimutagenic, and anticancer.14 Furthermore, mushrooms have special flavour and aroma15 and minimize the bitter taste of final product. The addition of 20% mushroom flour to dried noodles give a good taste, flavour, colour and acceptability.16 Thus, the aim of this study to evaluate sensory properties and consumer acceptance in different concentrations of SPF (35, 30, and 25 %) and RB (10, 15, and 20 %) with and without the addition of mushroom flour.
Materials and Method
The SPF used in this study was obtained from Lingkar Organik (lingkarorganik.or.id). Commercial Wheat flour (Cakra Kembar, Serang, Indonesia) and commercial tapioca flour (Alini, Serang, Indonesia), which were purchased from the local retail supermarket in Serang, Indonesia. Commercial RB (Bekatul Dr.Liem, Bandung, Indonesia) used in this study was obtained from online stores.
Noodle Processing
The method of noodle processing had modifications.17-18 The process for the production of noodles is shown in Figure 1. The processing is preceded by preparation of the raw materials and other additional ingredients, beginning with the weighing. This is followed by grinding the dough to hydrate the flour with water 30% and prepare the mixture of the material properly. After the dough is made, it is rolled into a sheet. The next step is the resting time. The resting time is necessary in order to homogenate the spreading of the water and develop gluten.17 Following this, the noodles are steamed before drying. Steaming is the process required for the gelatinization of starch and the coagulation of the gluten, in order to make the noodles chewy.18 A solar dryer with the temperature 32-27oC was used to reduce the water content to be 8–10%. After the moisture content reaches 8–10% of dryness, the noodles are ready to be packed.
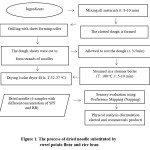 |
Figure 1: The process of dried noodle substituted by sweet potato flour and rice bran Click here to View figure |
Table 1: Trivial code sample
| Samples | Treatment | |
| Without Mushroom Flour | Added by Mushroom Flour | |
| Benchmark | 206 | |
| Formulation 1 | 195 | 301 |
| Formulation 2 | 214 | 229 |
| Formulation 3 | 275 | 123 |
Sample
The noodles were developed by different concentrations (%) of SPF and RB with and without the addition of mushroom flour. There were six samples of noodles and one commercial product as the benchmark (Table 1). There were 195 and 301 first formulations that consisted of 35% SPF and 10% RB (without mushroom flour); 35% SPF and 10% RB (added mushroom flour). The second formulation of 214 and 229 consisted of 30% SPF and 15% RB (without mushroom flour); 30% SPF and 15% RB (added mushroom flour). The third formulation with 275 and 123 consisted of 25% SPF and 20% RB (without mushroom flour); 25% SPF and 20% RB (added mushroom flour). The formulation sample is shown in Table 2 and is classified into trivial code numbers (Table 1).
Table 2: The sample formulations
| Ingredients | Samples* | |||||
| Formulation 1 (%)* | Formulation 2 (%) | Formulation 3 (%) | ||||
| 195 | 301 | 214 | 229 | 275 | 123 | |
| Wheat Flour | 29 | 29 | 29 | 29 | 29 | 29 |
| Tapioca Flour | 12 | 12 | 12 | 12 | 12 | 12 |
| Egg | 14 | 14 | 14 | 14 | 14 | 14 |
| Sweet Potato Flour | 35 | 35 | 30 | 30 | 25 | 25 |
| Rice Bran | 10 | 10 | 15 | 15 | 20 | 20 |
| Totals | 100% | |||||
*(195: 35% SPF and 10% RB (without mushroom flour); 301: 35% SPF and 10% RB (added mushroom flour); 214: 30% SPF and 15% RB (without mushroom flour); 229: 30% SPF and 15% RB (added mushroom flour); 275: 25% SPF and 20% RB (without mushroom flour); 123: 25% SPF and 20% RB (added mushroom flour)
*%: weight percentage
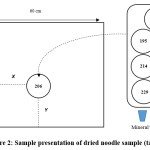 |
Figure 2: Sample presentation of dried noodle sample (tablecloth) Click here to View figure |
Sensory Evaluation
Sensory profile assessment is using projective mapping or napping® with 75 naïve panellists (30 male and 45 female). The assessment was conducted to evaluate the colour, taste, flavour, and texture of the samples. Napping® has attention in the recent references as a fast sensory profiling and analysis of consumer perception.19 Five grams of noodles, which were boiled five minutes prior to the testing, were served to panellists.
Napping® is a quick method of determining the sample position based on the group which has the same attributes. This grouping is based on the distance of the coordinates (X, Y).19 The panellist is free to place the sample in the 60 x 60 cm of paper, based on their preference and similarity/dissimilarity of the sample with the benchmark. The outcome is a contour map, elevated in a dimension field. ‘Elevation’ is representing the difference and acceptance rate of naïve panellist on a sample. The preference data will be obtained based on the distance between each sample of the noodles substituted by SPF and RB to the commercial product, as shown in Figure 2.
Chemical Analysis
The following parameters: proximate analysis (moisture and dietary fiber) were determined through AOAC methods. The moisture content was evaluated using AOAC (1995)20 and dietary fiber were evaluated using the residues that remained after extraction by ethanol (AOAC, 1995).20
Physical Analysis
The tensile strength test was comprised of springiness, cohesiveness and hardness were performed on 5 strands of rinsed noodles, 5 minutes after cooking, using a Texture profile analysis (TPA), using a TA-BT-KI Texture analyser. A set of 5 strands was placed parallel on a flat metal plate and compressed crosswise twice their original height. From the force time curve of the TPA, the springiness, cohesiveness and hardness were determined according to the description on the curve.
Elongation test was used to see the length and the strengthening power of the noodles after cooking for 5 minutes. The elongation test was done using a TA-DGA texture analyser. A set of 1 strand was placed on a clamp and stretched three times. From the force, the time curve of the elongation was determined according to the description on the curve.
The colour of the noodle sheets (1.50 mm thick, prior to cutting into strips) was evaluated using Chromameter (CR-300) and the CIE-Lab L*, a* and b* values were recorded as described.21 The L* value states that the position on the white/black axis, the a* value the position on the red/green axis, and the b* value the position on the yellow/blue axis. Three measurements were taken at two different locations and the readings were averaged.
Data Analysis
The data obtained from the sensory evaluation was analysed with Multiple Factor Analysis (MFA) with Software R v.3.4.0. This method was used to find out the level preference of some attributes.22 For the chemical analysis, the data were subjected to analysis variants (ANOVA), which were done by using SPSS 16.00 software (SPSS, Chicago, IL, USA), followed by Duncan’s post hoc test (p<0.05). Furthermore, the WordItOut online was used to analyse and visualise data in this study.
Results and Discussion
Confidence ellipses for napping
Confidence ellipses for napping shows the alleged position of dried noodles substitutions of SPF and RB of the prescribed panellist virtualisation.19 As shown in Figure 3, the ellipses show the assumption of positioning noodles that is determined by panellists as virtualisation.19
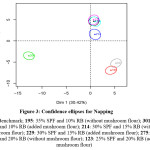 |
Figure 3: Confidence ellipses for Napping Click here to View figure |
(206: Benchmark; 195: 35% SPF and 10% RB (without mushroom flour); 301: 35% SPF and 10% RB (added mushroom flour); 214: 30% SPF and 15% RB (without mushroom flour); 229: 30% SPF and 15% RB (added mushroom flour); 275: 25% SPF and 20% RB (without mushroom flour); 123: 25% SPF and 20% RB (added mushroom flour)
Figure 3 shows the existence of three groups, namely a sample (206) as a benchmark, the second group consists of samples (195 and 301), while other groups contain other samples (214, 229, 275 and 123).
The ellipses indicated the midpoint of each sample that was already positioned by the panellists (Figure 3). Overall, the panellists classified the samples based on the percentage of SPF and RB. 75 panellist responses on the seven samples were different. Thus it can be inferred that all panellists are able to distinguish samples based on the formulation of noodles. The addition of mushroom flour did not provide the influence against the selection of the noodles. This could be possible because the addition of mushroom flour in this noodle constitutes only 5% of the dough. As mentioned in the research (16), which states that with the addition of mushroom flour by 20% in dried noodles, the taste, flavour, and colour will be enhanced and have a very good reception.
Group Representation
Group representation shows the assessment of 75 panellists against the noodles. In Figure 4, it was stated that a panellist assessed noodles substitution by SPF and RB homogeneously. It could be assumed all panellists were consistent with their judgment of the characteristics of noodles substitution by SPF and RB, which were determined as being the same. Therefore, the level variant of noodles substitution by SPF and RB are lesser.
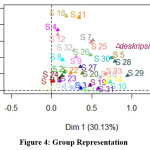 |
Figure 4: Group representation Click here to View figure |
Preference Mapping
Preference mapping is an explanation of the relationship between products with different levels of preference in each individual that showed a value of elevation. The value of the sample distance is converted by dividing the distance based on the paper dimensions in order that the results are obtained. The further the sampling distance to the commercial product, the sensory characteristics of the sample is considerably higher with the sensory attributes of the commercial product the highest elevation value means that naïve panellists prefer the samples. This also varied with the preference of each panellist.
The value of elevation are divided into three groups, there are the highest elevation value is a sample (206) as benchmark with a value of 60–70o (Figure 5). The second elevation value is a sample (195) with a value 50–60o, the third elevation is a sample (301) and (214) with a value 40–50o and the last elevation value are samples (229); (275) and (123) with the value 30–40o.
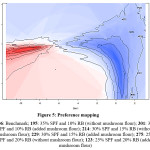 |
Figure 5: Preference mapping Click here to View figure |
(206: Benchmark; 195: 35% SPF and 10% RB (without mushroom flour); 301: 35% SPF and 10% RB (added mushroom flour); 214: 30% SPF and 15% RB (without mushroom flour); 229: 30% SPF and 15% RB (added mushroom flour); 275: 25% SPF and 20% RB (without mushroom flour); 123: 25% SPF and 20% RB (added mushroom flour)
Sample (195), that the noodles were substituted with, which contained 35% of SPF and 10% of RB and (206) as benchmark was chosen by naïve panellists, as it had the highest elevation value, which were 50o–60o and 60o–70o, indicated to be preferable compared to other samples and the highest elevation value compared to other samples. However, if reviewed, both the samples had a different pole position. It could be assumed that the sample (195) is not preferable, nor is it selected by a naïve panellist. This is due to the addition of RB and SPF to the noodle, resulting in a darker colour (brown and dark brown) and harder texture.
Based on the elevation value, this paper further explores why both of these samples have the highest elevation value. It is seen from the description of both of them, as listed on Figure 6.
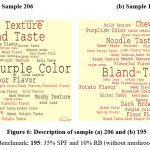 |
Figure 6: Description of sample (a) 206 and (b) 195 Click here to View figure |
(206: Benchmark; 195: 35% SPF and 10% RB (without mushroom flour)
As shown in the following Figure 6, sample (206) and (195) had some similarities of attributes, such as flavour, texture and taste as indicated in Table 3. However, the colour attribute is considered to have significant differences.
Table 3: The Description of samples*
| Sample | Description | Panelists (n) |
| 206 | Bland_Taste | 50 |
| Light purple_Color* | 47 | |
| Soft_Texture* | 37 | |
| Chewy_Texture | 28 | |
| Purple_Color* | 26 | |
| 195 | Bland_Taste | 53 |
| Hard_Texture* | 43 | |
| Brown_Color* | 27 | |
| Chewy_Texture | 19 | |
| Dark brown_Color* | 19 |
Note: (206: Benchmark; 195: 35% SPF and 10% RB (without mushroom flour)
Sensory evaluation is a scientific testing method for the accurate measurement of human responses as received by the five senses. Sensory evaluation is a vital part of food development as it is the essential means to determine how consumers will react to food.23 Panellists evaluate a particular food primarily based on how it appears, smells, tastes and feels. This evaluation aims to confirm the responses of the panellist, and the responses will be further reviewed in the next step with a physical analysis.
Taste
As shown in the following Table 3, flavours most expressed by the panellist is a bland flavour. This is because the samples served to the naïve panellist are not any seasoning additions. Besides the bland flavour, there were some panellists who expressed that they experienced a sweet and bitter taste. This is possibly derived from the sweet potato, which was obtained through the process of alpha-amylase and glucoamylase, which breaks the chains of starch into simple sugars24 and the bitter taste was probably derived from the hydrolysis of protein into peptides with hydrophobic compounds of low molecular weight by protease.25, 26 Thus, the addition of mushroom flour did not provide a better taste that influences against the selection of the noodles.
Colour
In the colour attribute, which had a significant difference between the sample (206) as benchmark with sample (195) the noodle substitution was by 35% SPF and 10% RB. Whereas, sample (195) had a darker colour than sample (206), which was certainly due to the composition and the processing. This is similar studies previously (27-28) that formulation wheat flour 15% and SPF 85% resulted dark colour.
Based on the results of the colour analysis, by Chromameter CR-300, L*, a* and b*, both the values are significantly different (P<0.05). The L* value in sample (206) 41.56 ± 0.57 had the highest value than sample (195) 23.01 ± 0.52. This means that sample (206) had the highest degree of brightness than sample (195), as well as the a* and b* value of the samples, both of which had a positive value. The a* and b* values of sample (195) had the highest value, in contrast to the L* value. This value means sample (195) had the highest degree of a yellowish colour and redness than sample (206).
Texture
In addition to the colour attribute, the attribute of texture also had a different description in the smooth (sample 206) and hard texture (sample (195). The difference in both of samples was possible to evaluate owing to the boiling time of 5 minutes, while according to Dessuara et al., (2015), the boiling time for the noodle substitution by another wheat flour was 9–10 minutes27 Thus, sample (195) had a hard texture similar with previous studies27-28 that wheat flour 15% and SPF 85% in formulation of dried noodle resulted hard texture. Interestingly, the result of the texture profile analysis (TPA) had no significant difference (P<0.05). This is according to the value of TPA, which is sample (195) 4.19 ± 2.92 and 2.85 ± 0.90 of sample (206).
Elongation
The elongation is one of the parameters to determine the quality of the noodles. The parameter is based on the measurement of tensile strength and strain. Tensile strength indicates the maximum force required to deform a material.29 The elongation test was done using a TA-DGA texture analyser and comprised the lengthening and strengthening of the noodles after they were boiled for 5 minutes. The result of TA-DGA analysis showed that the value of sample (195) 1.11 ± 0.06 and sample (206) of 0.25 ± 0.07 had significant differences (P<0.05). This is related to the decreasing proportion of gluten in sample 195. Gluten is a protein in wheat flour is used to form polymers that affect the quality of product. Mirsaeedghazi et al.,30 suggested that the tensile strength is associated with the presence of gluten proteins present in wheat flour. The protein matrix is formed from non-covalent crosslinks and the disulphide-bond then provides resistance to tensile forces.
Moisture Content
Moisture content certainly affects the quality of the final product produced, such as texture. Moisture content is the most important factor in the characteristics of dried noodles because it can affect the physical properties, chemistry, microbiology and even consumer acceptance. The moisture content of sample (206) commercial product and (195) had no significant differences. Although, the drying process against both samples is very different generally, it is quite interesting to look at its attributes, as it turns out that different drying processes does not give the significant value of different water content in both samples.
Sample (195) used a solar drying method for 48 hours, while the commercial products were dried in an oven cabinet. However, interestingly, the value of water content in both samples is included in the quality requirement of SNI 01-2974-1996 about dried noodles, 8-10%.
Dietary Fiber
Dietary fiber are a part of the plant and are composed of carbohydrates and resistant starch which can be digested and absorbed in the intestines of humans and is fermented in the colon.31 Dietary fiber were evaluated using the residues that remained after extraction by ethanol (AOAC, 1995). The result of analysis had significantly different (P<0.05). With the values 6.29 ± 0.16 of sample (195) and 4.20 ± 0.08 of sample (206), the significant difference is caused due to the composition. The addition of rice bran in sample (195) gave the influence of the dietary fiber value. This results are similar with previuous study that additional RB can effect to increase dietary fiber content.32
Conclusion
Noodles substituted by 35% of SPF and 10% of RB and benchmark had the highest elevation value, which were 50o–60o and 60o–70o but had a different pole position. Therefore, sample (195) was not accepted or selected by naïve panellists. It has a hard texture accordance with the result of texture profile analysis (TPA) (P<0.05) 4.19 ± 2.92 and a dark colour (brown and dark brown) with colour analysis (Chromameter CR-300) 23.01 ± 0.52. Furthermore, the addition of RB resulted in lower consumer acceptance with low elevation value. Moreover, the addition of SPF to the noodles resulted in a darker colour which complies with the physic analysis colour.
Acknowledgements
We would like to thank you to Directorate of Higher Education, Ministry of Research, Technology and Higher Education (RISTEKDIKTI) RI for research funding.
Funding
The author(s) received financial support from Directorate of Higher Education, Ministry of Research, Technology and Higher Education (RISTEKDIKTI) RI for the research, authorship, and/or publication of this article
Conflict of Interest
The authors have declared no conflict of interest associated with this publication.
References
- World Instant Noodles Association (WINA). Global Demand for Instant Noodles. Google; 2019. https://instantnoodles.org/en/noodles/market.html. Updated on May 9, 2019. Accessed on June 26, 2019.
- Setyani, S., Astuti, S., Florentina. 2017. Substitusi Tepung Tempe Jagung Pada Pengolahan Mie Basah. Jurnal Teknologi Industri dan Hasil Pertanian. 22 No. 1.
- Sukerti, N W., Damiati. and (2013). The Effect of Modification Three Varieties of Sweet Potato and Wheat Flour to The Quality and Receipt of Dried Noodles. Journal of Science and Technology. 2 (2).
- Lawless, H. T., and Heymann, H. (2010). Sensory Evaluation of Food (Principle and Practices) Second Edition. New York: Springer.
- Yilmaz, E., and Buket, (2012). Sensory Evaluation and Consumer Perception of Some Commercial Green Table Olives. British Food Journal. 114 (8):1085-1094.
- Dewi, E N. (2011). Quality Evaluation of Dried Noodle with Seaweeds Puree Substitution. Journal of Coastal Development. 14 (2):151-158.
- , Hendarto, L., dan Siregar, T. M. (2010). Pemanfaatan Ubi Jalar Ungu (Ipomea Batatas L. Poir) Sebagai Pengganti Sebagian Tepung Terigu dan Sumber Antioksidan Pada Roti Tawar. Jurnal Teknologi dan Industri Pangan. 21 (1): 25-32.
- Bilina, A., Waluyo, S., Suhanding, D. (2014). Kajian Sifat Fisik Mie Basah dengan Penambahan Rumput Laut. Jurnal Teknik Pertanian Lampung. (2) 2:109-116.
- Saputra, B F., Dian R A., Danar, P. (2014). Study of Sensory, Nature Chemical and Functional Properties Substitution Noodles With Red Rice Bran and Purple Sweet Potato F Journal Teknosains Pangan. 3 (2): 49-56.
- Nugrahawati, T. (2011). Study of The Characteristics of Dried Noodles With Rice S Surakarta: Agricultural Technology study Program, Faculty of Agricultural. Universitas Sebelas Maret.
- Song, X., Wei Z., Yaqiong P.,Zhilu A. and Junying, C. (2013). Effects of Wheat Bran With Different Colors on The Qualities of Dry N Journal of Cereal Science. 30:1-8.
- Ahmed, I., Ihsan, M.Q., Zhenxing L. and Suraiya, J. (2016). Rice Noodles: Material, Processing and Quality Evaluation. Pakistan Academy of Science. 53 (3): 215-238.
- Ardiansyah, Shirakawa, H., Koseki, T., Ohinata, K., Hashizume, K. And Komai, M. (2006). Rice Bran Fraction Improve Blood Pressure, Lipid Profile, and Glucose Metabolism in Stroke-Prone Spontaneously Hypertensive Rats. Journal of Agriculture and Food Chemistry. 54 (5): 1914-1920.
- Garcia-Lafuentea, A., Carlos, M., Ana, V., Eva, G., Mauricio, A.R., Matilde, D., and Jose, A.M. 2010. Mushrooms as a Source of Anti-Inflammatory Agents. Anti-Inflammatory & Anti-Allergy Agents in Medicinal Chemistry, 9 (2): 125-141.
- Yaovadee, C., H. Duangchan, M. Wanpen and Y. Sompoch, 2010. Quality and quantity of protein in certain kinds of edible mushroom in Thailand. Kasetsart Journal Natural Science, 44: 664-670.
- Archana, V., and Neetu, S. 2016. Optimization of mushroom fortified noodles on their sensory attributes. International Journal of Food Science and Nutrition, 1 (6): 44-45.
- Pratama, I. A. and Nisa, F. C. (2014). Formulations of Dried Noodles with Kimpul Flour Substitutions (Xanhosoma Sagittifolium) and The Addition of Mung Bean Flour (Phaseolus Radiates L.). Journal of Food and Agroindustry, 2 (4):101-112.
- Halwan, C. S. and Nisa, F. C. (2015). Making dried noodles Gembili and bran (the study of the proportion of wheat: Gembili and The Addition of Rice Bran). Journal of Food and Agroindustry. 3 (4):1548-1559.
- Dehlholm, C., Brockhoff, P.B., Meinert, L., Aaslyng, M. D. and Bredie, W.L.P. (2012). Rapid Descriptive Sensory Methods – Comparison of Free Multiple Sorting, Partial Napping, Napping, Flash Profiling and Conventional Profiling. Journal of Food Quality and Preference 26: 267-277.
- (1995). Official Methods of Analysis, 16th ed. Gaithersbug, Maryland: AOAC International.
- Ma, D.Y., Zhang, J., Lou, X.Y., Wang, X.N., Wang, C.Y. and Guo, T.C. (2014). Color, Cooking Properties and Texture of Yellow Alkaline Noodles and Reached Millet and Corn Flour. International Food Research Journal. 21(3): 1187-1192.
- Abdi, H., Williams, L.J. and Valentin, D. (2013). Multiple Factor Analysis: Principal Component Analysis for Multitable and Multiblock Data Sets. WIREs Comput Stat. Willey Periodicals, Inc.
- Lawless, H. T., and Heymann, H. Sensory Evaluation of Food (Principle and Practices) Second Edition. 2010. New York: Springer.
- Ticoalu, G.D., Yuanita., and Maligan, J. M. (2016). Use of Purple Yam (Ipomea Batatas) as An Anthocyanin Drink with The Enzymatic Hydrolysis Process. Journal of Food and Agroindustry. 4(1):46-55.
- (2011). Mengenal Bekatul Lebih Jauh 1000guru (11th Edition). http://majalah1000guru.net/2011/10/mengenal-bekatul-lebih-jauh/ Accessed on 24th of July 2018.
- Ahmed, I., Ihsan, M. Q, Suraiya, J. (2015). Quality Evaluation of Noodles Prepared From Blending of Broken Rice and Wheat Flour. starch-journal.com Starch 67. Accessed on 3rd of August 2018.
- Sukerti, NW., Damiati., Adnyawati. (2013). Pengaruh Modifikasi Tiga Varietas Ubi Jalar dan Terigu Terhadap Kualitas dan Daya Terima Mie Kering. Journal of Science and Technology. 2 (2): 231-237.
- , Bagus, R., Estiasih, T. (2015). Karakteristik Fisikokimia dan Organoleptik Mie Kering Berbasis Tepung Ubi Ungu Pada Berbagai Tingkat Penambahan Gluten. Jurnal Pangan dan Agroindustri. 3 (4): 1386-1392.
- Rauf, R and Sarbini D. 2015. Daya Serap Air Sebagai Acuan Untuk Menentukan Volume Air Dalam Pembuatan Adonan Roti Dari Campuran Tepung Terigu dan Tepung Singkong. Agritech 35 (3): 324-330.
- Mirsaeedghazi, H., Emam-Djomeh, Z and Mousavi, S. M. A. (2008). Rheometric Measurement of Dough Rheological Characteristics and Factors Affecting It. International Journal of Agriculture and Biology 10: 112-119.
- Santoso, A. (2011). Dietary Fiber and Health Benefits. Magistra. 23 (75).
- Bosale, S. and D.Vijayalakshmi. (2015). Processing and Nutritional Composition of Rice Bran. Journal of Current Research in Nutrition and Food Science. 3 (1):74-80.
Accepted on: 12/01/2020
Second Review by: Dr.Renu Khedkar
Final Approval by: Dr. Dan C. Vodnar


Web of Science Coverage
Emerging Sources Citation Index (ESCI)
2024 Journal Impact Factor: 1.1
Scopus Journal Metrics
CiteScore 2025: 2.6
CiteScore Details
Sustainable Nutrition: Food Systems, Nutrient Retention, and Public Health Impact
![]()
This journal is a member of, and subscribes to the principles of, the Committee on Publication Ethics (COPE)


