

Introduction
Eating disorders (ED) rank high among the most prevalent psychiatric problems, adolescent girls are experiencing today, where they develop incorrect attitudes to their body weight and shape, as well as entertain distorted perceptions of body shape.1-3 The core characteristics of EDs include feeding and eating disturbances and a distorted understanding of body image, causing extreme eating and/or purging behaviors that can result in conditions of severe underweight or in some instances overweight. 4 Information from several sources show that the symptoms of eating disorders are a common occurrence among college populations, with eating disorders evident among college-aged students estimated to be in the 8% to 20.5% range.5-7 As young females in particular, are excessively concerned with their body weight and highly sensitive to their appearance, they follow modified diets that can be very harmful to their nutritional status, thus making them more susceptible to eating disordered behaviors, than young males.8, 9
The EDs include a spectrum of conditions like anorexia nervosa (AN), bulimia nervosa (BN) and binge eating disorder (BED), regarded as the third most common chronic health condition affecting adolescent females.10 From an epidemiological study it was obvious that AN and BN together rank as the 12th leading cause of disability adjusted life years (DALYs) in females aged 15–19 years in high-income countries.11 It has been found that eating disorders affect every single body organ. Such patients may contend with more serious cardiovascular problems, infertility, digestive disorders, insomnia, anxiety, depression, suicide, fatigue, pain, and limitations in activities, caused by poor musculoskeletal health. Further, among the psychiatric diseases, eating disorders have the highest mortality rate.12, 13
Among the more serious psychiatric illnesses linked to disordered eating and distorted body images are anorexia nervosa and bulimia nervosa. Each eating disorder has a unique symptom profile and body features. 14, 15 Bulimia nervosa triggers frequent bouts of overeating associated with a fear of weight gain to such a degree that eating is followed by purging spells.16 Binge Eating Disorders reveals features similar to bulimia nervosa with respect to binge eating; however, these patients do not always purge post overeating episodes. Those suffering from established anorexia nervosa are usually dangerously underweight because they believe that they are overweight, which induces them to practice ongoing self-starvation.16 The eating disorders cause hypertension, slow pulse rate, ultimately, starvation-induced death, cardiac arrest, and sometimes even suicide.17
Only a few studies on the prevalence of eating disorders in Saudi Arabia are available.1, 13 It is disturbing to note that a marked number of college-aged students exhibiting the symptoms of EDs have never been diagnosed, nor do they themselves seek treatment. In fact, it appears that the screening and early identification of disordered eating behaviors among college students is an urgent need to provide safe treatment and recovery for those individuals with EDs, either to avoid and/or reduce oral health sequellae.18 The present study aimed at exploring the prevalence of disordered eating attitudes among the women students of the Princess Nourah Bint Abdulrahman University (PNU), in Riyadh, Saudi Arabia.
Methods
A cross-sectional survey was conducted at the PNU (all women university), Riyadh, Saudi Arabia, from November 2018 to January 2019. After verbal consent was acquired, a total of 396 undergraduate students from the PNU volunteered to participate in this survey. To be eligible for participation in the study, the candidates needed to satisfy the following criteria: 18 to 24 years of age and residing in Riyadh. Pregnancy and those individuals with diagnoses of chronic disease were excluded. The study protocol was approved by the Research and Ethics Committee of Princess Nourah Bint Abdulrahman University, Riyadh, Saudi Arabia (SN 18-0366).
The two-part questionnaire required demographic and anthropometric data like age and type of college, weight and height in the first part, while the disordered eating attitudes were assessed in the second part. The Arabic version of the Eating Attitudes Test 26 (EAT-26) used in this study has been validated previously19
The participants wearing light clothing and no shoes were evaluated with respect to weight and height using a digital scale and a portable stadiometer. Body mass index (BMI) was calculated as weight (kg)/height square (m2) and the participants were classified as underweight (BMI<18.5), normal (18.5≤25), overweight (25≤30), and obese (BMI of 30 or more).20
Eating Attitudes Test (EAT-26)
The EAT-26 is a standardized, popularly utilized estimate of self-reported symptoms of eating disorders. In 1982, it was updated and this published version is both reliable and valid.21 It contains 26 items including three sub-scales namely, dieting, bulimia/food preoccupation and oral control.
The EAT scale as mentioned covers 26 items with 3 subscales: dieting, bulimia/food preoccupation, and oral control, whereas the subscale scores were computed by adding up all items assigned to that scale, as follows: dieting (13 items); bulimia/food preoccupation (5 items); oral control (7 items). Each item is provided with a 6-point Likert scale to make the relevant selection. Calculation of the total score of items 1 to 25 is as follows: the scales of “always”, “usually” and “often” were assigned scores of 3, 2, and 1, respectively, while the other three scales (never, rarely and sometimes) were scored zero. Inversely, the scores of “never”, “rarely”, and “sometimes” in question 26 (enjoy trying new rich foods) were attributed scores of 3, 2, and 1, respectively, while the three other scales were scored zero. The total score was in the 0-78 range. A total score of 20 or more on questions 1-26 was classified as being at risk of eating disorders.
Statistical Analysis
The data were submitted to statistical analysis employing Microsoft Excel 2013 (Microsoft Corporation; Seattle, Washington, USA) and the Statistical Package for Social Sciences (version 22, SPSS Inc., Chicago, Illinois, USA). Descriptive statistics were presented as means, frequencies, and percentages. The t-test was performed to evaluate the age and BMI differences in the EAT-26 mean scores. The mean EAT-26 differences of different age and BMI groups were analyzed using the one-way analysis of variance (one-way ANOVA). The Tukey post hoc analysis was done to determine the statistical significance among the different BMIs and different age groups and a p value of < 0.05 was considered statistically significant.
Results
Table 1 lists the characteristics of the participants of the study group. The majority fell in the category of 19 years (24.6%). This study revealed that 58.6% of the participants came under the normal category (BMI 18.5-25), while 10.7% were included in the underweight category, and 20.8% of the participants were in the overweight class (BMI >25-29.9) leaving 9.9% in the obese category (BMI ≥ 30).
Table 2 shows the results of the participants who completed a questionnaire and expressed their experiences with the EAT score. Their statements regarding dieting and the impulse to vomit after meals revealed a higher mean score (2.08 ± 1.14), followed by terrified about being overweight (1.58 ± 1.2) and burning up calories during exercise 1.09 ± 1.22. With respect to the scale items of bulimia and food preoccupation, preoccupied with food displayed higher means (0.83 ± 1.08) followed by food controls life (0.74 ± 1.14). For the oral control subscale items, avoid eating when hungry, the findings revealed higher means of 3.00 ± 0.70 followed by taking longer than others to eat meals 1.09 ± 0.69.
Table 3 lists age wise and BMI wise the differences in the EAT-26 score (dieting). No difference on the EAT score was noted for age. However, with respect to the BMI, marked differences were observed on the items feeling extremely guilty after eating, occupied with a desire to be thinner, burning up calories during exercise, preoccupied with the thought of having fat on my body, eating diet food, feeling uncomfortable after eating sweets and engaging in dieting behavior and having gone on eating binges where I feel I may not be able to stop.
Table 1: Sociodemographic characteristics of the study population
| Variable | Frequency | % | Mean |
| Age | |||
| 18 yrs. | 55 | 14.0 | 20.1 ± 1.55 |
| 19 yrs. | 97 | 24.6 | |
| 20 yrs. | 92 | 23.4 | |
| 21 yrs. | 69 | 17.5 | |
| 22 yrs. | 45 | 11.4 | |
| 23 yrs. | 25 | 6.3 | |
| 24 yrs. | 11 | 2.8 | |
| Age groups | |||
| ≤ 20 Years | 244 | 61.9 | |
| >20 Years | 150 | 38.1 | |
| Height (m) 1.57 ± 0.05 | |||
| Weight (kg) 57.5 ± 12.1 | |||
| Body Mass Index (Kg/m2) | |||
| < 18.5 | 42 | 10.7 | 23.2 ±4.48 |
| 18.5-25 | 231 | 58.6 | |
| >25-29.9 | 82 | 20.8 | |
| ≥ 30 | 39 | 9.9 | |
| Total | 394 | 100 | |
Table 2: Mean score of EAT-26 subdomain
| EAT questions | Dieting scale | Mean ± SD |
| 1 | I am terrified about being overweight. | 1.58 ± 1.2 |
| 6 | I aware of the calorie content of foods that I eat. | 0.29 ± 0.71 |
| 7 | I particularly avoid food with a high carbohydrate content | 0.20 ± 0.59 |
| 10 | I feel extremely guilty after eating. | 0.60 ± 1.04 |
| 11 | I am occupied with a desire to be thinner. | 0.81 ± 1.16 |
| 12 | I think about burning up calories when I exercise. | 1.09 ± 1.22 |
| 14 | I am preoccupied with the thought of having fat on my body. | 0.96 ± 1.17 |
| 16 | I avoid foods with sugar in them. | 0.34 ± 0.76 |
| 17 | I eat diet foods. | 0.32 ± 0.71 |
| 22 | I feel uncomfortable after eating sweets. | 0.68 ± 1.07 |
| 23 | I engage in dieting behavior. | 0.26 ± 0.66 |
| 24 | I like my stomach to be empty. | 0.45 ± 0.87 |
| 26 | I have the impulse to vomit after meals. | 2.08 ± 1.14 |
| Bulimia & food preoccupation scale items | Mean ± SD | |
| 3 | I find myself preoccupied with food. | 0.83 ± 1.08 |
| 4 | I have gone on eating binges where I feel that I may not be able to stop. | 0.52 ± 0.92 |
| 9 | I vomit after I have eaten. | 0.09 ± 0.42 |
| 18 | I feel that food controls my life. | 0.74 ± 1.14 |
| 21 | I give too much time and thought to food. | 0.63 ± 1.02 |
| 25 | I enjoy trying new rich foods. | 0.18 ± 0.60 |
| Oral control subscale items | Mean ± SD | |
| 2 | I avoid eating when I am hungry. | 3.00 ± 0.70 |
| 5 | I cut my food into small pieces. | 0.30 ± 1.09 |
| 8 | I feel that others would prefer if I ate more. | 0.77 ± 1.19 |
| 13 | Other people think that I am too thin. | 0.97 ± 1.25 |
| 15 | I take longer than others to eat my meals. | 1.09 ± 0.69 |
| 19 | I display self-control around food. | 0.55 ± 1.12 |
| 20 | I feel that others pressure me to eat. | 0.86 ± 1.05 |
Table 3: Age and BMI wise the differences in the EAT-26 score (dieting).
| Variables | Groups | Dieting scale (Responses) | ||||||
| Q 1 | Q 6 | Q 7 | Q 10 | Q 11 | Q 12 | Q 14 | ||
| Age | ≤ 20 yrs | 1.61 ± 1.3 | 0.29 ± 0.73 | 0.20 ± 0.62 | 0.65 ± 1.1 | 0.79 ± 1.16 | 1.11 ± 1.24 | 0.95 ± 1.20 |
| > 20 yrs. | 1.53 ± 1.28 | 0.29 ± 0.66 | 0.19 ± 0.56 | 0.53 ± 0.95 | 0.83 ± 1.17 | 1.05 ± 1.20 | 0.97 ± 1.13 | |
| BMI | < 18.5 | 0.57 ± 1.12 | 0.17 ± 0.58 | 0.05 ± 0.30 | 0.05 ± 0.21 | 0.10 ± 0.43 | 0.26 ± 0.66 | 0.38 ± 0.79 |
| 18.5-24.9 | 1.52 ± 1.29 * | 0.27 ± 0.69 | 0.19 ± 0.58 | 0.47 ± 0.95 | 0.60 ±1.03* | 1.01 ± 1.19 * | 0.80 ± 1.12 | |
| 25-29.9 | 2.22 ± 1.05 #, ‡ | 0.41 ± 0.83 | 0.35 ± 0.77 # | 1.06 ± 1.27#,‡ | 1.54 ±1.29 #,‡ | 1.68 ± 1.26 #,‡ | 1.54 ± 1.19 #,‡ | |
| ≥ 30 | 1.72 ±1.21 † | 0.26 ± 0.63 | 0.10 ± 0.44 | 1.05 ± 1.09 † ƒ | 1.28 ±1.25 †,ƒ | 1.23 ± 1.20 † | 1.31 ± 1.23 †, ƒ | |
| Variables | Groups | Dieting scale (Responses) | ||||||
| Q 16 | Q 17 | Q 22 | Q 23 | Q 24 | Q 26 | Total | ||
| Age | ≤ 20 yrs | 0.34 ± 0.77 | 0.31 ± 0.71 | 0.74 ± 1.11 | 0.23 ± 0.65 | 0.44 ± 0.88 | 2.13 ± 1.11 | 9.80 ± 6.45 |
| > 20 yrs. | 0.35 ± 0.76 | 0.35 ± 0.72 | 0.59 ± 0.99 | 0.31 ± 0.68 | 0.47 ± 0.85 | 2.01 ± 1.20 | 9.47 ± 5.79 | |
| BMI | < 18.5 | 0.26 ± 0.62 | 0.05 ± 0.30 | 0.33 ± 0.81 | 0.05 ± 0.21 | 0.26 ± 0.70 | 2.74 ± 0.701 | 5.26 ± 2.62 |
| 18.5-24.9 | 0.32 ± 0.75 | 0.27 ± 0.67 | 0.63 ± 1.04 | 0.23 ± 0.64 | 0.42 ± 0.85 | 2.16 ± 1.11* | 8.87 ± 5.97 * | |
| 25-29.9 | 0.52 ± 0.90 | 0.65 ± 0.92 # | 0.95 ± 1.18 | 0.51 ± 0.89 # | 0.49 ± 0.92 | 1.66 ± 1.26 #,‡ | 13.59 ± 6.33 #, ‡ | |
| ≥ 30 | 0.18 ± 0.60 | 0.26 ±. 059 ¶ | 0.77 ± 1.11 | 0.15 ± 0.432 ¶ | 0.77 ± 1.03 † | 1.85 ± 1.08 † | 10.92 ± 5.38 † | |
Q: EAT-26 questions.
Age groups compared by independent t-test.
BMI Groups compared by One way ANOVA followed by Tukey post hoc test,
* Underweight vs Normal, # Underweight vs Overweight, † Underweight vs Obese, ‡ Normal vs Overweight, ƒ Normal vs Obese, ¶ Overweight vs Obese. *, #, †, ‡, ƒ, ¶, p<0.05 considered as significant.
Underweight (< 18.5), Normal (18.5-24.9), Overweight (25-29.9), Obese (≥ 30)
Table 4: Age and BMI wise the differences in the EAT-26 score (bulimia/food preoccupation scale items and oral control).
| Variables | Groups | Bulimia & food preoccupation scale items (Responses) | |||||||||||||
| Q 3 | Q 4 | Q 9 | Q 18 | Q 21 | Q 25 | Total | |||||||||
| Age | ≤ 20 yrs | 9.80 ± 6.4 | 0.86 ± 1.1 | 0.60 ± 0.96 | 0.07 ± 0.36 | 0.74 ± 1.15 | 0.65 ± 1.04 | 0.21 ± 0.66 | |||||||
| > 20 yrs. | 9.47 ± 5.7 | 0.77 ± 1.04 | 0.39 ± 0.85 | 0.13 ± 0.51 | 0.75 ± 1.13 | 0.61 ± 0.98 | 0.13 ± 0.48 | ||||||||
| BMI | < 18.5 | 0.79 ± 1.04 | 0.29 ± 0.74 | 0.02 ± 0.15 | 0.36 ± 0.87 | 0.43 ± 0.96 | 0.14 ± 0.47 | 2.02 ± 2.51 | |||||||
| 18.5-24.9 | 0.72 ± 1.06 | 0.41 ± 0.82 | 0.09 ± 0.40 | 0.75 ± 1.17 | 0.65 ± 1.02 | 0.16 ± 0.59 | 2.78 ± 2.98 | ||||||||
| 25-29.9 | 1.00 ± 1.11 | 0.83 ± 1.07 ‡ | 0.17 ± 0.58 | 0.90 ± 1.14 | 0.72 ± 1.03 | 0.28 ± 0.74 | 3.90 ± 3.18 #, ‡ | ||||||||
| ≥ 30 | 1.13 ± 1.12 | 0.79 ± 1.15 | 0.05 ± 0.32 | 0.77 ± 1.15 | 0.62 ± 1.04 | 0.13 ± 0.46 | 3.49 ± 3.59 | ||||||||
| Variables | Groups | Oral control subscale items (Responses) | |||||||||||||
| Q 2 | Q 5 | Q 8 | Q 13 | Q 15 | Q 19 | Q 20 | Total | ||||||||
| Age | ≤ 20 yrs | 0.27 ± 0.66 | 0.77 ± 1.09 | 1.02 ± 1.23 | 1.06 ± 1.24 | 0.55 ± 0.68 | 0.90 ± 1.14 | 0.69 ± 1.10 | 0.69 ± 3.96 | ||||||
| > 20 yrs. | 0.34 ± 0.77 | 0.76 ± 1.09 | 0.89 ±1.13 | 1.14 ± 1.26 | 0.55 ± 0.70 | 0.79 ± 1.08 | 0.79 ± 0.95 | 0.54 ± 3.72 | |||||||
| BMI | < 18.5 | 0.29 ± 0.77 | 0.71 ± 0.99 | 1.57 ± 1.29 | 2.29 ± 1.13 | 0.50 ± 0.70 | 0.76 ± 1.16 | 1.24 ± 1.34 | 7.36 ± 4.15 | ||||||
| 18.5-24.9 | 0.24 ± 0.62 | 0.77 ± 1.10 | 1.09 ± 1.21 | 1.21 ± 1.24 * | 0.57 ± 0.69 | 0.95 ± 1.17 | 0.62 ± 1.02 * | 5.45 ± 3.85 * | |||||||
| 25-29.9 | 0.41 ± 0.84 | 0.80 ± 1.17 | 0.63 ± 1.06 #, † | 0.51 ± 0.89 #, ‡ | 0.54 ± 0.65 | 0.72 ± 0.99 | 0.51 ± 0.99 # | 4.13 ± 3.38 #, ‡ | |||||||
| ≥ 30 | 0.41 ± 0.78 | 0.69 ± 0.97 | 0.33 ± 0.73 ƒ | 0.28 ± 0.79 †, ƒ | 0.51 ± 0.75 | 0.74 ± 0.93 | 0.33 ± 0.73 † | 3.31 ± 3.22 †, ƒ | |||||||
Q: EAT-26 questions.
Age groups compared by independent t-test.
BMI Groups compared by One way ANOVA followed by Tukey post hoc test,
* Underweight vs Normal, # Underweight vs Overweight, † Underweight vs Obese, ‡ Normal vs Overweight, ƒ Normal vs Obese, ¶ Overweight vs Obese. *, #, †, ‡, ƒ, ¶, p<0.05 considered as significant.
Underweight (< 18.5), Normal (18.5-24.9), Overweight (25-29.9), Obese (≥ 30)
Table 4 lists age wise and BMI wise the differences in the EAT-26 score (bulimia/food preoccupation scale items and oral control). No difference on the EAT score was noted for age. However, with respect to the BMI notable differences were seen for the items, feel that others would prefer if I ate more and other people think that I am too thin. In comparison to students with normal weight, the students who were underweight, overweight, and obese showed noteworthy differences in the total EAT score.
Figure 1 shows the distribution of the study population according to their EAT response. A total of 145 (36.8%) participants achieved a score of greater than 20 on the EAT scale.
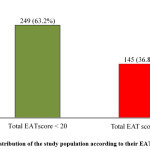 |
Figure 1: Distribution of the study population according to their EAT responses Click here to View figure |
Discussion
The adolescent period is considered a window of vulnerability to acquire eating disorders, as this is the time when concerns about body image increase. Females in particular become intensely conscious about their body image and nurture a strong craving to be thin. They adopt unsuitable methods to lose weight, which ultimately leads them to experience eating disorders. The present study aimed at studying the occurrence of eating disorders among the female university students in Riyadh, Saudi Arabia. The most significant outcome of this study was the fact that 36.8% of the students fell under the category of high level of concern for an ED, scoring 20 or more on the EAT-26; this result concurs with the findings from recent studies, for instance 37.6% and 36.4% in Bangladesh and Oman, respectively. 22, 23 Research done in Jordan revealed that 45.2% of female college students needed screening for EDs. 24 The United Arab Emirates reported a 20% prevalence rate among the female students from two other universities in Abu Dhabi and Sharjah. 25 The current study shows a slightly lower prevalence than that reported by a study done in Saudi Arabia in 2015, in which 32.9% of the female students achieved scores above the cutoff level of 20, employing the same assessment tool. In another study done on 314 adolescent females (15-19 years of age) from four schools in Arar city, Saudi Arabia, 25.47% of the participants were reported to be in the class of high level of concern for an ED. 1 A recent study from Dammam, Saudi Arabia too revealed that less than our results, 29.4% of preparatory-year Saudi females were classified as high level of concern for an ED. 26 However, arriving at a definite explanation for the differences in the prevalence rates of ED among young women residing in Saudi Arabia or the Middle East poses greater difficulty because of the insufficient research studies on the epidemiology of EDs being done here. From a cultural perspective, Miller et al., states that the ED prevalence rates will certainly show variations across different races and ethnicities and will change over time in response to the way the national culture develops. Research conducted on the ethnic differences in eating disorder symptoms and prevalence has produced only conflicting conclusions. Some studies record that specific ethnic groups register a higher prevalence of a particular symptom; others report that members of that specific ethnic group show a lower prevalence of the same symptom. 27 However, it is noteworthy here that from a clinical viewpoint, the EDs act as a crucial cause for the morbidity and mortality in adolescent girls and young adult women due to drastic alterations they adopt in their eating behaviors. 28, 29
Obesity is very common in the Middle East and several Arab countries, including Saudi Arabia. 30 Given that obesity is one of the prime driving forces for disordered eating attitudes, it is not a surprise that EDs are on the rise in the Arab populations, including those of Saudi Arabia. 28, 30-32 In the present work the mean BMI of the study population was found to be 23.2, which exceeds the reports given by Szweda and Thorne (22.0). Besides, the respective BMIs of ≥ 25.0 (overweight) and > 30.0 (obese) reported in 20.8% and 9.9% of the participants in this study were higher than the reported 10% and 1% of the female university students in India. One study conducted on students in Thailand also registered lower rates for the underweight and overweight classes, of 5% and 2%, respectively. 33 However, in the present study, the rates were markedly less than the reported rate of 35% for overweight or obese among university students in the United States, while a study done prior in Saudi Arabia recorded 31% of the subjects to be overweight and 27% underweight. 34 It was significant, that in this study, 58.6% of the participants were identified as being in the normal category (BMI 18.5-25). This study also noted that with respect to the EAT score among the BMI categories there were important differences in the items, (a) feeling extremely guilty after eating, (b) occupied with a desire to be thinner, (c) burning up calories during exercise, (d) preoccupied with the thought of having fat on my body, (e) eating diet food, (f) feeling uncomfortable after eating sweets and engaging in dieting behavior, (g) having gone on eating binges where I feel I may not being able to stop, (h) feeling that others would prefer if I ate more food and other people think I am too thin. Besides, in comparison to normal weight students, students who were underweight, overweight, and obese exhibited considerable disparities in the total EAT score. The findings from the present study indicate that the BMI together with the concerns about body shape might be a more effective screening tool for the detection of eating disorders among the female students in the Saudi context.
Limitations
Although the current investigation was characterized by some limitations such as having only one study center and limited independent variables they can be overcome by performing this study on a larger scale; despite the limitations cited, the present study offers valuable data regarding the eating disorders prevalent in the young female student population in Saudi Arabia. However, more studies are essential to verify the current findings.
Conclusion and research recommendation
In conclusion, the study found that more than one third (36.6%) of females at PNU university, Saudi Arabia had disordered eating attitudes. Also, this study highlighted that women university students require greater awareness with respect to proper nutrition in relation to body weight. Prevention programs that facilitate reducing the development and influence that these disorders exert on the students need to be executed and evaluated.
Acknowledgement
We are grateful to the Princess Nourah Bint Abdulrahman University, Riyadh, Saudi Arabia for the encouragement and providing facilities to carrying out the study.
Ethical Approval
The study protocol was approved by the Research and Ethics Committee of Princess Nourah Bint Abdulrahman University, Riyadh, Saudi Arabia (SN 18-0366).
Funding
This research was funded by the Deanship of Scientific Research at Princess Nourah Bint Abdulrahman University through the Fast-track Research Funding Program.
Conflict of Interest
The authors do not have any conflict of interest.
References
- Fatima W, Ahmad LM. Prevalence of disordered eating attitudes among adolescent girls in Arar City, Kingdom of Saudi Arabia. Health Psychol Res 2018;6(1):7444.
- Arcelus J, Mitchell AJ, Wales J, Nielsen S. Mortality rates in patients with anorexia nervosa and other eating disorders. A meta-analysis of 36 studies. Arch Gen Psychiatry 2011;68(7):724-31.
- Fitzsimmons-Craft EE, Karam AM, Monterubio GE, Taylor CB, Wilfley DE.Screening for Eating Disorders on College Campuses: a Review of the Recent Literature. Curr Psychiatry Rep. 2019;21(10):101.
- Maguire S, Li A. Evaluating the effectiveness of an evidence-based online training program for health professionals in eating disorders. J Eat Disord 2019;7:14. doi: 10.1186/s40337-019-0243-5. eCollection 2019.
- Nivedita N, Sreenivasa G, Sathyanarayana Rao TS, Malini SS. Eating disorders: Prevalence in the student population of Mysore, South India. Indian J Psychiatry 2018;60(4):433-37.
- Eisenberg D, Nicklett EJ, Roeder K, Kirz NE. Eating disorder symptoms among college students: prevalence, persistence, correlates, and treatment-seeking. J Am Coll Health 2011;59(8):700-7.
- Tavolacci MP, Grigioni S, Richard L, et al. Eating Disorders and Associated Health Risks Among University Students. J Nutr Educ Behav 2015;47(5):412-20.e1.
- Costa C, Ramos E, Severo M, Barros H, Lopes C. Determinants of eating disorders symptomatology in Portuguese adolescents. Arch Pediatr Adolesc Med 2008;162(12):1126-32.
- Lipson SK, Sonneville KR. Eating disorder symptoms among undergraduate and graduate students at 12 U.S. colleges and universities. Eat Behav 2017;24:81-88.
- Chang WW, Nie M, Kang YW, et al. Subclinical eating disorders in female medical students in Anhui, China: a cross-sectional study. Nutr Hosp 2015;31(4):1771-7.
- Frimenko KM, Murdoch-Kinch CA, Inglehart MR. Educating Dental Students About Eating Disorders: Perceptions and Practice of Interprofessional Care. J Dent Educ 2017;81(11):1327-37.
- Smink FR, van Hoeken D, Hoek HW. Epidemiology of eating disorders: incidence, prevalence and mortality rates. Curr Psychiatry Rep 2012;14(4):406-14.
- Abd El-Azeem Taha AA, Abu-Zaid HA, El-Sayed Desouky D. Eating Disorders Among Female Students of Taif University, Saudi Arabia. Arch Iran Med 2018;21(3):111-17.
- Westmoreland P, Krantz MJ, Mehler PS. Medical Complications of Anorexia Nervosa and Bulimia. Am J Med 2016;129(1):30-7.
- Neyland MKH, Bardone-Cone AM. Treatment experiences of Latinas with current or past binge eating disorder and/or bulimia nervosa. Eat Disord 2019;27(2):253-65.
- Herpertz-Dahlmann B. Adolescent eating disorders: definitions, symptomatology, epidemiology and comorbidity. Child Adolesc Psychiatr Clin N Am 2009;18(1):31-47.
- Cooper R. Could your patient have an eating disorder? Nurs Womens Health 2013;17(4):317-24.
- Yu Z, Tan M. Disordered Eating Behaviors and Food Addiction among Nutrition Major College Students. Nutrients 2016;8(11).
- al-Subaie A, al-Shammari S, Bamgboye E, et al. Validity of the Arabic version of the Eating Attitude Test. Int J Eat Disord 1996;20(3):321-4.
- World Health Organization. Global Database on Body Mass Index, BMI Classification. (Last accessed on 2019 November]. Available from: http://www.apps.who.int/bmi/index. jsp?introPage=intro_3.html.
- Gleaves DH, Pearson CA, Ambwani S, Morey LC. Measuring eating disorder attitudes and behaviors: a reliability generalization study. J Eat Disord 2014;2:6.
- Pengpid S, Peltzer K, Ahsan GU. Risk of eating disorders among university students in Bangladesh. Int J Adolesc Med Health 2015;27(1):93-100.
- Al-Adawi S, Dorvlo AS, Burke DT, et al. Presence and severity of anorexia and bulimia among male and female Omani and non-Omani adolescents. J Am Acad Child Adolesc Psychiatry 2002;41(9):1124-30.
- Madanat HN, Lindsay R, Campbell T. Young urban women and the nutrition transition in Jordan. Public Health Nutr 2011;14(4):599-604.
- Schulte SJ, Thomas J. Relationship between eating pathology, body dissatisfaction and depressive symptoms among male and female adolescents in the United Arab Emirates. Eat Behav 2013;14(2):157-60.
- Alwosaifer AM, Alawadh SA, Abdel Wahab MM, Boubshait LA, Almutairi BA. Eating disorders and associated risk factors among Imam Abdulrahman bin Faisal university preparatory year female students in Kingdom of Saudi Arabia. Saudi Med J 2018;39(9):910-21.
- Arriaza CA, Mann T. Ethnic differences in eating disorder symptoms among college students: the confounding role of body mass index. J Am Coll Health 2001;49(6):309-15.
- Saleh RN, Salameh RA, Yhya HH, Sweileh WM. Disordered eating attitudes in female students of An-Najah National University: a cross-sectional study. J Eat Disord 2018;6:16.
- Erskine HE, Whiteford HA, Pike KM. The global burden of eating disorders. Curr Opin Psychiatry 2016;29(6):346-53.
- DeNicola E, Aburizaiza OS, Siddique A, Khwaja H, Carpenter DO. Obesity and public health in the Kingdom of Saudi Arabia. Rev Environ Health 2015;30(3):191-205.
- Yusuf S, Hawken S, Ounpuu S, et al. Obesity and the risk of myocardial infarction in 27,000 participants from 52 countries: a case-control study. Lancet 2005;366(9497):1640-9.
- Calzo JP, Sonneville KR, Haines J, et al. The development of associations among body mass index, body dissatisfaction, and weight and shape concern in adolescent boys and girls. J Adolesc Health 2012;51(5):517-23.
- Osaka R, Nanakorn S, Sanseeha L, Nagahiro C, Kodama N. Healthy dietary habits, body mass index, and predictors among nursing students, northeast Thailand. Southeast Asian J Trop Med Public Health 1999;30(1):115-21.
- Rasheed P. Overweight status: Body image and weight control beliefs and practices among female college students. Ann Saudi Med 1999;19(4):365-9.

This work is licensed under a Creative Commons Attribution 4.0 International License.