
Introduction
Celiac disease is considered as chronic gut disorder that can happen in genetically predisposed people where the consumption of gluten in diet can damage the lining of the small intestine. It is encouraged by a protein known as “gluten” existing in cereals such as wheat, barley, rye etc. It disturbs approximately one per cent of persons in the world and dependence on gluten-free diet throughout life is the single available treatment.1
Main symptoms of this disease comprise prolonged abdominal discomfort, diarrhoea, headache, growth impediment in children, prolonged fatigue, dermatitis herpetiformis, decreased fertility, osteoporosis, nerve and brain disorders and threat of intestinal cancer.2 Several serological tests and bowel biopsy are main tools for clinical identification of this disease.3 The only available harmless and effective management for this disease is to ingest gluten-free foods throughout the entire life.4
Most of gluten-free products available in market are using starch or refined gluten-free flour, so these products remained only the rich sources of carbohydrates and fat if not fortified with essential nutrients.5 Absence of gluten in processed products provides weak structure leading to mechanical and organoleptic challenges during preparation of these products.6 A huge number of starches, flours and other constituents (hydrocolloids, proteins, enzymes etc.) are used to improve viscoelastic properties analogous to that of gluten, for enhancement of sensory and structural features and improving the nutritional composition of gluten-free food products.7
Millets are distinctive among the cereals because of their abundance in calcium, dietary fiber, polyphenol and protein.8 Millets are gluten-free and are therefore an exceptional option for people suffering from celiac diseases often irritated by the gluten content of wheat and cereal grains containing gluten.9 Pearl millet have a great potential as food for humans since they are gluten-free, have higher amount of dietary fiber content, similar in lipid content to maize and have higher amount of essential amino acids (isoleucine, leucine and lysine) than other traditional cereals, such as rye and wheat.10 Finger millet is a good sources of dietary fiber (including resistant starch), minerals and trace elements (especially calcium, potassium, iron and phosphorous) as compared to commonly used cereals such as wheat and rice.11 Soya bean is an inexpensive source of macronutrients and can be used in managing protein-energy malnutrition among children and to improve the nutritional status of the different sections of population in developing countries.12
Some of the nutritious gluten-free grains including cereals (rice, corn), millets (finger millet, pearl millet, kodo millet and foxtail millet) pseudo-cereals (quinoa, buckwheat and amaranth), nuts (groundnut, coconut etc.) and pulses (pea, soyabean, Bengal gram, chickpea etc.) can be utilized for preparation of gluten free functional foods. Processes for preparation of gluten free products such as cookies, pasta etc. has already been optimised by several workers.13-16
Keeping in view the numerous nutritional health benefits of gluten free ingredients such as pearl millet, soya bean, finger millet and groundnut, present investigation was undertaken for the development and nutritional evaluation of multigrain gluten free cookies and pasta.
Material and Methods
Materials
Gluten free ingredient such as pearl millet, finger millet, soy bean and wheat (control) etc. were procured from experimental farms of Eternal University, Baru Sahib. Other ingredients such as hydrogenated vegetable oil, crystal sugar, NaCl (food grade), groundnut seeds and baking powder of standard manufacturers were procured from local market.
Methods
Physico-Chemical Evaluation of Raw Ingredients
Physical parameters of grains such as 1000 grains weight was determined as per method specified by AACC.17 Bulk density was determined as per the method described by Huang, Shiau.18 Tap density was determined as per the method described by Jones, Chinnaswamy.19 Water absorption capacity (WAC) was determined using the centrifuge method of Sosulski20 and water solubility index (WSI) was determined using the supernatant obtained during WAC estimation as per the method of Stojceska, Ainsworth.21 Raw ingredients were subjected to chemical analysis using standard protocols. The samples were analyzed for moisture content by air-oven drying method.22 Crude fibre by Fibroplus (Pelican), Crude fat using Soxoplus (Pelican), crude proteins using Kjeloplus (Pelican) and ash contents (%) were determined as per methods described by Ranganna.23 Total carbohydrate content of the samples was determined as total carbohydrate by difference, calculated by subtracting the measured crude protein, crude fat, ash, crude fibre and moisture from 100.
Calorific Value
It was estimated based on the contents of crude protein (N × 6.25), fats and carbohydrates using the Atwater factors (energy conversion factors) of 4.0, 9.10 and 4.2 K Cal/g of each component, respectively.24
Colour Measurement
The color of raw ingredients was determined using Lovibond Tintometer (model F). Scale of Lovibond® tintometer is based on calibrated glass colour standards of variable densities of yellow, magenta (red), blue and neutral, progressing from desaturated to fully saturate resulting in a set of Lovibond® RYBN units that define the colour.
Preparation of Gluten Free Cookies
Various formulations (Table 1) were prepared for making cookies by incorporating flour of pearl millet (PM), finger millet (FM), groundnut (GN) and soya bean (SB). Grains were converted to fine flour in a lab scale flour mill (SANCO) and sieved through 60- mesh sieve. Cookies prepared from whole wheat flour were used as control for comparison of nutritional and organoleptic characteristics. The ingredients used for the preparation of gluten free cookies (GFC) includes wheat flour/ blend of pearl millet, finger millet soya bean, groundnut (100g), sugar (50g), fat (40g), skimmed milk powder (SMP) (1g), water (10-15 ml), glucose (1g), sodium bicarbonate (1g), and ammonium bicarbonate (1g).
Sugar was converted to a fine powder in a grinder (Maharaja Whiteline) and sieved through 60- mesh sieve. The powdered sugar, fat and vanillin were mixed for 2-3 min. This mixture was then added to the pre-mixed blend of pearl millet, finger millet, soya bean, groundnut flour, glucose, sodium bicarbonate and ammonium bicarbonate. SMP was dissolved in water and was used for dough making. Prepared dough was sheeted on stainless steel platform using a wooden rolling pin to obtain a uniform thickness of 2.5 mm. Sheet was cut into circular pieces of 48 mm diameter with round cutter and 40 pieces were equally distributed on baking tray. Tray was then loaded in baking oven (SANCO) for baking at 205°C for 7-8 min. Cookies so obtained were cooled to room temperature and packed in polypropylene pouches (100 gauge) and heat sealed (Fig. 1).
Preparation of Gluten Free Pasta
Different formulations of pearl millet, finger millet and soya bean flour were prepared by incorporating them in different proportions (Table 2). Dry mixing of pearl millet, finger millet, soya bean flour and salt was done to prepare a homogeneous mixture. Dough was then prepared with water and was allowed to rest for 1 h. Pasta was prepared in noodle/pasta making machine (SANCO). Prepared pasta was subjected to steaming for 5 min and dried in hot air oven at 50°C.
To study the effect of frying, a part of steamed pasta was fried in refined soya bean oil for 30 sec. It was then cooled and packed in polypropylene pouched and heat sealed (Fig. 2).
Evaluation of Gluten Free Products
Average Diameter (D) and Thickness (T) of cookies were measured with the help of vernier caliper. Spread ratio was then determined by dividing the diameter with thickness (D/T) as per the method of.17 Same protocols were utilized for chemical evaluation as well as calorific value of products as that utilized for raw ingredients.
Organoleptic Evaluation
The organoleptic evaluation of products prepared by different formulations was conducted by a semi-trained panel (a panel consisting of people capable of discriminating differences and communicating their reactions, though they may not have been formally trained) for appearance, aroma, colour, texture and taste by a semi trained panel of 15 people. The judges scored quality characteristics as per 9-point hedonic rating scale.23 For evaluation of pasta products, 100 g pasta was cooked for 18 min in 1 L unsalted water and drained. Sensory tests were applied after 10 min of draining. The sensory test of the pasta was also performed with a semi-trained panel of 15 people.
Statistical Analysis
Statistical analysis using one way analysis of variance (ANOVA) was done to assess data using SPSS 16.0 software. Values were expressed as ± Standard Deviation and differences were considered significant at level of p ≤ 0.05.
Table 1: Ingredients used in different formulations for preparation of gluten free cookies.
| Ingredients (g) | Formulations | |||
| C0 | C1 | C2 | C3 | |
| Finger millet | – | 25 | 15 | 35 |
| Pearl millet | – | 25 | 35 | 15 |
| Soya bean | – | 25 | 25 | 25 |
| Ground nut | – | 25 | 25 | 25 |
| Wheat flour | 100 | – | – | – |
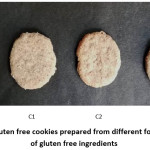 |
Figure 1: Gluten free cookies prepared from different formulations of gluten free ingredients. Click here to View figure |
C0 (100% WF); C1(25% FM + 25% PM + 25% SB + 25% GN); C2(15%FM + 35% PM + 25% SB + 25 % GN); C3 (35 % FM + 15% PM + 25 % SB + 25% GN) C0-Control, WF-Wheat flour, FM-Finger millet, PM-Pearl millet, SB-Soyabean, GN-Groundnut
Table 2: Ingredients used in different formulation for preparation of gluten free pasta.
| Ingredients (g) | Formulations | |||
| PS0 | PS1 | PS2 | PS3 | |
| Pearl millet | – | 30 | 45 | 20 |
| Finger millet | – | 35 | 20 | 45 |
| Soya bean | – | 35 | 35 | 35 |
| Wheat flour | 100 | – | – | – |
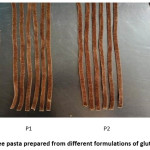 |
Figure 2: Gluten free pasta prepared from different formulations of gluten free ingredients. Click here to View figure |
PS0 (100% WF); PS1 (25% FM + 25% PM + 25% SB + 25% GN); PS2 (15%FM + 35% PM + 25% SB + 25 % GN); PS3 (35 % FM + 15% PM + 25 % SB + 25% GN). PS0-Control, WF-Wheat flour, FM-Finger millet, PM-Pearl millet, SB-Soyabean, GN-Groundnut
Results and Discussions
Raw ingredients as well as processed products were subjected to physico-chemical and organoleptic evaluation. The results obtained are presented under the following subheadings.
Physico-Chemical Characteristics of Raw Ingredients
Physical Characteristics
Data pertaining to Physical parameters of raw ingredients is presented in Table 3. Data shows that thousand grain weights varied significantly (P≤0.05) from 3.19g to 541.48g. Values were lowest for finger millet (3.19 g) and highest for groundnut (541.48g).
There was significant difference in bulk density and tap density of different raw ingredients and it varied from 58.83 to 79.17 g/ml and 60.53 to 88.37g/ml, respectively. Values for bulk density and tap density were lowest for pearl millet (58.83 and 60.53g/ml) and highest for groundnut (79.17 and 88.37g/ml).
Water Absorption Capacity (WAC) of different raw ingredients ranged from 1.35 ml/g (wheat) to 3.07ml/g (SB). Values for Water Solubility Index (WSI) ranged from 0.07 g/ml (FM) to 0.78 g/ml (GN).
Chemical Characteristics
The chemical composition of raw ingredients is presented in Table 3. Moisture content of raw ingredients varied significantly between 9.30 and 11.60%. Wheat (11.60%) has highest value whereas groundnut (9.30 %) had lowest moisture content. There was significant difference in crude fat contents of raw ingredients and values ranged from 1.90 to 34.89%. It was highest for groundnut (34.89%) and the lowest in wheat (1.90%).
Raw ingredients contained crude fibre content ranging from 1.73 to 4.73%. Values were finger millet contained highest content (4.73%) and it was lowest for wheat (1.73%). Crude protein contents in raw ingredients varied significantly and were reported between 11.03% (wheat) to 35.30% (soya bean). Also, the values for ash contents varied significantly from 1.80 to 5.76%. The values were highest for soya bean (5.76%) and lowest for wheat (1.80%). Carbohydrates ranged from 23.06% (groundnut) to 71.90% (wheat). Calorific values of raw ingredients varied from 352.09 to 519.37 Kcal/100 g. The values were highest for soya bean (519.37 Kcal/100 g) and lowest for wheat (352.09 Kcal/100 g).
Table 3: Physico-chemical and optical characteristics of raw ingredients.
| Parameters | Wheat | Pearl Millet | Finger Millet | Soya Bean | Groundnut |
| 1000 kernel Wt. (g) | 45.28±1.93c | 12.40±1.01d | 3.19±0.04e | 143.03±1.83b | 541.48±5.87a |
| Bulk density (g/cm3) | 64.50±1.30c | 58.83±1.26e | 67.67±1.53b | 62.10±1.15d | 79.17±1.16a |
| Tap Density (g/cm3) | 69.43±0.83b | 60.53±0.25c | 68.60±1.11b | 68.50±0.87b | 88.37±1.96a |
| WAC (ml/g) | 1.35±0.10c | 1.43±0.10c | 1.84±0.10b | 3.07±0.25a | 1.77±0.25b |
| WSI (g/ml) | 0.15±0.03bc | 0.14±0.04c | 0.07±0.02d | 0.20±0.02b | 0.78±0.03a |
| Values for red (Lovibond®RYBN units) | 5.63±0.15d | 6.47±0.12c | 8.40±0.20b | 5.63±0.15d | 14.77±0.38a |
| Values for Yellow (Lovibond®RYBN units) | 14.90±0.26e | 25.67±0.61d | 54.93±0.78a | 32.60±0.60c | 48.03±0.64b |
| Values for Blue (Lovibond®RYBN units) | 3.47±0.15d | 7.53±0.25c | 8.83±0.15b | 4.53±0.31d | 82.23±1.29a |
| Values for Neutral (Lovibond®RYBN units) | 0.67±0.15c | 0.53±0.15c | 3.77±0.25a | 1.47±0.25b | 3.57±0.31a |
| Moisture (%) | 11.60±0.78a | 10.13±0.99b | 10.64±0.88ab | 9.30±0.44b | 9.84±0.25b |
| Fat (%) | 1.90±0.13d | 4.63±0.62c | 2.47±0.28d | 20.03±0.87b | 34.89±0.36a |
| Protein (%) | 11.07±0.78c | 12.13±0.15c | 11.03±0.91c | 35.30±0.85a | 26.25±1.39b |
| Ash (%) | 1.80±0.26d | 2.13±0.14d | 3.16±0.30c | 5.76±0.70a | 3.83±0.12b |
| Fibre (%) | 1.73±0.43c | 3.43±0.38b | 4.73±0.26a | 4.72±0.32a | 2.12±0.35c |
| Carbohydrate (%) | 71.90±0.93a | 67.55±1.29b | 67.97±1.98b | 24.89±1.50c | 23.06±1.33c |
| Calorific Value (Kcal/100g) | 363.57±4.06d | 374.32±8.42c | 352.09±3.40e | 428.01±5.82b | 519.37±0.68a |
Values in the table are presented as mean±SD; Values with in rows sharing the same letters are not significantly different according to Duncan’s LSD post hoc analysis at P≤0.05
Colour Characteristics
Value of red (R) colour varied significantly from 5.63 (wheat) to 14.77 (groundnut). That for blue (B) and yellow (Y) colour ranged from 3.47 (wheat) to 82.23 (groundnut) and 14.90 (wheat) to 54.93 (finger millet) respectively. Values for neutral (N) ranged from 0.53 (pearl millet) to 3.77 (finger millet).
Physico-Chemical and Organoleptic Evaluation of Gluten Free Products
Gluten Free Cookies
Physico-Chemical Characteristics
The physical parameters like weight, diameter, thickness and spread ratio of cookies were evaluated and compared with control (C0) cookies prepared from whole wheat flour. The weight of cookies ranged from 7.33g (C0) to 8.33g (C1). The diameter and thickness of cookies varied from 55.33 mm (C2) to 62.33 mm (C0) and 5.70 mm (C3) to 6.27 mm (C0), respectively. The spread ratio of cookies was found in range of 8.84 (C2) to 10.22 (C0). Spread ratio of gluten free cookies was lower than control cookies prepared from wheat flour. It was mainly because of lack of gluten content in all formulations except control, resulting in escape of CO2 generated during baking process thereby, decreasing the spread ratio of gluten free cookies. Giri and Sakhale25 reported decrease in spread ratio of sweet potato flour based high protein and low calorie gluten free cookies and Hooda and Jood26 in fenugreek supplemented biscuits.
Gluten free cookies were subjected to chemical analysis for different parameters and results obtained are presented in Table 4. There was significant difference in chemical composition of different formulations of gluten free cookies. The moisture content ranged from 3.02 to 3.66 % but changes were non-significant. The values for ash content varied significantly from 1.66 to 3.16 % in different formulations. Due to incorporation of mineral rich ingredients (PM, FM, SB and GN), the ash content was highest in C3 (3.16%) as compared to control C0 (1.66%). Values for Crude fibre contents were highest in C3 (4.72%) and lowest in control cookies (2.12%). Crude fibre content of gluten free formulations was higher than control because of incorporation of fibre rich ingredients. Crude fat contents were highest in C2 (26.54%) and lowest in C0 (23.06%). Rai, Kaur27 reported moisture content ranging between 3.0-4.1% ash content 1.6%, crude protein 7.4%, crude fat 19.2% and calorific value of 481.7 Kcal/100g in cookies prepared from pearl millet and sorghum. Onweluzo and Iwezu28 reported increase in crude fibre content of cookies with addition of cassava and soybean flour. Similar results were obtained by Chappalwar, Peter29 in cookies prepared from oats and finger millet based composite flour. Crude protein content of cookies ranged from 8.50% (Control) to 13.22% in C3 (formulation containing protein rich ingredients i e. FM, PM, SB and GN). The content of carbohydrates ranged from 50.91% (C2) to 61.65% (C0). Calorific values of cookies varied from 352.09 to 519.37 Kcal/100 g. The values were highest for C3 (491.54 Kcal/100 g) and lowest for C2 (503.56 Kcal/100 g).
Organoleptic Evaluation
Organoleptic evaluation of gluten free cookies after processing is given in Fig. 3. Cookies were subjected to organoleptic evaluation by a semi-trained panel. The overall acceptability score for C0, C1, C2 and C3 was 8.0, 8.17, 7.25 and 7.67. There was slight decrease in overall acceptability of multigrain gluten free cookies (C1, C2, and C3) as compared to control (C0). Cookies containing higher proportion of pearl millet scored less for colour, flavor, texture, taste and overall acceptability as compared to other formulations. It was mainly due to some unpleasant sensory attributes of pearl millet as compared to other gluten free ingredients. However, the cookies were moderately acceptable on 9 point hedonic rating scale. Similar results have been obtained by Ciacci, Maiuri [30] in wheat-free sorghum cookies. Rodrigues, Luparelli31 prepared gluten free cookies from sorghum, rice and corn starch with satisfactory sensory characteristics.
Table 4: Physico-chemical analysis of cookies prepared by different formulation.
| Parameters | Formulations | |||
| C0 | C1 | C2 | C3 | |
| Diameter (D) (mm) | 62.33±0.58a | 60.17±0.76b | 55.33±0.58c | 56.33±0.58c |
| Thickness (T) (mm) | 6.10±0.10a | 6.07±0.06ab | 6.27±0.25ab | 5.70±0.35c |
| Spread ratio (D/T) | 10.22±0.10a | 9.91±0.23a | 8.84±0.45b | 9.91±0.64a |
| Wt. /cookie (g) | 7.33±0.23b | 8.33±0.51a | 8.04±0.14a | 8.25±0.22a |
| Moisture content (%) | 3.02±0.50a | 3.66±0.37a | 3.21±0.29a | 3.16±0.32a |
| Ash content (%) | 1.66±0.15c | 2.21±0.29b | 2.56±0.41b | 3.16±0.25a |
| Crude fat (%) | 23.06±0.64c | 25.19±0.98b | 26.54±0.58a | 24.06±0.53bc |
| Crude fibre (%) | 2.12±0.35c | 4.28±0.35ab | 4.08±0.18b | 4.72±0.32a |
| Crude protein (%) | 8.50±0.22c | 11.66±0.35b | 12.07±0.06b | 13.22±0.22a |
| Carbohydrate (%) | 61.65±1.40a | 53.00±1.22b | 50.91±0.86c | 52.32±0.58bc |
| Calorific Value (Kcal/100g) | 502.73±2.68a | 498.47±4.67a | 503.56±2.47a | 491.54±2.41b |
Values in the table are presented as mean±SD; Values with in rows sharing the same letters are not significantly different according to Duncan’s LSD post hoc analysis at P≤0.05
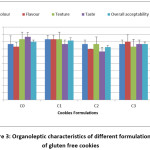 |
Figure 3: Organoleptic characteristics of different formulations of gluten free cookies. Click here to View figure |
C0 (100% WF); C1( 25% FM + 25% PM + 25% SB + 25% GN); C2(15%FM + 35% PM + 25% SB + 25 % GN); C3 ( 35 % FM + 15% PM + 25 % SB + 25% GN) C0-Control, WF-Wheat flour, FM-Finger millet, PM-Pearl millet, SB-Soyabean, GN-Groundnut
Gluten Free Pasta
Physicochemical Characteristics
Gluten free pasta of both types i. e. steamed (PS) and steamed as well as fried (PF) were subjected to physico-chemical analysis for different parameters and results obtained are presented in Table 5 and 6. In case of gluten free pasta that was only steam treated, the moisture content ranged from 8.93 to 9.57% and was statistically non-significant. Moisture content of pasta products must be equal to or less than 12.5% after drying so as to avoid microbial contamination.32 The values for ash content varied significantly from 4.07 to 5.01% in different formulations. The ash content was highest in PS1 (5.01%) and lowest in PS0 (4.07%). Values for Crude fibre contents were highest in PS2 (3.77%) and lowest in control (PS0) (2.36%). It was mainly due to high crude fibre content of gluten free ingredients. Crude fat contents varied significantly and were highest in PS2 (6.72%) and lowest in PS0 (1.64%). High fat content in PS2 may be due to incorporation of higher pearl millet (45%) as compared to other formulations. The content of carbohydrates ranged from 63.56% (PS2) to 74.66% (PS0). Calorific values of pasta varied from 352.09 to 519.37 Kcal/100 g. Due to high fat content in PS2, The calorific value was highest for PS2 (375.86 Kcal/100 g) and lowest for PS0 (361.84Kcal/100 g) (Table 5). Therefore it has been observed that gluten free pasta prepared from gluten free ingredients has higher amount of nutritional ingredients as compared to control (pasta prepared from whole wheat flour). Similar results have been observed by Jalgaonkar, Jha33 during quality evaluation of pearl millet based pasta.
Table 5: Proximate analysis of steamed pasta (PS) prepared by different formulations.
| Parameters | Formulations | |||
| PS0 | PS1 | PS2 | PS3 | |
| Moisture content (%) | 8.93±0.56a | 9.35±0.45a | 9.57±0.19a | 8.94±0.36a |
| Ash content (%) | 4.07±0.14b | 5.01±0.26a | 4.45±0.44ab | 4.24±0.32b |
| Crude fat (%) | 1.64±0.38c | 5.58±0.43b | 6.72±0.92a | 5.21±0.24b |
| Crude fibre (%) | 2.36±0.22c | 2.83±0.31bc | 3.77±0.20a | 2.94±0.25b |
| Crude protein (%) | 8.33±0.17d | 11.23±0.29c | 11.93±0.14b | 12.82±0.54a |
| Carbohydrate (%) | 74.66±0.71a | 66.00±0.36b | 63.56±0.81c | 65.86±0.88b |
| Calorific Value (Kcal/100g) | 361.84±2.17b | 372.87±2.98a | 375.86±5.45a | 375.28±1.54a |
Values in the table are presented as mean±SD; Values with in rows sharing the same letters are not significantly different according to Duncan’s LSD post hoc analysis at P≤0.05
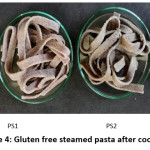 |
Figure 4: Gluten free steamed pasta after cooking. Click here to View figure |
PS0 (100% WF); PS1 (25% FM + 25% PM + 25% SB + 25% GN); PS2 (15%FM + 35% PM + 25% SB + 25 % GN); PS3 (35 % FM + 15% PM + 25 % SB + 25% GN). PS0-Control, WF-Wheat flour, FM-Finger millet, PM-Pearl millet, SB-Soyabean, GN-Groundnut
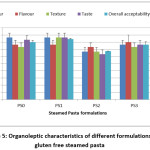 |
Figure 5: Organoleptic characteristics of different formulations of gluten free steamed pasta. Click here to View figure |
PS0 (100% WF); PS1 (25% FM + 25% PM + 25% SB + 25% GN); PS2 (15%FM + 35% PM + 25% SB + 25 % GN); PS3 (35 % FM + 15% PM + 25 % SB + 25% GN). PS0-Control, WF-Wheat flour, FM-Finger millet, PM-Pearl millet, SB-Soyabean, GN-Groundnut
In case of gluten free steamed and fried pasta (PF), the moisture content varied significantly and it ranged from 8.25 to 9.54%. Ash content of different formulations varied from 4.07 to 5.01%. It was highest in PF1 (5.01%) due to incorporation of mineral rich ingredients (FM, PM and SB) as compared to control PF0 (4.07%) prepared from whole wheat flour only. There was significant difference in crude fibre content and it was highest in PF2 (3.55%) and lowest in control (PF0) (2.09%). Crude fat content varied significantly and was highest in PF2 (9.19%) and lowest in PF0 (4.53%). The content of carbohydrates ranged from 61.35% (PF2) to 72.83% (PF0). Calorific values of pasta varied from 380.04 to 391.14 Kcal/100 g. The values were highest for PF3 (391.14 Kcal/100 g) and lowest for PF0 (380.04 Kcal/100 g) (Table 6). Due to frying PF retained had higher amount of fat than PS resulting in higher calorific value.
Organoleptic Evaluation
Gluten free steamed (PS) pasta after boiling (Fig. 4) was subjected to organoleptic evaluation and results obtained are presented in Fig. 5. Pasta was subjected to organoleptic evaluation by a semi-trained panel. The overall acceptability score for PS0, PS1, PS2 and PS3 was 8.0, 8.42, 6.75 and 7.67. Overall acceptability score of PS shows that formulations PS1 and PS3 were desirable (8.42) and moderately desirable (7.67) as per 9 point hedonic rating scale respectively. Whereas overall acceptability scores of PS2 (6.75) shows that these were slightly desirable and most probable reason was that high level of pearl millet in this formulation decreased the score for colour, texture, taste and overall acceptability.
In case of gluten free steamed and fried pasta (PF) (Fig. 6 and 7), score was slightly higher than PS as frying increased the palatability. The overall acceptability score for PF0, PF1, PF2 and PF3 was 8.08, 8.08, 7.00 and 8.08 respectively. Overall acceptability score of PF shows that formulations PF1 (8.08) and PF3 (8.08) were desirable and PF2 was moderately desirable (7.67) as per 9 point hedonic rating scale. Whereas overall acceptability scores of PF2 (7.00) was slightly lower as in case of PS2 due to high level of pearl millet leading to decreased score for texture, taste and overall acceptability.
Table 6: Proximate analysis of steamed and fried pasta (PF) prepared by different formulations.
| Parameters | Formulations | |||
| PF0 | PF1 | PF2 | PF3 | |
| Moisture content (%) | 8.25±0.41b | 8.77±0.40b | 9.54±0.15a | 8.92±0.36ab |
| Ash content (%) | 4.07±0.14b | 5.01±0.28a | 4.44±0.43ab | 4.24±0.30b |
| Crude fat (%) | 4.53±0.37c | 8.54±0.29b | 9.19±0.41a | 8.18±0.19b |
| Crude fibre (%) | 2.09±0.18b | 2.63±0.46b | 3.55±0.06a | 2.64±0.30b |
| Crude protein (%) | 8.23±0.12d | 11.23±0.29c | 11.93±0.14b | 12.82±0.54a |
| Carbohydrate (%) | 72.83±0.67a | 63.82±0.28b | 61.35±0.33c | 63.21±0.91b |
| Calorific Value (Kcal/100g) | 380.04±1.95b | 390.65±1.29a | 389.02±3.21a | 391.14±1.63a |
Values in the table are presented as mean±SD; Values with in rows sharing the same letters are not significantly different according to Duncan’s LSD post hoc analysis at P≤0.05
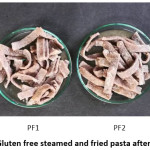 |
Figure 6: Gluten free steamed and fried pasta after cooking. Click here to View figure |
PF0 (100% WF); PF1 (25% FM + 25% PM + 25% SB + 25% GN); PF2 (15%FM + 35% PM + 25% SB + 25 % GN); PF3 (35 % FM + 15% PM + 25 % SB + 25% GN). PF0-Control, WF-Wheat flour, FM-Finger millet, PM-Pearl millet, SB-Soyabean, GN-Groundnut
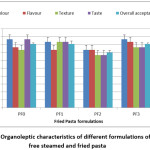 |
Figure 7: Organoleptic characteristics of different formulations of gluten free steamed and fried pasta. Click here to View figure |
PF0 (100% WF); PF1 ( 25% FM + 25% PM + 25% SB + 25% GN); PF2 (15%FM + 35% PM + 25% SB + 25 % GN); PF3 ( 35 % FM + 15% PM + 25 % SB + 25% GN). PF0-Control, WF-Wheat flour, FM-Finger millet, PM-Pearl millet, SB-Soyabean, GN-Groundnut
Conclusions
Gluten free ingredients i. e. pearl millet, finger millet, soya bean and groundnut flour were incorporated successfully for preparation of value added gluten free food products like cookies and pasta. It has been observed that incorporation of nutritious gluten free ingredients in these products increased the contents of essential nutrients such as crude fibre, crude fat, crude proteins and mineral or ash contents. All formulations were desirable as per results of sensory evaluation except for formulation containing higher proportion of pearl millet and considered moderately desirable as per 9-point hedonic rating scale. All these nutrients are potentially deficient in gluten free products available in market which mainly consist of starch and other synthetic additives.
Gluten free food products available in the market are costly and not affordable by all sections of society. Due to incorporation of low-cost underutilized millets, soya bean and groundnut in these products, these can be affordable by every section of society. Processing the underutilized gluten free raw ingredients using techniques mentioned in present investigation for the development of gluten free food products would be the possible solution for promotion and commercialization of these products. These food products can serve as a good carrier for transferring the nutritional properties of underutilized millets and can help in improving the nutritional status of not only the celiac patients but also other people suffering from various lifestyle disorders.
Acknowledgement
The authors would like to thank worthy Vice Chancellor, Eternal University for providing the motivation and research infrastructure.
Funding
The authors would like to thank The Ministry of Food Processing Industries (MoFPI) Govt. of India, for grant-in-aid (F. No. 5-11/2010-HRD) for development of infrastructural facilities.
Conflict of Interest
The authors declare that there is no conflict of interest.
References
- Jnawali, P., V. Kumar, and B. Tanwar, Celiac disease: Overview and considerations for development of gluten-free foods. Food Science and Human Wellness, 2016. 5(4): p. 169-176.
CrossRef - Rubio-Tapia, A., et al., The prevalence of celiac disease in the United States. The American journal of gastroenterology, 2012. 107(10): p. 1538.
CrossRef - Hybenová, E., J. Štofirová, and A. Mikulajová, Celiac disease and gluten-free diet. Potravinarstvo Slovak Journal of Food Sciences, 2013. 7(1): p. 95-100.
CrossRef - Tack, G.J., et al., The spectrum of celiac disease: epidemiology, clinical aspects and treatment. Nature reviews Gastroenterology & hepatology, 2010. 7(4): p. 204.
CrossRef - Moreno Amador, M.d.L., I.M. Comino Montilla, and C. Sousa Martín, Alternative grains as potential raw material for gluten–free food development in the diet of celiac and gluten–sensitive patients.
- Matos, M. and C. Rosell, Understanding gluten free bread development for reaching quality and nutritional balance. Journal of the Science of Food and Agriculture, 2015. 95(4): p. 653-661.
CrossRef - Marco, C. and C.M. Rosell, Breadmaking performance of protein enriched, gluten-free breads. European Food Research and Technology, 2008. 227(4): p. 1205-1213.
CrossRef - Devi, P.B., et al., Health benefits of finger millet (Eleusine coracana L.) polyphenols and dietary fiber: a review. Journal of food science and technology, 2014. 51(6): p. 1021-1040.
CrossRef - Gélinas, P., et al., Gluten contamination of cereal foods in Canada. International journal of food science & technology, 2008. 43(7): p. 1245-1252.
CrossRef - Dias-Martins, A.M., et al., Potential use of pearl millet (Pennisetum glaucum (L.) R. Br.) in Brazil: Food security, processing, health benefits and nutritional products. Food research international, 2018. 109: p. 175-186.
CrossRef - Jayawardana, S.A.S., et al., Dietary fibers, starch fractions and nutritional composition of finger millet varieties cultivated in Sri Lanka. Journal of Food Composition and Analysis, 2019. 82: p. 103249.
CrossRef - Etiosa, O.R., N.B. Chika, and A. Benedicta, Mineral and proximate composition of soya bean. Asian Journal of Physical and Chemical Sciences, 2017: p. 1-6.
CrossRef - Ajay, S. and K. Pradyuman, Optimization of gluten free biscuit from foxtail, copra meal and amaranth. Food Science and Technology, 2018 : http://dx.doi.org/10.1590/fst.22917.
CrossRef - Schoenlechner, R., et al., Functional properties of gluten-free pasta produced from amaranth, quinoa and buckwheat. Plant foods for human nutrition, 2010. 65(4): p. 339-349.
CrossRef - Palavecino, P.M., et al., Gluten‐free sorghum pasta: starch digestibility and antioxidant capacity compared with commercial products. Journal of the Science of Food and Agriculture, 2019. 99(3): p. 1351-1357.
CrossRef - Oniszczuk, A., et al., Content of Phenolic Compounds and Antioxidant Activity of New Gluten-Free Pasta with the Addition of Chestnut Flour. Molecules, 2019. 24(14): p. 2623.
CrossRef - AACC, C., Approved methods of the American association of cereal chemists. Methods, 2000. 54: p. 21.
- Huang, S., et al., Effects of rice bran on sensory and physico-chemical properties of emulsified pork meatballs. Meat Science, 2005. 70(4): p. 613-619.
CrossRef - Jones, D., et al., Physiochemical properties of ready-to-eat breakfast cereals. Cereal Foods World, 2000. 45(4): p. 164-168.
- Sosulski, F., The centrifuge method for determining flour absorption in hard red spring wheats. Cereal Chem., 1962. 39: p. 344-350.
- Stojceska, V., et al., Cauliflower by-products as a new source of dietary fibre, antioxidants and proteins in cereal based ready-to-eat expanded snacks. Journal of Food Engineering, 2008. 87(4): p. 554-563.
CrossRef - AOAC, Association of official analytical chemists. Washington, D.C. , 1990. 15th edition.
- Ranganna, S., Handbook of analysis and quality control for fruit and vegetable products. 1986: Tata McGraw-Hill Education.
- FAO, Energy and protein requirements. 1973: World Health Organization.
- Giri, N.A. and B. Sakhale, Development of sweet potato flour based high protein and low calorie gluten free cookies. Current Research in Nutrition and Food Science Journal, 2019. 7(2): p. 427-435.
CrossRef - Hooda, S. and S. Jood, Organoleptic and nutritional evaluation of wheat biscuits supplemented with untreated and treated fenugreek flour. Food Chemistry, 2005. 90(3): p. 427-435.
CrossRef - Rai, S., A. Kaur, and B. Singh, Quality characteristics of gluten free cookies prepared from different flour combinations. Journal of food science and technology, 2014. 51(4): p. 785-789.
CrossRef - Onweluzo, J. and E. Iwezu, Composition and characteristics of cassava-soybean and wheat-soybean biscuits. Journal of food science and technology, 1998. 35(2): p. 128-131.
- Chappalwar, V.M., et al., Quality characteristics of cookies prepared from oats and finger millet based composite flour. Engineering Science and Technology: An International Journal (Toronto, Ont.), 2013. 3(4): p. 667-683.
- Ciacci, C., et al., Celiac disease: in vitro and in vivo safety and palatability of wheat-free sorghum food products. Clinical nutrition, 2007. 26(6): p. 799-805.
CrossRef - Rodrigues, S.F., et al., Gluten-free cookies prepared with sorghum flour. Archivos latinoamericanos de nutricion, 2009. 59(4): p. 433-440.
- Bustos, M., G. Perez, and A. Leon, Structure and quality of pasta enriched with functional ingredients. Rsc Advances, 2015. 5(39): p. 30780-30792.
CrossRef - Jalgaonkar, K., S. Jha, and M.K. Mahawar, Quality evaluation of pearl millet based pasta as affected by depigmentation. Current Science (00113891), 2018. 115(6).
CrossRef

This work is licensed under a Creative Commons Attribution 4.0 International License.