Effect of Microcrystalline Cellulose on Physical Characteristics and Sensory Acceptance of Chocolate Flavored Milk
Nutsuda Sumonsiri*
Department of Agro-Industrial, Food, and Environmental Technology, Faculty of Applied Science, King Mongkut’s University of Technology North Bangkok (KMUTNB)1518 Pracharat 1 Road, Wongsawang, Bangsue, Bangkok 10800 Thailand
Corresponding Author Email: nutsuda.s@sci.kmutnb.ac.th
DOI : http://dx.doi.org/10.12944/CRNFSJ.6.3.20
Download this article as:
![]()
The influence of microcrystalline cellulose (0.05-0.30%w/v) on properties of chocolate flavored milk during storage at 4°C was investigated in this research. The samples were not only analyzed for changes in apparent viscosity, sedimentation, and color (lightness (L*), chroma (C*), and hue angle (h*)) during storage, but also evaluated for sensory acceptability at the beginning of storage. No significant differences between control and MCC added samples were found in apparent viscosity at the beginning of storage and during storage at 4°C (p≥0.05), except that in the sample with 0.20%w/v MCC. Chocolate flavored milk with 0.05 and 0.10%w/v MCC showed the lowest sedimentation at the end of storage. L* values of chocolate flavored milk tended to increase with MCC concentration and storage time while C* and h* tended to decrease with MCC concentration but increase with storage time. From sensory evaluation, the control and chocolate flavored milk with MCC at the beginning of storage obtained insignificantly different scores in overall acceptance (p≥0.05). In conclusion, the concentration of MCC at 0.10%(w/w) was recommended in chocolate flavored milk since it could reduce the sedimentation of sample during storage at 4°C without affecting apparent viscosity and overall sensory acceptability.
KEYWORDS:Chocolate Flavored Milk; Microcrystalline Cellulose (MCC), Sediment Stability; Sensory Characteristics
Introduction
Varieties of essential nutrients including calcium, fatty acids, essential amino acids, vitamins, and minerals are found in milk and dairy products.1 Chocolate flavored milk has been considered as one of the most popular milk beverages due to its nutritional and sensory characteristics, as well as, its convenience for consumption.2 A recent study has shown that 12% of children (10-14 years old, n=234) preferred chocolate milk to other dairy products (except milk), such as cheese spread, yogurt, pudding, and cheese.3 The formulation of chocolate flavored milk basically includes milk, sucrose and cocoa powder, as well as, some hydrocolloids in order to prevent cocoa particle sedimentation, as well as, improve consistency and mouthfeel of the beverage.2 In the previous research, various types of hydrocolloids have been studied for their effects on apparent viscosity, flow behavior, and sensory properties of milk, chocolate milk and chocolate beverages. Sodium alginate and k-carrageenan are the most common hydrocolloids used in milk beverage. The study of these hydrocolloids in low-calorie flavored milk beverages has revealed that k-carrageenan can release better flavor in chocolate milk model system than sodium alginate.4 Many starches (tapioca, wheat, corn, potato, modified corn, and modified potato) and gums (xanthan gum, guar gum, alginate, salep, locust bean gum, and carrageenan) have also been studied in model hot chocolate beverage.5 Moreover, modified chitosan has been added as a thickening agent in chocolate milk beverage and provided good acceptability of the product.6 Microcrystalline cellulose (MCC) is white, porous, tasteless, odorless, crystalline powder extracted from hydrolysis of native cellulose with diluted mineral acids or enzymolysis7 to produce alpha-cellulose, which is partially depolymerized and purified to obtain MCC.8 MCC has been used in various applications, such as food, cosmetics, pharmaceutical, plastic, and cement industries.9 In food industry, MCC has been approved as GRAS (generally considered as safe). It has been used in dairy products,10,11 sausage,8 and bakery products,12,13 as a fat replacer and a bulking agent for better consistency, moisture retention, improvement of stability of suspensions and enhancement of product mouthfeel. A research recently showed that MCC prepared from rice straw can be applied in yoghurt production. The yoghurt with 0.1% MCC has higher viscosity, volatile fatty acids, acidity, acetaldehyde, diacetyl, and acceptability from sensory evaluation when compared to the control (no MCC added).10
The main objective of this research was to investigate the influence of microcrystalline cellulose (0.05-0.30%) on properties of chocolate flavored milk, including apparent viscosity, sedimentation, color during storage at 4°C, and sensory acceptance at the first day of storage.
Materials and Methods
Materials
For preparing a control sample of chocolate flavored milk in this study, commercial food-grade ingredients and formulation, 92.48%(w/w) fresh milk (Centermilk, Ratchaburi, Thailand), 6.60%(w/w) sucrose (Mitr Phol Sugar Co., Ltd., Bangkok, Thailand), 0.92%(w/w) cocoa powder (Sino – Pacific Trading (Thailand) Co.,Ltd., Bangkok, Thailand), were used.
Sample Preparation
In the preparation for a control sample, milk was heated to 50°C before slowly adding cocoa powder and continuously stirring for 1 min 30 sec. Sucrose was then slowly added and the mixture was continuously stirred for 1 min 30 sec. The sample was homogenized using a hand blender (Moulinex, Groupe SEB (Thailand), Ltd., Bangkok, Thailand) for 4 min before being pasteurized at 74 ± 2°C for 30 min. After pasteurization, the sample was cooled down to 5°C and distributed into glass bottles with 10% head space.
The procedures for preparing chocolate flavored milk with addition of food-grade MCC (Modernist Pantry, LLC., Maine, U.S.A.) were the same as those procedures for the control, except MCC was mixed into sucrose at 6 difference concentrations of 0.05, 0.01, 0.15, 0.20, 0.25, and 0.30%(w/v) and slowly added into the mixture of milk and cocoa powder.
Every sample was stored in a refrigerator at 4°C for analysis. The procedures for sample preparation were independently repeated as replication on three separate days.
Apparent Viscosity
Apparent viscosity of chocolate flavored milk at 0, 2, 4, and 6 days of storage was measured at room temperature using a Brook field rotational rheometer (Brook field DV-II+, Brook field Engineering Laboratories, Inc., Massachusetts, U.S.A.) equipped with an interchangeable disc spindle (no. 1). Bottles of sample were placed in the temperature-controlled water bath and allowed to equilibrate to room temperature prior to the measurement of apparent viscosity. The readings of apparent viscosity of samples (400 ml in 500 ml beaker) were taken at rotational speed at 25 rpm for 5 min. The spindle no. 1 and speed of 25 rpm were selected as the most appropriate spindle and rotational speed during preliminary experiments.
Sedimentation
The settling of cocoa particles under gravity at the bottom of bottles is visually observed and measured using a micrometer to study the sedimentation behavior of chocolate flavored milk at 1, 3, and 7 days of storage.
Color
Hunter colorimeter (Color Quest 45/0, Hunter Associates Laboratory, Inc., Reston, VA) was used for measuring color values of samples at 0, 3, 7, and 10 days of storage. All measurements were conducted at room temperature. Bottles of sample were placed in the temperature-controlled water bath and allowed to equilibrate to room temperature prior to the measurement of color. Before analyzing samples, a standard white and black reflector plates were used for calibrating the instrument. Four readings per sample were measured by changing the position of the sample and three samples per treatment were measured in each replicate. CIE L*C*h* color parameters for 10° vision angle and D65 illuminant (L*: lightness, C*: chroma, and h*: hue angle (°) were measured and calculated.
Sensory Evaluation
Control and three treated samples (selected from samples with appropriate apparent viscosity, sedimentation and color during storage) were evaluated at the beginning of storage for acceptance (color, sweetness, viscosity, and overall acceptance) using a 9-point hedonic scale, which includes 1 (dislike extremely), 2 (dislike very much), 3 (dislike moderately), 4 (dislike slightly), 5 (neither like nor dislike), 6 (like slightly), 7 (like moderately), 8 (like very much), 9 (like extremely). 30 untrained panelists were screened from undergraduate students in the Department of Agro-Industrial, Food, and Environmental Technology, Faculty of Applied Science, King Mongkut’s University of Technology North Bangkok (KMUTNB), Thailand. Random 3-digit codes were used for labeling all samples, which were presented in a randomized complete block design. The random number generator was used to generate the randomized presentation order to reduce sample order effects. During the evaluation, panelists were asked to cleanse their mouths with warm water to eliminate the taste of previous sample.
Statistical Analysis
Every analysis was run in triplicate on each of three sub samples. Significant differences among means were analyzed by analysis of variance (ANOVA) and Duncan’s multiple range test (DMRT) using IBM SPSS Statistics 21 (IBM Corporation, Armonk, NY). Significant difference was defined at p<0.05.
Results and Discussion
Apparent Viscosity
Table 1 shows apparent viscosity of control and MCC added samples during storage at 4°C. At the beginning of storage, the control and MCC added samples did not have significantly different apparent viscosity (p≥0.05). According to the study of rheological properties of commercial chocolate milk beverages, the viscosity of samples from nine different brands in Spanish market varies from 6.65 ± 0.10 to 30.07 ± 0.65 cP at 5 ± 0.1°C.2 Therefore, the apparent viscosity of all samples in the current research could be comparable to those available in the market. During storage at 4°C, apparent viscosity tended to decrease with the increase of MCC concentrations. This might happen due to the complexation and incompatibility of opposite charges on protein anionic hydrocolloid. The complexes of proteins and anionic hydrocolloid become resolubilised with too much hydrocolloid while the uncomplexed protein remains in solution with too little hydrocolloid.14 However, in the addition of MCC from rice straw in yoghurt,10 viscosity of yoghurt with MCC is higher than control either at the beginning of storage and during storage at 5±1°C. The difference between the current and previous research may be due to the increased acidity in yoghurt tested in the previous research, which can affect the interaction between MCC and milk protein.15,16
Table 1 : Apparent viscosity of chocolate flavored milk with 0 – 0.30% w/v MCC during storage at 4 °C.qfgl]
| Days of Storage | ||||
| MCC concentration (%w/v) | 0ns | 2 | 4 | 6 |
| 0.00NS | 20.23 ± 2.00 | 21.27a ± 0.50 | 20.17bc ± 1.25 | 22.20a ± 1.31 |
| 0.05NS | 19.10 ± 1.01 | 19.67abc ± 1.61 | 22.80a ± 1.41 | 21.67a ± 2.10 |
| 0.10NS | 19.90 ± 1.73 | 19.03bc ± 0.06 | 19.93c ± 1.02 | 21.03a ± 1.12 |
| 0.15NS | 18.77 ± 1.79 | 17.77c ± 1.31 | 20.40bc ± 1.40 | 20.40a ± 0.66 |
| 0.20 | C19.03 ± 0.58 | B20.37ab ± 0.85 | A22.10ab ± 0.30 | A22.47a ± 0.81 |
| 0.25NS | 18.83 ± 0.57 | 18.70bc ± 1.31 | 18.73c ± 0.76 | 18.17b ± 0.59 |
| 0.30NS | 18.20 ± 0.26 | 18.70bc ± 0.98 | 18.87c ± 0.76 | 18.07b ± 0.40 |
Lowercase letters (a, b, and c) indicate that samples with different concentrations of MCC were significantly different at the same day of storage at p<0.05.
NS indicates that samples with different concentrations of MCC were not significantly different at the same day of storage at p≥0.05.
Uppercase letters (A, B, and C) indicate that samples at the same concentration of MCC were significantly different at p<0.05.
NS indicates that samples at the same concentration of MCC were not significantly different at p≥0.05 (n=3).
Sedimentation
Sedimentation of every sample increased during storage (p<0.05), especially at the first 3 days of storage (Figure 1). Chocolate flavored milk with 0.05%w/v MCC showed the lowest sedimentation during storage and those samples with 0.05 and 0.10%w/v MCC showed the lowest sedimentation at the end of storage. MCC contains very porous particles, which can absorb a lot of water. It can improve cocoa suspension in the chocolate flavored milk.17,18 Nevertheless, the sedimentation of samples with MCC at higher than 0.15%w/v significantly increased with MCC concentration (p<0.05). At higher concentration of hydrocolloid, the protein-carboxylated polysaccharide complexes can become destabilized due to decreased negative protein net charge, which leads to sticky particles and aggregation into a particle network.14 Similarly, there is higher sedimentation at higher concentration of another hydrocolloid, carrageenan, in the study of chocolate flavored milk with ultra-high-temperature processing.19 The sediment formation may increase due to aggregation of casein with excess hydrocolloid remaining in the solution.
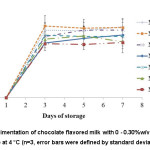 |
Figure 1 : Sedimentation of chocolate flavored milk with 0 – 0.30%w/v MCC during storage at 4 °C (n=3, error bars were defined by standard deviations). |
Color
Color is an important quality attribute, which affects acceptance of chocolate flavored milk since consumers generally decide palatability using this quality factor as an indicator at the point of purchase.20 Table 2, 3, and 4 show lightness (L*), chroma (C*), and hue angle (h*) of control and MCC added samples during storage at 4°C respectively. L* values represent a luminosity measurement. The L* with higher value indicates that sample is lighter when perceived by humans. C*, which usually represents color intensity, indicates colorfulness of samples. h* is used to show a color of an object with the same lightness. h* of 0° or 360° defines red hue while h* of 90°, 180°, and 270° define yellow, green and blue hues respectively.21 In the study of rheological properties of commercial chocolate milk beverages,2 L* values of samples from nine different brands in Spanish market also vary from 18.31 ± 0.29 to 53.55 ± 0.14. C* values are between 17.96 ± 0.26 and 24.95 ± 0.23. h* values are between 47.47 ± 0.35° and 59.76 ± 1.60°. Therefore, the color of all samples in the current research could be comparable to those available in the market.
L* values of chocolate flavored milk tended to increase with MCC concentration and storage time at 4°C while C* and h* tended to decrease with MCC concentration but increase with storage time. The results indicated that MCC concentration could increase lightness of the samples. In the study of MCC addition in emulsified sausages,8 MCC also increased lightness and yellowness of samples.
Table 2 : Lightness (L*) of chocolate flavored milk with 0 – 0.30%w/v MCC during storage at 4 °C.
| Days of Storage | ||||
| MCC concentration (%w/v) | 0 | 3 | 7 | 10 |
| 0.00 | C35.86d ± 0.41 | D34.48c ± 0.09 | B37.72d ± 0.35 | A42.64c ± 0.88 |
| 0.05 | C39.46c ± 0.56 | C39.49b ± 0.26 | B41.36c ± 1.16 | A43.61bc ± 0.55 |
| 0.10 | B41.32b ± 0.24 | C39.33b ± 0.80 | BC41.12c ± 1.13 | A45.89ab ± 1.29 |
| 0.15 | B41.46b ± 0.86 | B42.22a ± 0.50 | A46.23a ± 1.57 | A47.72a ± 0.92 |
| 0.20 | B43.44a ± 0.41 | B42.50a ± 0.33 | A46.71a ± 0.51 | A46.61ab ± 1.10 |
| 0.25 | B41.40b ± 0.49 | B41.40a ± 0.50 | B43.19b ± 0.73 | A45.55abc ± 2.09 |
| 0.30NS | 41.32b ± 0.09 | 42.48a ± 1.32 | 43.82b ± 0.86 | 45.88ab ± 3.25 |
Lowercase letters (a, b, c, and d) indicate that samples with different concentrations of MCC were significantly different at the same day of storage at p<0.05.
Uppercase letters (A, B, C, and D) indicate that samples at the same concentration of MCC were significantly different at p<0.05.
NS indicates that samples at the same concentration of MCC were not significantly different at p≥0.05 (n=3).
Table 3 : Chroma (C*) of chocolate flavored milk8with 0 – 0.30%w/v MCC during storage at 4 °C.
| Days of Storage | ||||
| MCC concentration (%w/v) | 0 | 3 | 7 | 10ns |
| 0.00 | D18.71a ± 0.22 | C19.70a ± 0.29 | B21.40b ± 0.56 | A23.13 ± 0.75 |
| 0.05 | B17.67b ± 0.23 | B18.45b ± 0.17 | A21.72b ± 1.13 | A21.86 ± 0.46 |
| 0.10 | D16.70c ± 0.20 | C17.95c ± 0.39 | B19.80c ± 0.23 | A20.81 ± 0.36 |
| 0.15 | C17.57b ± 0.22 | C17.79c ± 0.13 | A23.56a ± 0.40 | B21.81 ± 0.42 |
| 0.20 | D15.86d ± 0.24 | C16.55d ± 0.19 | A21.00b ± 0.20 | B19.95 ± 0.08 |
| 0.25NS | 17.05c ± 0.24 | 16.76d ± 0.31 | 17.31d ± 1.01 | 19.51 ± 3.51 |
| 0.30 | B16.85c ± 0.14 | B16.95d ± 0.39 | B17.14d ± 0.21 | A19.94 ± 1.85 |
Lowercase letters (a, b, c, and d) indicate that samples with different concentrations of MCC were significantly different at the same day of storage at p<0.05.
NS indicates that samples with different concentrations of MCC were not significantly different at the same day of storage at p≥0.05.
Uppercase letters (A, B, C, and D) indicate that samples at the same concentration of MCC were significantly different at p<0.05.
NS indicates that samples at the same concentration of MCC were not significantly different at p≥0.05 (n=3).
Table 4 : Hue Angle (h*) of Chocolate Flavored Milk with 0 – 0.30%w/v MCC During Storage at 4 °C.
| Days of Storage | ||||
| MCC concentration (%w/v) | 0 | 3 | 7 | 10ns |
| 0.00 | D45.09d ± 0.14 | C46.23bc ± 0.20 | B48.52b ± 0.51 | A51.42 ± 0.27 |
| 0.05 | D46.51a ± 0.10 | C47.53a ± 0.06 | B48.35b ± 0.62 | A49.34 ± 0.28 |
| 0.10 | B46.01b ± 0.22 | B46.8b ± 0.03 | B46.99c ± 0.28 | A50.30 ± 1.05 |
| 0.15 | B45.62c ± 0.22 | B46.59b ± 0.16 | A50.72a ± 0.63 | A51.21 ± 0.89 |
| 0.20 | C44.52e ± 0.11 | B45.59c ± 0.16 | A49.09b ± 0.27 | A49.13 ± 0.43 |
| 0.25NS | 45.56c ± 0.12 | 45.78c ± 0.17 | 46.05d ± 0.56 | 48.44 ± 3.13 |
| 0.30 | B45.52c ± 0.14 | B46.17bc ± 0.88 | B46.48cd ± 0.35 | A51.66 ± 1.76 |
Lowercase letters (a, b, c, and d) indicate that samples with different concentrations of MCC were significantly different at the same day of storage at p<0.05.
NS indicates that samples with different concentrations of MCC were not significantly different at the same day of storage at p≥0.05.
Uppercase letters (A, B, C, and D) indicate that samples at the same concentration of MCC were significantly different at p<0.05.
NS indicates that samples at the same concentration of MCC were not significantly different at p≥0.05 (n=3).
Sensory Evaluation
The acceptance test with 9-hedonic scale was conducted to determine consumer acceptability on chocolate flavored milk with 0, 0.10, 0.15, and 0.30%w/v MCC among untrained panelists (n=30). Acceptance scores on color, sweetness, viscosity, and overall acceptance are presented in Figure 2. The control and samples with 0.15 and 0.30%w/v MCC had the highest acceptance scores in color. The control and samples with 0.30%w/v MCC had the highest acceptance scores in sweetness. However, the acceptance scores between control and samples with MCC at the beginning of storage were not significantly different in viscosity and overall acceptance (p≥0.05). These samples received the acceptance score of approximately ‘6’ or ‘like slightly’. These results ensured that MCC at 0.10, 0.15, and 0.30%w/v did not affect the overall sensory acceptance of chocolate flavored milk. In the previous research, yoghurt with 0.1% MCC (prepared from rice straw) also obtains the highest scores for appearance, body and texture, and flavor in organoleptic evaluation.10
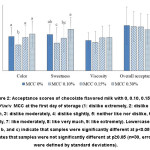 |
Figure 2 : Acceptance scores of chocolate flavored milk with 0, 0.10, 0.15, and 0.30%w/v MCC at the first day of storage |
Conclusion
At the beginning of storage and during storage at 4°C, there were no significant differences between control and MCC added samples in apparent viscosity (p≥0.05), except that in the sample with 0.20%w/v MCC. Chocolate flavored milk with 0.05 and 0.10%w/v MCC showed the lowest sedimentation at the end of storage. L* values of chocolate flavored milk tended to increase with MCC concentration and storage time while C* and h* tended to decrease with MCC concentration but increase with storage time. From sensory evaluation, overall appearance scores of the control and chocolate flavored milk with MCC at the beginning of storage were not significantly different (p≥0.05). The recommended concentration of MCC in chocolate flavored milk was 0.10%(w/w) since it could reduce the sedimentation of sample during storage at 4°C without affecting apparent viscosity and overall sensory acceptability.
Acknowledgements
This research was funded by King Mongkut’s University of Technology North Bangkok (KMUTNB), Contract no. KMUTNB-NRU-59-13.
References
- Whitney E. N., Rolfes S. R. Understanding Nutrition, 14th Stamford, CT: Cengage Learning. 2016.
- Yanes M., Durán L., Costell E. Rheological and optical properties of commercial chocolate milk beverages. Food Eng. 2002;51(3):229-234.
CrossRef - Colić Barić I. A comparison of nutrition knowledge, attitudes and dairy consumption of school children according to age and gender. Mljekarstvo. 2001;51(1):3-14.
- Yanes M., Durán L., Costell E. Effect of hydrocolloid type and concentration on flow behaviour and sensory properties of milk beverages model systems. Food Hydrocoll. 2002;16(6):605-611.
CrossRef - Dogan M., Toker O. S., Goksel M. Rheological behaviour of instant hot chocolate beverage: part 1. optimization of the effect of different starches and gums. Food Biophys. 2011;6(4):512-518.
CrossRef - Edurado M. F., Correa De Mello K. G. P., Polakiewicz B., Da Silva Lannes S.C. Evaluation of chocolate milk beverage formulated with modified chitosan. Agr. Sci. Tech. 2014;16(6):1301-1312.
- Ejikeme P. M. Investigation of the physicochemical properties of microcrystalline cellulose from agricultural wastes I: orange mesocarp. Cellulose. 2008;15(1):141-147.
CrossRef - Schuh V., Allard K., Hermann K., Gibis M., Kohlus R., Weiss J. Impact of carboxymethyl cellulose (CMC) and microcrystalline cellulose (MCC) on functional characteristics of emulsified sausages. Meat Sci. 2013;93(2): 240-247.
CrossRef - Nsor-Atindana J., Chen M., Goff H. D., Zhong F., Sharif H. R., Li Y. Functionality and nutritional aspects of microcrystalline cellulose in food. Polym. 2017;172:159-174.
CrossRef - Nawar G. A. M., Hassn F. A. M., Ali K. E., Kassem J. M., Mohamed S. H. S. Utilization of microcrystalline cellulose prepared from rice straw in manufacture of yoghurt. Am. Sci. 2010; 6(10):226-231.
- Soukoulis C., Lebesi D., Tzia C. Enrichment of ice cream with dietary fibre: Effects on rheological properties, ice crystallisation and glass transition phenomena. Food Chem. 2009;115(2):665-671.
CrossRef - Correa M. J., Añόn M. C., Pérez G. T., Ferrero C. Effect of modified celluloses on dough rheology and microstructure. Food Res. Int. 2010;43(3):780-787.
CrossRef - Gómez M., Moraleja A., Oliete B., Ruiz E., Caballero P. A. Effect of fibre size on the quality of fibre-enriched layer cake. LWT-Food Sci. Technol. 2010;43(1):33-38.
- Syrbe A., Bauer W. J., Klostermeyer H. Polymer science concepts in dairy systems – an overview of milk protein and food hydrocolloid interaction. Int. Dairy J. 1998;8(3):179-193.
CrossRef - Guiseley K. B., Staneley N. F., White Hoose P. A., Carrageenan. in R.L., Davidson. ed. Handbook of Water Soluble Gums and Resins. New York, NY: McGraw Hill book Co. 1980.
- Schmidt K. A., Smith D. E. Rheological properties of gum and milk protein interactions. Dairy Sci. 1992;75(1):36-42.
CrossRef - Domingo C. T., Gregory R. K., Greg B. Microcrystalline cellulose. in A. Imeson, ed. Food Stabilisers, Thickeners and Gelling Agents. Singapore: Blackwell Publishing Ltd. 2010.
- Milani J., Maleki G. Hydrocolloids in Food Industry. in B. Valdez, ed. Food Industrial Processes: Methods and Equipment. UK: IntechOpen Ltd. 2012.
CrossRef - Prakash S., Huppertz T., Karvchuk O., Deeth O. Ultra-high-temperature processing of chocolate flavoured milk. Food Eng. 2010;96(2):179-184.
CrossRef - Mahony A. Effect of Color on the Odor, Flavor, and Acceptance Properties of Food and Beverages. Manhattan, KS: Kansas State University. 2011.
- Parthare P. B., Opara U. L., Al-Said F. A. Colour measurement and analysis in fresh and processed foods: a review. Food Bioprocess Tech. 2013;6(1):36-60.
CrossRef
Accepted on: 23-10-2018
Second Review by: Dr. Jorge Octavio Virues Delgadillo (Mexico)
Final Approval by: Dan C. Vodnar


Web of Science Coverage
Emerging Sources Citation Index (ESCI)
2024 Journal Impact Factor: 1.1
Scopus Journal Metrics
CiteScore 2025: 2.6
CiteScore Details
Sustainable Nutrition: Food Systems, Nutrient Retention, and Public Health Impact
![]()
This journal is a member of, and subscribes to the principles of, the Committee on Publication Ethics (COPE)


