Smoothies: Exploring the Attitudes, Beliefs and Behaviours of Consumers and Non-Consumers
Danielle McCartney1*
, Ben Desbrow1, Saman Khalesi2, Christopher Irwin1 1School of Allied Health Sciences, Griffith University, Gold Coast, Australia
2Physical Activity Research Group, Appleton Institute and School of Health, Medical and Applied Sciences, Central Queensland University, Rockhampton, Australia.
Corresponding author Email: danielle.mccartney@griffithuni.edu.au
DOI : http://dx.doi.org/10.12944/CRNFSJ.6.2.17
Download this article as:
![]()
Smoothies are popular dietary products. An online survey of Australian adults (n=833; 79% female) was used to explore patterns of smoothie consumption and individual motives for consuming these beverages. Participants commonly reported consuming fruit (98%), yoghurt (66%), milk (58%), honey (52%), fruit juice (46%), and nutritional supplements (46%) in smoothies. Compared to Infrequent Smoothie-Consumers (I-SC, < 1•week-1; n=514), Frequent Smoothie-Consumers (F-SC, >= 1•week-1; n=269) were more likely to consume core-foods (e.g. vegetables, p < 0.001) and less likely to consume discretionary items (e.g. honey or ice-cream, p’s < 0.020) in smoothies. It followed that F-SC typically cited “health-related reasons” for consuming these beverages (i.e. to increase fruit/vegetable [57%] or nutrient [50%] intake, and/or to be “healthy” [56%]) and perceived these products as “nutritious” (84%); whilst I-SC often perceived them as “indulgent” (62%). Smoothies may play a positive role in the diet. However, beverages incorporating discretionary choices may increase energy, saturated fat and/or sugar intakes, offsetting the benefits of fruit/vegetable consumption.
KEYWORDS:Consumer behaviour; Dietary behaviour; Nutrition; Smoothie
Introduction
Poor dietary behaviours are the largest contributing factor to the burden of disease in Australia1. These behaviours involve the over-consumption of energy-dense nutrient-poor ‘discretionary’ foods and beverages (i.e. high in energy, saturated fat, added or refined sugars and/or salt), and an inadequate intake of nutrient-dense items, including fruit and vegetables.2 Indeed, data from the Australian Health Survey (2011–2012)3 indicate that the majority of Australian adults (≥19 y) consume less than the recommended amount of fruit (Males [M]: 70%; Females [F]: 77%) and vegetables (M: 97%; F: 95%) per day; and derive approximately one-third of their total daily energy intake from discretionary items. Similar dietary issues have been identified in the United Kingdom (UK)4 and the United States (USA).5 Importantly, modest improvements in diet quality (e.g. increasing fruit and/or vegetable consumption by just one serve per day) appear sufficient to elicit meaningful reductions (i.e. up to 11%) in the risk of developing some diet-related chronic diseases,6,9 and reduce the economic burden associated with healthcare.10
Smoothies (blended beverages that typically contain multiple ingredients) are popular dietary products with the potential to assist individuals in incorporating more fruit and vegetables into their diets.11 Though published scientific data on rates of smoothie consumption are limited, the availability and accessibility of these beverages certainly appears to have increased, with ready-to-drink beverages (i.e. pre-packaged), made-to-order smoothie bars, and kitchen appliances that facilitate smoothie production at home now widespread in the market. Commercial reports also suggest that the “smoothie industry” has experienced considerable financial growth in many countries (e.g. Australia, New Zealand, the UK and USA).12, 13 Given their popularity, understanding the contribution that smoothies make to the dietary intake of individuals is important.
A recent study14 demonstrated that offering fruit-smoothies (as opposed to whole-fruit, only) as part of a school breakfast program led to an increase in the number of adolescents consuming ≥1 serving of fruit (4.3 vs. 45.1%) and the number of fruit serves consumed (<0.1 vs. 0.6 serves·student-1). The authors proposed that, as a smoothie, fruit was likely to be more accessible (e.g. no peeling or chewing required) and appealing (i.e. resembling popular ‘dessert drinks’, such as milkshakes). Notably, the smoothies in is this study were made predominantly of fruit, whereas alternative beverage recipes may contain discretionary items (e.g. fruit juice, ice cream, honey and chocolate). The inclusion of discretionary choices could potentially increase the energy, saturated fat, and/or sugar content of smoothies, offsetting the benefits of fruit and/or vegetable consumption. Clearly, the contribution that smoothies make to the total dietary intake of individuals will depend on the frequency of consumption, the common ingredients they use and a consumer’s beliefs and attitudes towards their consumption. Understanding these factors will assist to clarify the role that smoothies play in the diet of individuals and inform the development of strategies to potentially improve diet quality.
Therefore, this study aimed to explore attitudes, beliefs and behaviours of smoothie consumers and non-consumers. Specifically, the study intended to: (1) describe patterns of smoothie consumption (i.e. the frequency and timing of consumption, place of purchase and common ingredients); and (2) understand why individuals choose to consume (or not consume) smoothies.
Materials and Methods
Participants, Eligibility Criteria and Recruitment
A cross-sectional online survey of Australian adults (≥18 y) was conducted between April and September of 2016 (128 days). Participants were recruited via general advertisements; using flyers, social media platforms (e.g. the University’s Facebook page), an electronic email-out to University staff/students, and convenience snowball sampling methods. As the number of individuals exposed to these avenues of advertisement was unknown, the survey response rate could not be calculated. The survey URL or matrix barcode (Quick Response CodeTM) directed volunteers to a Plain Language Statement and Statement of Implied Consent (based on survey completion). On entering into the survey, volunteers were prompted to indicate a country of residence and their current age. Individuals that were not currently residing in Australia or were <18 y of age were ineligible to participate and precluded from continuing the survey. Volunteers could exit and clear all survey responses at any time. This investigation was approved by the University’s Human Ethics Committee (GU Ref No: 2016/280) and procedures were conducted in accordance with the principles outlined by the agreement of Helsinki.
Survey Overview
The survey was developed and administered to the general public using a web-based research survey tool (LimeSurveyTM Version 1.9x). The final version contained 25 Likert Scale/Multiple Choice (MCQ) style questions (~10 min duration). Survey questions were piloted among University Nutrition and Dietetics staff (n=5) who were not part of the research team, to determine face validity (item retention and the articulation of wording). This process resulted in the formation of new questions and minor changes to structure and wording. Previous research indicates that, at the very least, research using now or previously unexamined scale items should be judged for face validity.15 The survey was designed in such a way that individual participants were promoted to respond to survey questions that were applicable, based on their prior responses. It was also broadly underpinned by the Health Belief Model16 with a particular focus on the ‘perceived benefits’ construct to explore why participants held certain views regarding smoothie consumption.
Survey Design
The survey was divided into 4 sections (Figure 1). Section 1 included demographic information (i.e. age, gender and educational attainment, weight and height (used to estimate BMI, kg·m-2). In section 2, MCQs were used to investigate smoothie-related behaviour(s). Participants were first prompted to indicate frequency of smoothie consumption. Individuals that reported consuming <1 smoothie·month-1 or more were categorised as Smoothie Consumers. These respondents were then directed to questions intended to derive information on timing of smoothie consumption, place of smoothie purchase, common ingredients (see 2.3.2 Smoothie Ingredients) and reason(s) for consuming these products. Non-Smoothie Consumers were asked to provide reason(s) for not consuming smoothies. Participants could select ≥1 response for each MCQ and use the ‘other’ field to provide an answer that was not part of the enumerated answer list (see 2.3.1 Generating MCQ Answer Lists). In section 3, 5-point Likert rating scales (1 = ‘strongly agree’ to 5 = ‘strongly disagree’, plus an ‘unsure’ alternative) were used to investigate smoothie-related attitudes/beliefs. Statements explored three domains: (1) perceived healthiness of smoothies; (2) energy content awareness and (3) expected satiety value (see 2.3.4 Expected Satiety Value). Section 4 was used to derive general nutrition-related information (i.e. perceived importance of a healthy diet, self-reported diet quality and nutrition knowledge). Respondents self-reported the perceived quality of their current diet, their nutrition knowledge and attitudes towards the importance of a healthy diet on 5-point Likert rating scales (1 = ‘very poor’/‘not important’ to 5 = ‘very good’/‘very important’). A three-point Likert rating scale (1 = ‘never’ to 3 = ‘always’) was used to gauge participant’s perceptions of their own awareness of dietary energy intake and whether they read nutrition labels on foods and beverages before purchasing items. Finally, individuals were asked to indicate if they held a nutrition-related qualification (e.g. vocational education or university degree).
Generating MCQ Answer Lists
Categories available in the MCQs investigating place of smoothie purchase/production included common food and beverage manufacturers/sellers, (e.g. cafés/restaurants/fast-food venues, supermarkets, smoothie bars, and home). When determining factors with the potential to influence smoothie purchasing decisions, previous literature (e.g. taste, cost, availability and popularity of a product 17) and health-/nutrition-related reasons (i.e. to be healthy, increase fruit and/or vegetable intake, increase nutrient intake, natural ingredients, weight loss or gain, and food allergies/intolerances, as a replacement to soft drink, to fill me up) were provided. Participants could also respond via an ‘other’ field to enter open text.
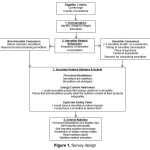 |
Figure 1: Survey design Click here to View figure |
Smoothie Ingredients
Two consecutive MCQs were used to derive information on common ingredients consumed in smoothies. Participants were able to select from the following items: fruit (fresh, frozen or canned), fruit juice, vegetables, milk, milk substitutes (e.g. rice, almond or soy milk), yoghurt, ice cream, nutritional supplements (any type), grains and cereals, nuts and seeds, nut butter, sugar, honey, artificial sweeteners, artificial flavours, chocolate, malt, milo, and eggs. In addition, participants could use the ‘other’ field to enter items that were not part of the pre-populated answer list. Initially, participants were required to select the ingredients found in the smoothie they most commonly consume (i.e. usual ingredients). Subsequently, participants selected ingredients they would sometimes consume in a smoothie (i.e. sometimes ingredients). As the question was intended to identify common ingredients, rather than determine energy content, a filter automatically removed ingredients that were selected on the initial question, so that duplication of ingredients was not possible.
Expected Satiety Value
Some evidence suggests that calorie-containing liquids are less satiating than solid food alternatives.18-20 However, soups do not appear to follow this pattern,21 with suggestions that the satiating properties of soup may be a consequence of the mindset that it is a meal component ingested to satisfy hunger, and not reduce thirst.21 Whilst smoothies appear to share some commonalities with soup (e.g. viscous consistency, containing whole-ingredients), it is unclear whether consumers have similar perceptions of smoothies regarding consumption for thirst or hunger. A series of Likert rating scales (5-point) were used to determine if respondents would consume a smoothie for the purpose of relieving hunger and for the purpose of relieving thirst (i.e. agree/disagree).
Data Analysis
Data were analysed using SPSS for Windows version 23.0 (SPSS, Chicago, Illinois, USA). All categorical variables were described by frequency (%). Numeric data (i.e. weight, height and BMI) were screened for irregularities and n=4 cases were removed (n=2 weight >1000 kg; n=2 height = 5.2 m and 55 cm). Calculated BMI values were separated into underweight (<18.5 kg·m-2), healthy weight (18.5 – 25.0 kg·m-2) and overweight/obese (≥25.0 kg·m-2) categories. Responses to 5-point Likert Scale questions were collapsed into the following three categories: (1) strongly agree/agree; (2) strongly disagree/disagree and (3) unsure/neutral to ensure 80% of cell counts met the assumption for expected frequency of ≥5. Cross-tabulation and chi-square tests for association were used to compare survey responses by frequency of smoothie consumption. One-way analysis of variance (ANOVA) was used to compare continuous variables (i.e. BMI) by frequency of smoothie consumption. Significant F-ratios were explored using the Tukey post-hoc test. Individuals that consumed <1 smoothie·month-1 or more who were previously categorised as Smoothie Consumers, were further sub-categorised into Frequent Smoothie Consumers (F-SC, ≥1·week-1) and Infrequent Smoothie Consumers (I-SC, <1·week-1). Statistical significance was set at p < 0.05 for all associations.
Results
Participant Demographics
Of the 964 individuals that volunteered to take part in this study, n=12 (1.2%) were ineligible to participate and precluded from continuing the survey (n=7 aged <18 y; n=5 not residing in Australia). Survey data from a further 119 respondents (11.2%) were incomplete and subsequently excluded from the analysis. The final participant sample comprised of 833 complete survey respondents. Participant characteristics are summarised in Table 1.
Table 1: Characteristics of smoothie study participants (n=833)
| Variable | Participantsn (%) |
| Age group (y) | |
| 18 – 24 | 409 (49.1) |
| 25 – 34 | 255 (30.6) |
| 35 – 44 | 82 (9.8) |
| 45 – 54 | 55 (6.6) |
| 55 – 64 | 28 (3.4) |
| 65 – 74 | 4 (0.5) |
| Gender | |
| Male | 175 (21.0) |
| Female | 658 (79.0) |
| BMI (kg·m-2) | |
| <18.5 | 45 (5.4) |
| 18.5 – 25.0 | 518 (62.5) |
| ≥25.0 | 266 (32.0) |
| Mean±SD | 24.1±4.9 |
| Highest level of education | |
| High school grade 10 | 5 (0.6) |
| High school grade 12 | 313 (37.6) |
| Trade/Vocational training | 104 (12.5) |
| Bachelor’s degree | 263 (31.6) |
| Postgraduate degree | 148 (17.8) |
| Nutrition-related qualification | |
| Yes | 42 (5.0) |
| No | 791 (95.0) |
Nb. BMI calculated for n=829 participants that reported height and weight values without noticeable irregularities.
Smoothie Consumption: Behaviour
Frequency of Smoothie Consumption
Overall, 783 (94.0%) participants were categorised as Smoothie Consumers (<1·month-1 or more) (Table 2). Of these, 269 (32.3%) were F-SC (≥1·week-1) and 514 (61.7%) were I-SC (<1·week-1). A total of 50 (6.0%) participants were categorised as Non-Smoothie Consumers. F-SC was associated with female gender (χ2=6.48, p=0.039) and younger age (χ2=47.0, p<0.001). BMI did not differ significantly across F-SC, I-SC and Non-Smoothie Consumers, F(2,828)=2.71, p=0.067 (F-SC: 23.5±4.2 kg·m-2; I-SC: 24.4±5.1 kg·m-2; Non-Smoothie Consumers: 24.6±5.2 kg·m-2).
Table 2: Frequency of smoothie consumption by participants completing online survey (n=833)
| Groupn (%) | Frequency | Participants n (%) |
| F-SC269 (32.3) | ≥1·day-1 | 55 (6.6) |
| 4 – 6·week-1 | 57 (6.8) | |
| 1 – 3·week-1 | 157 (18.9) | |
| I-SC514 (61.7) | ≥1·fortnight-1 | 169 (20.3) |
| ≥1·month-1 | 165 (19.8) | |
| <1·month-1 | 180 (21.6) | |
| N-SC50 (6.0) | Never | 50 (6.0) |
F-SC: Frequent smoothie consumers (≥1 smoothie·week-1); I-SC: Infrequent smoothie consumers (<1 smoothie·week-1); N-SC: Non-smoothie consumers.
Location and Timing of Smoothie Consumption
The majority of Smoothie Consumers reported having smoothies as a snack (i.e. between meals) (n=511, 65.3%); breakfast (without other food) (n=303, 38.7%); as a meal accompaniment (n=159, 20.3%) and/or for lunch (without other food) (n=96, 12.3%). Smoothies were rarely consumed at dinner without other food (n=15, 1.9%). When compared to I-FC, F-SC were significantly less likely to consume smoothies as a snack (n=133, 49.4% vs. n=378, 73.5%; χ2=45.2, p<0.001), but significantly more likely to consume smoothies as a breakfast (without other food) (n=153, 56.9% vs. n=150, 29.2%; χ2=57.1, p<0.001) and as a meal accompaniment (n=69, 25.7% vs. n=90, 17.5%; χ2=7.23, p=0.007). No other significant differences were observed between groups. Whilst Smoothie Consumers commonly reported purchasing these products from smoothie bars (n=425, 54.3%) and cafés/restaurants/fast food venues (n=154, 19.7%), the majority were produced at home (n=531, 67.8%). Few Smoothie Consumers selected products that were pre-made (i.e. purchased from supermarkets) (n=54, 6.9%).
Reasons for Smoothie Consumption
The majority of Smoothie Consumers reported “like the taste” as a reason for consumption (n=656, 83.8%) (Figure 2). When compared to I-FC, F-SC were significantly more likely to consume smoothies for health-related reasons, such as “to increase my fruit and vegetable intake” (n=153, 56.9% vs. n=174, 33.9%; χ2=38.5, p<0.001), “to be healthy” (n=149, 55.6% vs. n=151, 29.4%; χ2=50.6, p<0.001), “to increase my nutrient intake” (n=135, 50.2% vs. n=113, 22.0%; χ2=64.9, p<0.001), “due to their natural ingredients” (n=63, 23.4% vs. n=81, 15.8%; χ2=6.9, p=0.009) and “to lose weight” (n=36, 13.4% vs. n=31, 6.0%; χ2=12.2, p<0.001). A greater proportion of F-SC also perceived smoothie consumption as time-saving (n=135, 50.1% vs. n=160, 31.1%; χ2=27.3, p<0.001), convenient (n=97, 36.1% vs. n=143, 27.8%; χ2=5.64, p=0.018) and good value for money (n=27, 10.0% vs. n=27.8, 5.3%; χ2=6.30, p=0.012), compared to I-SC. No other significant differences were observed between groups. Other reasons Smoothie Consumers cited for consumption included: to replace meals (n=4), an alternative to other sweet foods (e.g. ice cream, chocolate, dessert) (n=4) or coffee (n=2), to use up expiring products (n=3), as a nutrition pre-/post-workout (n=2), to be enjoyed whilst socialising/shopping (n=2), vehicle for nutritional supplements (n=1), to relieve thirst (n=1), to prevent illness (e.g. cold/flu) (n=1), as a food “reward” (n=1) and to manage hot weather (n=1). Non-Smoothie Consumers commonly reported “I prefer to eat whole food” (n=25, 50.0%); “I think they are unhealthy” (n=20, 40.0%), “Not interested” (n=19, 38.0%), “Don’t like them” (n=16, 32%) and “Too much hassle to make” (n=15, 30%) as the main reasons for avoiding smoothies.
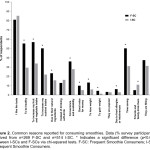 |
Figure 2: Common reasons reported for consuming smoothies. Data (% survey participants) derived from n=269 F-SC and n=514 I-SC. * Indicates a significant difference (p<0.05) between I-SCs and F-SCs via chi-squared tests. F-SC: Frequent Smoothie Consumers; I-SC; Infrequent Smoothie Consumers. Click here to View figure |
Common Smoothie Ingredients
A high proportion of Smoothie Consumers ‘usually’ or ‘sometimes’ had smoothies containing fruit (including fresh, frozen and/or canned) (n=770, 98.3%), yoghurt (n=519, 66.3%), milk (n=457, 58.4%), honey (n=406, 51.9%) fruit juice (n=361, 46.1%) and/or nutrition supplements (n=361, 46.1%) (Figure 3). Compared to I-SC, F-SC were more likely to consume smoothies containing vegetables (n=107, 39.8% vs. n=106, 20.6%; χ2=32.7, p<0.001), milk substitutes (e.g. rice, almond or soy milk) (n=85, 31.6% vs. n=103, 20.0%; χ2=12.9, p<0.001), nutrition supplements (n=119, 44.2% vs. n=108, 21.0%; χ2=46.3, p<0.001), nuts and seeds (n=109, 40.5% vs. n=110, 21.4%; χ2=32.0, p<0.001), nut butters (n=23, 8.6% vs. n=23, 4.5%; χ2=5.30, p=0.021) and eggs (n=15, 5.6% vs. n=14, 2.7%; χ2=4.03, p=0.045), and less likely to consume smoothies that ‘usually’ contained fruit juice (n=51, 19.0% vs. n=194, 37.7%; χ2=29.0, p<0.001), milk (n=91, 33.8% vs. n=253, 49.2%; χ2=17.0, p<0.001), yoghurt (n=113, 42% vs. n=287, 55.8%; χ2=13.5, p<0.001), ice cream (n=31, 11.5% vs. n=105, 20.4%; χ2=9.8, p=0.002), and honey (n=68, 25.3% vs. n=173, 33.7%; χ2=5.82, p=0.016). No other significant differences were observed between groups. Smoothie Consumers ‘usually’ or ‘sometimes’ had smoothies containing ingredients that were not indicated on the pre-determined list, including: coconut water (n=22), herbs/spices (n=19), cacao powder (n=9), oil (e.g. coconut, flaxseed and hempseed) (n=7), sorbet (n=4), cream (n=2) and tea/coffee (n=2).
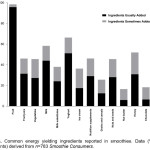 |
Figure 3: Common energy yielding ingredients reported in smoothies. Data (% survey respondents) derived from n=783 Smoothie Consumers Click here to View figure |
Smoothie Consumption: Attitudes and Beliefs
Perceived Healthiness
Overall, the majority of participants agreed with the statement that “smoothies are nutritious” (n=552, 66.3%), with higher rates of agreement detected amongst F-SC (n=225, 83.6%; χ2=89.8, p<0.001) than I-SC (n=307, 59.7%) and Non-Smoothie Consumers (n=20, 40.0%). A large proportion of participants also agreed with the statement “smoothies are indulgent” (n=460, 55.2%). However, subsequent analyses revealed a significantly smaller proportion of F-SC held this belief (n=115, 42.8%; χ2=41.8, p<0.001), compared to I-SC (n=316, 61.5%) and Non-Smoothie Consumers (n=29, 58%).
Energy Content Awareness
A low percentage of respondents indicated that they would be able to “accurately predict the energy content of a smoothie” (n=206, 24.7%). A greater proportion of F-SC were confident in their ability to determine the energy content of smoothies (n=83, 30.9%; χ2=26.7, p<0.001) compared to I-SC (n=108, 21.0%) and Non-Smoothie Consumers (n=13, 25.0%), Furthermore, a high proportion of F-SC disagreed with the statement “smoothie vendors label the nutrition content of their products adequately” (disagree: n=121, 45.0%; agree: n=62, 23.0%; neutral/unsure: n=86, 28.4%).
Expected Satiety Value
A high proportion of Smoothie Consumers agreed with the statements that they would “consume a smoothie to relieve hunger” (n=602, 76.9%). In contrast, a lower proportion of Smoothie Consumers agreed with the statement that they would “drink a smoothie to relieve thirst” (n=298, 38.1%). F-SC were more likely to agree that they would consume a smoothie to relieve hunger (n=225, 83.6% vs. n=377, 73.3%; χ2=12.7, p=0.002) and less likely to agree that they would consume a smoothie to relieve thirst (n=85, 31.6% vs. n %; χ2=7.26, p=0.026) than I-SC.
General Nutrition
Compared to I-SC and Non-Smoothie Consumers, F-SC self-reported greater importance of a healthy diet (χ2=55.6, p<0.001), were more likely to perceive their diet as ‘good’ or ‘very good’ (χ2=61.2, p<0.001), were more likely to rate their nutrition knowledge as ‘good’ or ‘very good’ (χ2=28.8, p=0.001), reported that they were more likely to be aware of the calorie content of the foods and beverages consumed (χ2=29.2, p<0.001) and a higher likelihood of reading the nutrition information panel on product labels (χ2=33.2, p<0.001). F-SC were no more likely than I-SC and Non-Smoothie Consumers to hold a nutrition-related qualification (χ2=1.03, p=0.597).
Discussion
This study explored the attitudes, beliefs and behaviours of Smoothie Consumers and Non-Smoothie Consumers to better understand patterns of smoothie consumption (i.e. the frequency/timing of consumption, place of purchase and common ingredients), individual motives for consuming (or not consuming) smoothies, and the contribution that smoothies make to individuals dietary intake. Results indicate that smoothies are commonly consumed dietary products amongst participants, with only 50 respondents (6%) categorized as Non-Smoothie Consumers (Table 2). Most smoothies were reported to contain fruit, as well as a wide variety of other ingredients (Figure 3). The different ingredients are likely to result in major differences in nutrient profiles between beverages. The frequency of smoothie consumption appeared to influence typical ingredients used and the attitudes/motivations individual’s held towards the role smoothies served in their diet.
The high prevalence of Smoothie Consumers in the present study is likely (in part) an artefact of the low threshold-limit (<1 smoothie·month-1, as a minimum) applied to categorise participants. In addition, the nature of the study (an online nutrition-related survey) likely contributed to an over-representation of Smoothie Consumers, females (79%) and young adults (18–34 y) (80%) in the survey sample. Thus, results with respect to Non-Smoothie Consumers attitudes, beliefs and behaviours should be interpreted with caution. Likewise, generalization of these results to a broader population (including different demographic groups, e.g. older individuals, males) may not be appropriate. Nonetheless, with almost one-third of Smoothie Consumers drinking the beverages weekly, and similar rates identified by commercial studies involving nationally-representative participant samples,22 smoothies are clearly popular dietary products.
Previous research has identified a variety of motivations (e.g. attitudes, beliefs, opportunity, health concerns and nutrition knowledge) influence dietary choices.23-25 In the present study, motives for consuming smoothies varied based on frequency of smoothie consumption. Thus, it appears that smoothies may play different roles in the diets of those who consume the beverages frequently (≥1·week-1) and infrequently (<1·week-1). While taste was reported as the primary reason for smoothie consumption by both F-SC and I-SC (Figure 2), the F-SC were significantly more likely to consume the beverages for “health-related reasons” (i.e. to increase fruit and vegetable or nutrient intake, to lose/gain weight, and to be “healthy”) and because they were convenient/time-saving. F-SC were also more likely to perceive smoothies as “nutritious”, whilst I-SC were more likely to indicate that the beverages were “indulgent”. Furthermore, F-SC were more likely to be health conscious and have a greater perception of their own nutrition knowledge, despite not being more likely to hold a formal nutrition-related qualification. Whether these factors are influential in driving the frequency of smoothie consumption cannot be determined on the basis of these data. However, these perceptions may influence ingredients that individuals select for inclusion in their smoothies (as indicated in the present study). Understanding the common ingredients individuals use to formulate smoothies is important (particularly when these beverages are consumed frequently), because they may make a significant contribution to an individual’s dietary (and total energy) intake and influence overall dietary consumption patterns.
Results from the present study indicate that smoothies can contain a wide variety of ingredients (Figure 3). The overwhelming majority of Smoothie Consumers (96%) reported having beverages that ‘usually’ contained fruit (i.e. fresh, frozen and/or canned). Whilst fewer individuals consumed smoothies that contained vegetables (27%), these were still a common ingredient for F-SC (40%). Many participants also reported consuming smoothies that contained dairy foods (i.e. yoghurt, milk and/or milk alternatives), with 77% of Smoothie Consumers ‘usually’ incorporating ≥1 of these ingredients. Data from the Australian Health Survey (2011–12)3 indicate that the vast majority of adults (≥19 y) consume less than the recommended amount of fruit (M: 71%; F: 77%), vegetables (M: 97%; F: 95%); and dairy foods (i.e. milk, yoghurt, cheese and/or alternatives) (M: 90%; F: 97%) per day.2 Poor intakes have also been observed in the USA5 and UK.4 Data from the present study suggest that smoothies are likely to represent an important source of core foods for some individuals and may provide a practical, tasty and convenient way to assist others with incorporating more fruit, vegetables and dairy foods into their diets. To date, only one study14 has investigated the efficacy of smoothies to deliver core foods. This study found that offering adolescents fruit smoothies (as compared to whole-fruit, only) as part of a school breakfast program increased the proportion of students consuming ≥1 fruit serving (4.3 vs. 45.1%) and the total number of fruit servings consumed (<0.1 vs. 0.6 serves·student-1), supporting a role for smoothies in improving the dietary patterns of individuals. However, these smoothies were prepared by school staff and did not contain vegetables. Hence, further research is required to determine if smoothies increase core food consumption in situations where individuals are responsible for preparing or purchasing their own beverages, and when vegetables are used as ingredients (since these may affect the palatability of smoothies).
In the present study, 42% of F-SC and 65% of I-SC ‘usually’ had smoothies that contained ≥1 “discretionary” items (Figure 3) (i.e. fruit juice, honey, ice cream and/or chocolate); with fruit juice and honey comprising >85% of all incidences. While the Australian Dietary Guidelines2 indicate that juice is a “fruit” rather than a “discretionary” food per se, evidence suggests that Australians consume too much juice26; which can be high in energy, low in dietary fibre and contribute to poor dental health.3 Thus, these ingredients may offset the benefits of consuming core foods by increasing consumers’ caloric and/or sugar intakes. There may be several reasons why fruit juice and honey are commonly consumed in smoothies. For one, their sweet taste and sugar content may enhance beverage palatability and disguise undesirable flavours (e.g. bitterness from vegetables27). The fact these ingredients are often “fixed” into menu items sold by commercial manufacturers may also explain their prevalence. Indeed, on re-examination of the data, the inclusion of fruit juice (χ2=152, p<0.001) and honey (χ2=14.7, p<0.001) in smoothies was found to be strongly associated with purchasing products from smoothie bars, but not when smoothies were prepared in the home (p’s>0.05). One other factor to consider is that individuals may be unaware of the caloric or sugar content of these items. Nonetheless, despite smoothies providing an opportunity to consume foods and nutrients that are often inadequate in the diet, the ongoing public health challenges associated with overweight and obesity28 dictate that consideration must also be given to the total caloric and/or sugar intake derived from these popular beverages. That is, the benefits of increasing fruit and vegetable consumption with smoothies may be offset by increased calorie intake, particularly if smoothies are consumed in addition to usual dietary intake. Indeed, results from the current study indicate that smoothies are most commonly consumed as snacks (i.e. between meals). Prior research suggests that individuals may not modify their dietary behaviour at a subsequent meal to compensate for additional energy derived from snacks.29
Whilst data from the present study do not allow us to predict the average energy content of smoothies consumed, typically smoothies purchased or made at home contain multiple energy-yielding ingredients. From a practical perspective, it would be highly unusual for an individual to consume all the ingredients used in a smoothie as separate components in a single sitting. Yet, smoothies provide a medium where these multiple ingredients can be combined into a single product to be consumed in a short timeframe. Thus, studies should examine appetitive responses to smoothie beverages. Indeed, one benefit of fruit and vegetable consumption is that it induces satiety.30 This effect may be attenuated when solid ingredients are reduced to a liquid state. While no studies have investigated appetitive responses to smoothies specifically, there is evidence to suggest that liquids may be less satiating than nutritionally-comparable solid and semi-solid foods, possibly due to several physiological factors (e.g. increased rate of ingestion, reduced mastication, and increased rate of gastric emptying).31 Individuals may be particularly reliant on these internal cues to regulate energy intake from smoothies, seeing as survey respondents reported having difficulty estimating their energy content (perhaps because of the manner in which smoothies are typically produced, i.e. by blending multiple different ingredients in varying quantities). A reduction in satiation with isocaloric liquids vs. solids has also been attributed to the perception that liquids are primarily consumed to satisfy thirst and foods are largely ingested to satisfy hunger.21 Whilst a large proportion of participants in the current study perceived smoothies cognitively as a “food” ingested to supress hunger, many also viewed smoothies as “beverages”, which they consumed to satisfy thirst. Despite a need for further research to obtain a better understanding of the satiating responses to smoothie beverages, the collective evidence to date suggest that the manner in which smoothies are typically produced (i.e. blending several different energy-yielding ingredients) is likely to be conducive to increasing energy intake. Hence, additional research is required to clarify the role smoothies play in the overall dietary patterns of individuals.
Conclusion
This study indicates that smoothies are frequently consumed beverages, often made using a combination of ingredients. Smoothies appear to play a positive role in the diet of some individuals; promoting increased consumption of core foods (e.g. fruit, vegetables and dairy products). However, smoothies may also contain discretionary ingredients that could promote increased calorie intake, especially if they are consumed as snacks and subsequent compensatory dietary behaviours are not employed. With overweight/obesity remaining a major public health issue, understanding how popular snack foods and beverages (such as smoothies) contribute to caloric intake and influence broader dietary behaviours is important.
Acknowledgements
The authors declare no conflicts of interest. This research received no specific grant from any funding agency, commercial or not-for-profit sectors.
References
- Australian Institute of Health and Welfare. Australia’s Health 2014. Canberra. 2014.
- National Health and Medical Research Council. Australian Dietary Guidelines. Canberra. 2013.
- Australian Bureau of Statistics. Australian Health Survey: Consumption of Food Groups from the Australian Dietary Guidelines, 2011-12. Canberra. 2016.
- Public Health England. National Diet and Nutrition Survey Results from Years 5 and 6 (combined) of the Rolling Programme (2012/2013 – 2013/2014). 2017.
- National Cancer Institute. Usual Dietary Intakes: Food Intakes, U.S. Population. 2007-10.
- Dauchet L, Amouyel P, Dallongeville J. Fruit and Vegetable Consumption and Risk of Stroke: A Meta-analysis of Cohort Studies. Neurology. 2005;65(8):1193-1197.
CrossRef - Dauchet L, Amouyel P, Hercberg S, et al. Fruit and Vegetable Consumption and Risk of Coronary Heart Disease: A Meta-analysis of Cohort Studies. Journal of Nutrition. 2006; 136(10):2588-2593:.
CrossRef - Nguyen B, Bauman A, Gale J, et al. Fruit and Vegetable Consumption and All-Cause Mortality: Evidence from a Large Australian Cohort Study. International Journal of Behavioral Nutrition and Physical Activity. 2016;13:9.
CrossRef - Wang X, Ouyang Y, Liu J, et al. Fruit and Vegetable Consumption and Mortality From All Causes, Cardiovascular Disease, and Cancer: Systematic Review and Dose-Response Meta-analysis of Prospective Cohort Studies. British Medical Journal. 2014; 349:g4490.
CrossRef - Krueger H, Koot J, Andres E. The Economic Benefits of Fruit and Vegetable Consumption in Canada. Canadian Journal of Public Health. 2017;108(2):e152-e161.
- Derbyshire E. Where are we with Smoothies? A Review of the Latest Guidelines, Nutritional Gaps and Evidence. Journal of Nutrition & Food Sciences. 2017; 7(5):1-5.
CrossRef - Gehtman D. Smoothies – Market Intelligence Report. Mintel Group. 2008.
- Technavio. Global Smoothies Market 2016-2020. Technavio. 2016.
- Bates D, Price J. Impact of Fruit Smoothies on Adolescent Fruit Consumption at School. Health Education & Behavior. 2015;42(4):487-492.
CrossRef - Hardesty DM, Bearden WO. The Use of Expert Judges in Scale Development: Implications for Improving Face Validity of Measures of Unobservable Constructs. Journal of Business Research. 2004; 57(2):98-107.
CrossRef - Rosenstock IM. The Health Belief Model and Preventive Health Behavior. Health Education Monographs. 1974;2(4):354-386.
CrossRef - Glanz K, Basil M, Maibach E, et al. Why Americans Eat What They Do: Taste, Nutrition, Cost, Convenience, and Weight Control Concerns as Influences on Food Consumption. Journal of the American Dietetic Association. 1998;98(10):1118-1126.
CrossRef - Almiron-Roig E, Chen Y, Drewnowski A. Liquid Calories and the Failure of Satiety: How Good is the Evidence? Obesity Reviews. 2003;4(4):201-212.
CrossRef - Dhillon J, Running CA, Tucker RM, et al. Effects of Food Form on Appetite and Energy Balance. Food Quality and Preference. 2016;48:368-375.
CrossRef - Mars M, Hogenkamp PS, Gosses AM, et al. Effect of Viscosity on Learned Satiation. Physiology & Behavior. 2009;98(1-2):60-66.
CrossRef - Mattes R. Soup and Satiety. Physiology & Behavior. 2005;83(5):739-747.
CrossRef - Safefood. Smoothies: Consumer Knowledge, Attitudes and Beliefs around the Nutritional Content of Smoothies. 2009.
- Sun YH. Health Concern, Food Choice Motives, and Attitudes Toward Healthy Eating: The Mediating Role of Food Choice Motives. Appetite. 2008;51(1):42-49.
CrossRef - Machín L, Giménez A, Vidal L, et al. Influence of Context on Motives Underlying Food Choice. Journal of Sensory Studies. 2014;29(5):313-324.
CrossRef - Block JP, Gillman MW, Linakis SK, et al. “If it Tastes Good, I’m Drinking It”: Qualitative Study of Beverage Consumption Among College Students. Journal of Adolecent Health. 2013; 52(6):702-706.
CrossRef - Singh GM, Micha R, Khatibzadeh S, et al. Global, Regional, and National Consumption of Sugar-Sweetened Beverages, Fruit Juices, and Milk: A Systematic Assessment of Beverage Intake in 187 Countries. PLoS One. 2015; 10(8):e0124845.
- Mennella JA, Reed DR, Mathew PS, et al. “A Spoonful of Sugar Helps the Medicine Go Down”: Bitter Masking by Sucrose Among Children and Adults. Chemical Senses. 2015;40(1):17-25.
CrossRef - Australian Bureau of Statistics. 4364.0.55.003 Australian Health Survey: Updated Results. 2014; 2011–2012.
- de Graaf C. Effects of Snacks on Energy Intake: An Evolutionary Perspective. Appetite. 2006;47(1):18-23.
CrossRef - Chambers L, McCrickerd K, Yeomans MR. Optimising Foods for Satiety. Trends in Food Science & Technology. 2015;41(2):149-160.
CrossRef - 31. McCrickerd K, Forde CG. Sensory Influences on Food Intake Control: Moving Beyond Palatability. Obesity Reviews. 2016;17(1):18-29.
CrossRef
Scopus Citation(s): 16
Accepted on: 04-06-2018
Second Review by: Dr. Bekir DEMİRTAS (Turkey)
Final Approval by: Prof. Min-Hsiung Pan


Web of Science Coverage
Emerging Sources Citation Index (ESCI)
2024 Journal Impact Factor: 1.1
Scopus Journal Metrics
CiteScore 2025: 2.6
CiteScore Details
Sustainable Nutrition: Food Systems, Nutrient Retention, and Public Health Impact
![]()
This journal is a member of, and subscribes to the principles of, the Committee on Publication Ethics (COPE)


