Nutritional Status of Elderly in the Old Age Homes: A Study in Pune City
Chaitra Vinod Khole1*
1School of Health System Studies, Tata Institute of Social Sciences, Mumbai, India, 400088
2Centre for Health and Mental Health, School of Social Work, Tata Institute of Social Sciences, Mumbai, India, 400088.
Corresponding Author Email: chaitrakhole@gmail.com
DOI : http://dx.doi.org/10.12944/CRNFSJ.6.1.27
Download this article as:
![]()
Nutrition is one of the key factors associated with the health and overall well being of every individual. Considering the elderly population which has increased on account of demographic transition, it has been observed that there has been a transition in terms of caregiving and living arrangement. One such arrangement which needs attention is the Old Age Homes (OAHs). Although there’s uniformity in institutional setting, heterogeneity in terms of social, economic, physical and psychosocial factors affect the dietary intake among the elderly population. Thus, it is important to question the nutrition status of the elderly in institutional setting. The main objective of this study was to assess the nutrition status among the elderly in OAHs in Pune city and compare their dietary intake with the recommended dietary allowance (RDA). A purposive sampling design framework with inclusion and exclusion criteria was used to identify the respondents for the study. A sample size of 131 elderly was assessed. The tool used for assessment included 24 hour dietary recall and anthropometry and analysed using SPSS. About 46 percent suffered from malnutrition in the form of under and overnutrition, 11.5 percent were underweight, 26.2 percent were overweight and the rest of them belonged to Grade I and Grade II obesity. The study indicated high prevalence of malnutrition among the elderly living in the OAHs. This indicates there is a need to promote healthy eating habits at an institution level.
KEYWORDS:Elderly; Institutional setting; Malnutrition ; Nutrition status; Old age homes
Introduction
Health and well being depend of any individual on various factors like physical, social, psychological and nutritional factors. Nutrition plays an important role as a determinant in contributing to the well being and quality of life of an individual. It can be stated that health of the population at large is determined by the economic and human development of the place where they live in. Similarly the economic development is determined by the health of the individual proving it to have a cause and effect relationship. The Centres for Disease Control (CDC) and other groups have carried out substantial research for proving a significant relationship between nutritional choice (intake) and health ailments like hyperinsulinaemia, hypertension, dyslipidaemia, coronary heart disease and type 2 diabetes[i]. This proves that nutrition is now acknowledged as an important aspect in determining the health status of the individual.
According to the Population census carried out in 2011, the elderly in India comprises of about 103.9 million out of which 51.1 million and 52.8 million are males and feamles respectively. The elderly contribute of about 8.6 percent of the entire population, out of which 8.2 percent are males and 9 percent feamles.1 The number of eldelry population in Maharashtra (Western region) constitutes to about 9.9 million, out of them 4.7 million are men and 5.2 million are women which is more than the national average of the country and majority of them live in rural areas. It is estimated that among every elderly in the country, 1 in 10 is from Maharashtra.2 With a steady increase in life expectancy there is trend in terms of a gradual shift in the disease pattern from infectious diseases to non communicable or chronic diseases, this is also called as epidemiological transition.3
Studies suggest ‘age’ as a powerful predictor of state of individual’s health and associated risks of mortality and morbidity, other factors include diversity in terms of health status/ health trajectories, life course, environment (pollution/ accessible infrastructure) and behaviors patterns and predictors like genetic factors, individual factors like occupation, income status, education cause variability in the health status. The World Health Organisation (WHO) states the mechanisms of ageing (elderly) and health status as complex.1
The elderly experiences an array of problems which can be categorised as social, economic, health and pscyological. Some serious issues that have to be addressed include poverty, social insecurity, food insecurity and health problems including malnutrition which is seen at an alarming rate. Other problems faced by elderly are lack of income, irregularity in facilities providing any allowances causing absence of finances, causing illness, health deterioration causing inability to work and also loneliness (caused due to abandonment of the family members).2
Its important to understand the nutrition status of the elderly. Nowson (2007) enlisted some of the nutritional challenges faced by the eldelry. They included vulnerability, unintentional weight loss, chronic illnesses, disabilities, increased protien, vitamib B6, calcium and vitamin D requirements and reduced energy requirements.3 A study was carried out in Chandigarh, Northern India wherein assessment of obesity was carried out among elderly participants (n=362) . The results concluded 33 percent elderly to be overweight, 8 percent to be obese and 14 percent to be underweight.4 Another study was carried out in South India to assess the prevalence of malnutrition among the rural elderly (n=227), about 14 percent were malnourished and 49 percent were at a risk of malnourishment.5 Taking into account social factor, caregiver/caregivng is one of the most important aspect of the elderly’s health. Jamuna (1999) cited that India has three types of caregivers; spouse, adult married children with their families and institutional care. The National Sample Survey Office (NSSO) reported about three-forth of the elderly are supported by their own children, 7 per cent and 11 per cent of women were supported by their spouses and 8 percent and 12 percent were supported by institutional care. Another study reported \ 71 per cent of the elderly live with their children (family care), 26.3 percent live by themselves and with spouse and about 2.73 percent live with institutional support.6 Living in a joint family system was associated with favorable outcome in elderly suffering from depression.7 The nuclearisation of the family due to pressure of modern and industralised lifestyle has caused delerious effects on the elderlys life. Thus old age homes is one of the alternative of the living arrangement for the elderly. The reasons for opting to live in an institutitional are varied. Bothra (2011) quoted Jamuna (1998) the majors reasons for opting for institutional caregiving is due to low economic status, widowhood, destitute conditions, abuse by family members and lack of support by social networks.8 Payette (2000) conducted study to assess the role of nutrition status on 288 elderly participants. Factors like anthropometric measurements, socio-demographic factors, social network variables, functional and health status were measured. It was observed that with the number of elderly living in any kind of ‘institutional setting’ had an impact on their nutrition status. The elderly faced weight loss, limited capacities and reduced functional capability which controls social network, health and functional status.9 In a study it was shown that the prevalence of malnutrition was higher in case of people who stayed in the old ages home as compared to the people who lived in their own houses. The tools used for this study included assessment using Mini Nutrition Assessment (MNA), Dietary assessment- questions related to number of meals, food and fluid intake, anthropometric assessment- Height (Ht), Weight (Wt), Mid-Upper Arm Circumference (MUAC), Calf Circumference (CC), triceps skin fold thickness, Body Mass Index (BMI) and general assessment- questions related to lifestyle, medication and mobility and subjective assessment- self perception of health and nutrition.10 A similar study was carried out in an OAH in Lucknow and it observed that 51.67 percent elderly were malnourished considering the anthropometric measurements alone with higher numbers in males.11 A similar study on assessment of nutritional status among the elderly living in the old age home was carried out in South Africa, it was reported that out of the 210 sample size, 6 per cent were identified as malnourished and 47 per cent were reported to have at risk of malnutrition (ibid). A number of important assumptions and policy objectives underpin the need for the present study. One of the objectives of the Millennium Development Goals (MDG) is to provide the minimum required amount of energy to the individual. In the context of the elderly and OAH, the role of the OAH is to provide not only shelter but also provide physical, psychological, nutrition and health care to the elderly. Nutrition plays an important role in determining the health and well being of the elderly. This study examines the nutrition status of the elderly residing in the Old Age Home in Pune, Maharashtra with respect to their nutrient intake.
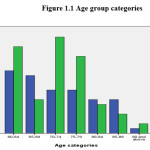 |
Figure 1.1: Age group categories Click here to View figure |
Objectives
- To assess nutrition status among the elderly population aged ≥ 60 years living in OAHs in Pune city
- To assess and compare the dietary intake with the recommended dietary allowance (RDA)
Methodology
Study type
A cross sectional study. Quantitative research methodology is adopted for this study using a survey method.
Research design
Descriptive study
Study Population
150 elderly respondents of age ≥60 years living in OAHs
Inclusion criteria
Elderly both male and female aged ≥ 60 years, who are mobile and living in OAHs
Exclusion criteria
Elderly who have any form of disability and those who do not give consent for the study
Study sample size
The sample size was derived using a thumb rule of representative sample. The participants were selected using purposive sampling. After discussing the number of elderly in each OAH an approximate number of 1500 elderly was concluded. Out of this total number (1500), 1/10th sample was selected as it is a representative sample for the study, which accounted to 150 participants (n=150). There was heterogeneity maintained among the different OAHs taking into consideration various religions, castes, rural or urban population, paid and unpaid services and involvement of both the genders. Out of the 150, the data was then entered and incomplete data responses were discarded during the analysis, the data then was 131 participants. During data collection it was generally observed that feamles outnumbered males. A total of 73 feamles and 58 males aged 60 years and above were enrolled in the study.
Table 1.1: Dietary intake of the elderly
| Macronutrients | Male | Female | Total | ||||||
| Mean (gms) | Range | % | Mean (gms) | Range | % | Mean (gms) | Range | % | |
| Carbohydrates | 213.28± 51.22 | 162.06- 264.5 | 59.04-62.40 | 199.03± 60.06 | 138.97- 259.09 | 61.08-64.76 | 205.34± 56.56 | 148.78-261.9 | 60.08-63.75 |
| Proteins | 37.86± 11.54 | 26.32- 49.4 | 10.13-11.02 | 34.66 ± 12.0-2 | 22.64- 46.68 | 10.55-11.00 | 36.08± 11.88 | 24.2- 47.96 | 10.37-11.00 |
| Fats | 45.47 ± 16.89 | 28.58- 62.36 | 24.71-31.32 | 44.6 ± 17.5 | 27.09- 62.11 | 28.40-32.94 | 45.00 ± 17.18 | 27.82- 62.18 | 26.82-32.09 |
| Energy | 1415.34 ± 376.54 | 1038.8- 1791.88 | NA | 1277.45 ± 419.1 | 858.33- 1696.57 | NA | 1338.50 ± 05.119 | 933.38- 1743.66 | NA |
Sampling method
Purposive sampling
Methodology for data collection
Data collection was done after getting permission from the OAH and written consent of the respondent. All the respondents above 60 years were explained about the purpose of the study and where assured that their response would be confidential. The respondents who consented to participate, written consent was obtained and further survey was carried out in local language in a quiet place. Survey method was used for data collection.
Table 1.2: BMI
| Men (mean) | Women (mean) | Mean | |
| Weight | 55.56 ± 10.4 | 49.827 ± 11.17 | 52.36 ± 11.20 |
| Height | 162.47 ± 7.9 | 147.56 ± 7.62 | 154.164 ± 10.71 |
| BMI | 22.52 ± 4.1 | 24.36 ± 4.815 | 23.546 ± 4.61 |
Data collection tool
The tool used for this study included sociodemographic profile, health profile, 24-hr dietary recall of a single day. The dietary recall was collected using portion sizes standardized cups, spoons and dough balls were used. Anthropometry (height and height) the height was measured using wall mount and regular measuring tape. The wall mount tape was affixed on the wall; the participant was made to stand barefoot with heels and toes together. The back of the head, shoulders and buttocks were suppose to touch the wall. A metallic scale was lowered from the height compressing the hair and finding the top of the head and the reading was measured with was closest to 0.1cm and height was recorded.
Weight was measured using calibrated electronic weighing scale. The participant had to stand straight with barefoot on the weighing scale. Before each weight measurement it was made sure that the scale was set to zero reading to avoid errors. This was followed by calculating the Body Mass Index (BMI)
Data was collected by the researcher independently.
Data Analysis
Analysis was done using Statistical Package for Social Sciences (SPSS) software version 20 and is presented as descriptive statistics, tables and figures.
Table 1.3 Nutrition status among the elderly
| BMI Classification | Male | Female | Total | |||
| Number | Percentage | Number | Percentage | Number | Percentage | |
| Underweight | 9 | 15.5 | 6 | 8.3 | 15 | 11.5 |
| Normal | 33 | 56.9 | 38 | 52.8 | 71 | 54.6 |
| Overweight | 14 | 24.1 | 20 | 27.8 | 34 | 26.2 |
| Grade I obesity | 1 | 1.7 | 7 | 9.7 | 8 | 6.2 |
| Grade II obesity | 1 | 1.7 | 1 | 1.4 | 2 | 1.5 |
Results
A total of 131 respondents were included in the study out of which 55.7 percent (n=73) were feamles and 44.3 percent (n=58) were males
The range began with 60 years and the oldest elderly was 96 years. The mean of the elderly age was calculated and it was observed that the mean age of the males and feamles years 72.59 ± 8.6 and 71.7 ± 8.45 respectively. According to the WHO definition it can be concluded that around 38 percent elderly belong to the category of ‘young olds’, 29 percent to ‘olds’ and 9 percent to ‘oldest old’ category.
Dietary intake
The 24 hour dietary recall for 1 single day was carried out to calculate the dietary intake. The food prepared was standardised by using measuring cups and spoons to get accuracy. The items in the menu were calculated according to the ingredients that were used and sum of all the macronutrients i.e. carbohydrates, proteins, fats and energy was summed up. All the recalls were entered and mean of their macronutrient and energy intake was calculated. The following table enlists the details with variation in males and feamles.
In case of carbohydrates the diet had an average of 205.34 grams with standard deviation of 56.56 grams. In case of males the intake was slightly higher, it was 213.28 ± 51.22 grams whereas in case of women it was 199.03 ± 60.06 grams. The range of intake of carbohydrates in males was 162.06 grams to 264.5 grams. In case of feamles it was 138.97 grams to 259.09 grams. Thus tentatively the consumption of carbohydrates by the elderly varied from 148.78 grams to 261.9 grams. Protein intake was similar in both the cases and with increase in age and reduction in weight and dietary intake there was a reduction of the protein intake in their diet. Recommended Dietary Allowance (RDA), their intake did not meet the requirement. In males their intake ranged in between 26.32 grams and 49.4 grams, in feamles it was in the range 22.64 grams and 46.68 grams. Consumption of fats was more in both the cases the average consumption of fat in a day was about 45 grams with a standard deviation of 17 grams. The range of fat intake in males was 28.58 grams to 62.36 grams. In feamles it was 27.09 grams to 62.11 grams. An average consumption of 1400Kcal to 1800 Kcal was observed in case of males and 1300Kcal to 1800Kcal in case of feamles.
Anthropometry and Body Mass Index (BMI)
The average weight and height of the elderly male was in the range 45 kilograms to 65 kilograms and 156 cms to 170 cms and that of feamles was 38 kgs to 60 kgs and height of 140 cms to 154 cms. In the above table Body Mass Index is calculated
BMI= Weight (kg)/ Height2(m)
The mean of BMI in both the genders seem normal but calls for further analysis to get a clearer picture. In the following table, the elderly BMI is classified:
Nutrition Status and BMI classification
Out of the entire population, it was seen that 54.6 percent elderly had normal nutritional status. The rest were malnourished in the form of underweight, overweight or obese. This malnourished population constituted of 59 participants which contributed to 45.4 percent of the entire sample which was high in number. About 11.5 percent were underweight, 26.2 percent overweight and 7.7 percent obese in the entire sample. It can be observed that more number of males (15.5 percent) were underweight compared to feamles (8.3 percent). Considering the overweight category feamles were more (27.8 percent) as compared to males (24.1 percent).
Discussion
Ageing is process which begins right from the time of birth and the process cannot be altered, but it can be regulated and monitored for a better health outcome. Health outcome can be observed through the social, physical and mental well being of any individual. In this study out of 131 participants about 59 (46 percent) were malnourished. Out of these 46 percent, 11.5 were underweight due to undernourishment and 26.2 percent were overweight. About 7.7 percent samples were either Grade I or Grade II obese. Considering role of gender in the nutrition status it can be seen that both the genders are equally susceptible to malnutrition. An interesting finding in this study is more males were underweight and feamles were overweight.
Considering their dietary intake the RDA for any adult (elderly) in India constitutes to 55-60 percent, 15-20 percent and 20-25 percent of carbohydrate, protein and fat intake respectively. The results show that the percentage of the macronutrients intake is not within the prescribed RDA. The carbohydrate intake in case of both males and feamles is a little higher than the reference value, the protein intake is very low than the required value and fat intake is more.
Conclusion
As this study was carried out institutes, more such empirical research needs to be done to assess nutrition status among the elderly. Geriatric Nutrition Assessment should be included and monitored from time to time and thus calls for further research in the field of geriatric nutrition. Regular monitoring and intervention can improve the health outcomes of the elderly. There is a dire need of funds for the same. This also calls for revision of policies and schemes concentrating on the geriatric population.
Acknowledgements
I would like to acknowledge all the members living in the Old Age Homes for their time and sharing their information.
References
- Genuis, S. J. (2005). Nutritional Transition: A Determinant of Global Health. Journal of Epidemiology and Community Health , 59 (8), 615-617
CrossRef - Borah, H., Shukla, P., Jain, K., Kumar, S. P., Prakash, C., & Gajrana, K. R. (2016). Elderly in India. Ministry of Statistics and Programme Implementation, Government of India. New Delhi: Socail Statistics Division.
- Raju, S. S., Parasuraman, S., Mangal, D., & Bammidi, S. (2014). Building a Knowledge Base on Population Ageing in India. Institute for Social and Economic Change, Institute of Social Growth and Tata Institute of Social Sciences . UNFPA.
- McKeown, R. E. (2009). The Epidemiologic Transition: Changing Patterns of Mortalitiy and Population Dynamics. American Journal of Lifestyle Medicine , 3, 1-14.
CrossRef - (2015). World Population Ageing. Population divison, Department of Economic and Social Affair. New York: United Nations
- Kalia, M., Virk, A., Guota, B. P., & Singh, J. (2014). Assessment of Malnourishment In Elderly Of Rural Punjab. Healthline , 5 (2), 24-28.
- Nowson, C. (2007). Nutritional challenges for the elderly. Nutrition & Dietetics , 65 (4), 150-155.
CrossRef - Swami, H. M., Bhatia, V., Gupta, A. K., & Bhatia, S. P. (2005). An Epidemiological Study of Obesity Among Elderly in Chandigarh. Indian Journal of Community Medicine , 30 (1), 11-13.
- Vedantam, A., Subramanian, V., Rao, N. V., & John, K. (2009). Malnutrition in free-living elderly in rural south India: prevalence and risk factors. Publich Health Nutrition , 13 (9), 1328-1332.
CrossRef - Jamuna, D. (2008). Issues of Elder Care and Elder Abuse in the Indian Context. Journal of Aging & Social Policy , 15, 125-142.
CrossRef - Jhingan, H. P. (2001). Prognosis of Late-onset Depression in Elderly: A Study in India. International Journal of Psychogeriatrics , 13 (1), 51-61.
CrossRef - Bothra, N., & Dasgupta, M. (2011). A COMPARATIVE PSYCHOSOCIAL STUDY OF SELECTED ELDERLY GROUPS IN THE CANVAS OF SUCCESSFUL AGING. Ageing and SocietyThe Indian Journal of Gerontology , XXI (I & II).
- Payette, H. (2000). Nutrition Risk Factors for Institutionalisation in a Free-living Functionally Dependent Elderly Population. Journal of Clinical Epidemiology , 53 (6), 579-587.
CrossRef - Pai, M. K. (2011). Comparative study of nutritional status of elderly population living in the home for aged vs those living in the community. Biomedical Research , 22 (I), 120-126.
- Singh, A., Sahai, D., & Mathur, N. (2014). A Study on Prevailing Malnourishment Among Elderly Population of Lucknow City. International Journal of Agriculture and Food Science Technology , 5 (2), 35-40.
Accepted on: 11-4-2018
Second Review by: Dr. Kristiina Heikkilä (Sweden)
Final Approval by: Dr. Adele Papetti


Web of Science Coverage
Emerging Sources Citation Index (ESCI)
2024 Journal Impact Factor: 1.1
Scopus Journal Metrics
CiteScore 2025: 2.6
CiteScore Details
Sustainable Nutrition: Food Systems, Nutrient Retention, and Public Health Impact
![]()
This journal is a member of, and subscribes to the principles of, the Committee on Publication Ethics (COPE)


