Nutritional Status Improvement in Malnourished Rat (Rattus norvegicus) after Seluang Fish (Rasbora spp.) Treatment
Triawanti1*
, Didik Dwi Sanyoto3, Hendra Wana Nuramin4 1Department of Biochemistry, Faculty of Medicine, Lambung Mangkurat University
2Department of Pediatrics, Faculty of Medicine, Lambung Mangkurat University
3Department of Anatomy, Faculty of Medicine, University of Mangkurat
4Department of Pharmacology, Faculty of Medicine, Lambung Mangkurat University.
Corresponding Author Email: tria_fkunlam@yahoo.co.id
DOI : http://dx.doi.org/10.12944/CRNFSJ.6.1.14
Download this article as:
![]()
Prevalence of malnutrition in Indonesia is still high although it has some potential source of nutrients. Seluang fish (Rasbora spp.) is a river fish consumed by the people of South Kalimantan, Indonesia. This study analyzed the improvement of nutritional status in the malnourished rats after treatment with Seluang Fish. The study used malnourished white rats (Rattus norvegicus) using a low protein and fat diet for 8 weeks. The rats were divided into three groups; malnourished group (M) without other dietary treatment, standard diet (P1) and seluang diet (P2) for a period of four weeks. The malnourished group was sacrificed first, and after four weeks treatment, other groups were sacrificed; blood and bones were taken for weight, protein levels, hemoglobin levels, bone length, bone calcium levels and IGF-1 levels. The results showed that the average of body weight for all the studied groups ranged between 190 to 220g. Seluang diet had the highest serum protein levels (4.388 mg/dL), hemoglobin (19.7 mg/dL) and IGF levels (388.7 ng/mL). Standard diet had the longest bone length (3.547 cm) and the highest Calcium levels of 1.68 mg/g. Based on these results, it was concluded that Seluang fish may have the potential to improve the nutritional status of malnourished rats.
KEYWORDS:Calcium; Hemoglobin; Malnourish; Rasbora spp; Serum protein levels.
Introduction
Malnutrition is an imbalance of nutritional and energy supplies with the body requires ensuring some growth, maintenance, and certain functions. Malnutrition may be caused by inadequate or wrong dietary intake or medical conditions that affect the digestion of food or the absorption of nutrients from food.1–3 Malnutrition still remains a serious problem, especially in developing countries, including Indonesia. Basic medical research in Indonesia showed that prevalence of malnutrition was 19.6% in 2013 and South Kalimantan was ranked fifth most prevalence stunting.4
One of the most direct factors that determine the nutritional status of infants and toddlers is nutrient intake, especially in the first 1000 days of life.5,6 Good nutritional intake in the first 1,000 days of life are key determinants and can be anticipated early on by utilizing local resources and local wisdom.7
The level of calorie and protein consumption in South Kalimantan’s population is below the minimum standard.4 Protein intake can be obtained from various foodstuffs, including fish. Based on data from the Department of Fisheries and Marine of South Kalimantan Province in 2010, the level of fish consumption in South Kalimantan is 36.84 kg/capita is higher than the national fish consumption of 33.89 kg/capita, but still lower than Malaysia (55.4 kg/capita) and Singapore (37.9 kg/capita). This is very unfortunate because South Kalimantan has abundant fish.8
Seluang fish (Rasbora spp.) is a known and widely consumed river fish by the people of South Kalimantan. Based on the previous study, every 100 grams seluang contains 361 Kcal, protein 10 gr, fat 3.2 gr, calcium 80 mg, phosphorus 224 mg and 4.7 mg of iron. (Yunanto et al., 2015) reported that Seluang fish from South Borneo contains complete essential amino acids, iron, calcium, zinc and essential fatty acids (Yunanto et al., 2015). This study aimed to analyze the improvement of nutritional status in malnourished rat treated by seluang. This is an opportunity to solve the nutrition problem in Indonesia.9
Materials and Methods
Design
This study protocol got approval from the ethics committee, Faculty of Medicine, Lambung Mangkurat University. We used pretest-posttest with control group design experimental study.
The materials used in this study were white male rats (Rattus norvegicus), distilled water, deionized water, standard rat feed, fish meal Seluang, IGF1 Elisa Kit, Calcium Assay kit, hemoglobin assay kit, ethers, alcohols.
Procedure
Acclimatization
The white rats were kept for 1 week before being treated to provide the same physical and psychological conditions. During the experiment, white rats were given the same distilled water and food at ad libitum.
Making fish meal
Fresh fish was grilled to obtain raw fish porridge. Then the porridge was steamed with steam heat for 1 hour and dried with oven until the moisture content is about 8%. Next, regrinding to remove clots or bone particles. After being dried granules, the fish powder is made into pellets and used as rat feed.
Treatment
Thirty white rats (Rattus norvegicus) age 3-4 weeks, weight 41.3+5.4 grams were made into malnourished condition with low protein diet for 8 weeks. After 8 weeks of low-protein feeding, 10 rats were sacrificed to examine the levels of protein, hemoglobin, IGF1, bone calcium and bone length. Then the remaining malnourished mice were divided into 2 groups: malnourished rat fed 12-20 grams standard diet (P1) and malnourished rat fed 12-20 grams seluang diet (P2) each day. After 4 weeks all rats were sacrificed to take blood and bone.
Rat blood and bone collection
The blood was taken and centrifuged 3000 rpm for 10 minutes, then the serum was obtained. Then serum was centrifuged again at 6000 rpm for 10 minutes to obtain a supernatant. The supernatant was used to measure protein levels and IGF1.9 Some fresh blood was used to check Hb levels. The long bones (femur) were taken to measure the concentration of calcium in the bone. The bone was crushed and homogenized, then calcium levels are measured using the titrimetric method. Measurement of protein levels by colorimetric method, Hb level with cyanmethemoglobin method. Measurement of IGF1 levels using ELISA method.10 The procedure was done in accordance with the manufacturer’s manual procedure. The result was read with Elisa Reader with a 450 nm wavelength. Measurement of rat body weight by using scales. Measurement of bone length was done by measuring the length of the femur.
Data analysis
The data were tested using normality test (Shapiro Wilk) and homogeneity test (Levene). If the data were homogenous and normally distributed, One Way ANOVA test would be done with 95% confidence level. If the data were not homogeneous or not normally distributed, then the nonparametric test would be chosen.
Results
Effects on body weight
The body weight is one of the markers to represent nutritional conditions. Body weight of rats was shown in Figure 1.
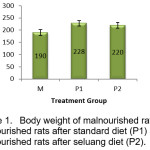 |
Figure 1: Body weight of malnourished rats (M), malnourished rats after standard diet (P1) and malnourished rats after seluang diet (P2) |
Figure 1 showed that average body weight of rats fed low protein and fat for 8 weeks was lower compared to 4 weeks later after getting fed standard diet and seluang diet. Statistical analysis with Mann Whitney test concluded that there was a significant difference between the weight of the malnourished rat with standard diet (P1) and seluang diet (P2) with the level of significance p = 0,009 and p = 0.023 respectively. Comparison of the standard diet (P1) and seluang diet (P2) did not show the significant difference (p = 0,436). It suggested that standard diet and seluang diet had the same potency to increase the weight of malnourished mice.
Protein levels in the experimental rats
Rats were defined to be malnourished based on serum protein levels. After fed with low protein and fat for 8 weeks, the average protein levels in rats were 3.146 g/dL (Figure 2), below the normal rat serum protein level (4.7 g/dL).
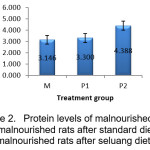 |
Figure 2: Protein levels of malnourished rats (M), malnourished rats after standard diet (P1) and malnourished rats after seluang diet (P2). |
Based on Kruskal Wallis test, there was a significant difference among the group (p=0,001). Mann Whitney showed there was no significant difference between protein levels in malnourished rats and standard diet (P1) with p=0,0631. There was a difference of protein levels between group P2 and group M (p = 0,000) and P1 (p = 0,002). It meant seluang diet for 4-week can increase protein levels in malnourished rats.
Profile of hemoglobin levels
Another marker of malnutrition is low hemoglobin (Hb) levels. The average rate of rat Hb levels was shown in Figure 3.
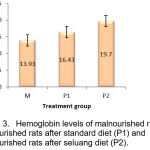 |
Figure 3: Hemoglobin levels of malnourished rats (M), malnourished rats after standard diet (P1) and malnourished rats after seluang diet (P2) |
Hb levels in the malnourished group (M) was 13.93 g/dL. This level was lower than normal Hb levels of the rat. Standard diet group (P1) and seluang diet group had higher Hb levels (16.43 g/dL and 19.7 g/dL, respectively). Statistical analysis with one-way ANOVA test with a confidence level of 95% showed there were significant differences among groups (p=0.000). A post hoc analysis was conducted using Tukey HSD and indicated there were significant differences in hemoglobin levels between the malnourished group (M) and the standard diet (p=0.023) and seluang diet (p=0.000). There was also the significant difference between standard diet and seluang diet (p=0.003). It suggested that seluang was able to improve the hemoglobin levels caused by lack of protein and iron in malnourished rats.
Bone length of Experimental Rats
Bone growth can be determined by the bone length in experimental rats. Figure 4 showed the bone length profile from several treatments.
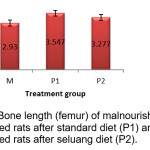 |
Figure 4: Bone length (femur) of malnourished rats (M), malnourished rats after standard diet (P1) and malnourished rats after seluang diet (P2). Click here to View figure |
One Way ANOVA with 95% confidence level test showed a significant difference between groups. Tukey HSD test results showed that there were significant differences in bone length between malnourished rats (M) and standard diet (P1) with p=0.000 and between malnourished rats and seluang diet with p=0.001. P1 and P2 also had the significant difference with p=0.008. It suggested standard diet and seluang diet could improve bone growth due to malnutrition. Standard diet had better bone growth.
Bone calcium levels in experimental rats
Bone calcium levels can be seen in Figure 5.
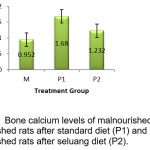 |
Figure 5: Bone calcium levels of malnourished rats (M), malnourished rats after standard diet (P1) and malnourished rats after seluang diet (P2) |
Figure 5 had shown us that the average bone calcium levels in malnourished rats were the lowest (0.952 mg/gr of bone). After standard diet and seluang diet for 4 weeks, there were improvement bone calcium levels. Kruskal Wallis test concluded that there was a significant difference between treatment group (p=0.001). Mann-Whitney test showed malnourished rat bone calcium levels were significantly different from the standard diet (p-=0.000). Although the malnourished rat’s group had lower bone calcium levels than seluang diet group, they did not have significant difference statistically (p=0.218). There was a significant difference in bone calcium levels between the standard diet and seluang diet (p=0.023), where the standard diet group had higher levels of bone calcium levels.
IGF-1 levels in experimental rats
Insulin-Like Growth Factor-1 (IGF-1) is a protein that plays important role in the growth process. Figure 6 showed the condition of IGF-1 in malnourished rats before and after treatment.
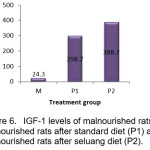 |
Figure 6: IGF-1 levels of malnourished rats (M), malnourished rats after standard diet (P1) and malnourished rats after seluang diet (P2) |
Kruskal Wallis Test showed significant differences among groups (p = 0.000). Mann-Whitney U test showed a significant difference between the malnourished group and standard diet (p=0.000), and the malnourished group and P2 group (p=0.000). There was also a significant difference between standard diet and seluang diet (p=0.002), in which the levels of IGF-1 seluang diet was higher than the standard diet. This suggested that seluang may improve growth factors in malnourished rats.
Discussion
Malnutrition is a pathological condition due to a relative or absolute deficiency or excess of one or more nutrients.2,7,11 There are 2 extreme forms of malnutrition due to nutritional deficiency; marasmus and kwashiorkor.12 The rats were made into kwashiorkor by providing low-protein and fat diet. The body weight of malnourished rats was still above 150 grams (Figure 1), suggested that caloric intake of rats were sufficient, but lack of protein intake. After standard diet and seluang diet treatment, there were significant weight increases. This suggested that both standard diet and seluang may increase post-malnutrition weight. There was no significant difference between standard diet and seluang diet to improve rat weight.
Kwashiorkor is a lack of protein condition. Every day the body needs protein to be obtained 10-15% of total caloric needs. During the growth period, we need higher protein intake, so if there is a lack of protein intake it will have a negative impact. A person with protein or kwashiorkor malnutrition can adversely affect the level of intelligence, growth, and anemia.13 Chronic kwashiorkor can cause stunted growth.14
Protein is the largest part of the body after water. Some enzymes, hormones, carriers of nutrients and blood, intracellular matrices are proteins. Protein serves as the foundation of cells in humans. Protein is the building block of the network, forming a body structure, growth, transport oxygen, and immune system.15 Lack of protein may cause impairment in absorption and transport of nutrients.6
In this study, rats were given low protein and fat diet treatment for 8 weeks to make them malnourished. This was demonstrated by the low protein level (<4.7 g/d). (Figure 2). After standard diet and seluang diet treatment for 4 weeks, there was a significant improvement (Figure 2). The group with seluang treatment showed the highest serum protein levels. This occurred because fish has a high protein content and complete essential amino acids. These essential amino acids are needed by the body to synthesize various proteins in the body. Deficiency of essential amino acids could interfere the synthesis of proteins that ultimately disrupt growth and development.15,16
Protein deficiency can also cause stunted growth and anemia. Anemia is a condition in which the hemoglobin level is below normal. Hemoglobin is formed from heme compounds in which it contains iron (Fe2+) and globin protein molecules. Both elements must be nourished well. The fish has the iron content of 19.9 ppm and high protein that can be used to prevent anemia.17,18
In this study, hemoglobin levels were lower in malnourished group. This suggested that there had been anemia in these rats. After standard diet and seluang diet treatments, there was an improvement in hemoglobin levels significantly (Figure 3). Hemoglobin levels after seluang diet were higher than the standard diet. It suggested the protein and iron content seluang able to improve the condition of anemia in rats.
Not all iron in the diet can be absorbed by the body because the form of iron in the diet affects the absorption or lack of animal food intake. The iron contained in the fish is a haem iron that is easily absorbed by the body.17,18
In addition to iron, hemoglobin formation is also affected by protein, folic acid, and vitamin B12. Amino acids glycine is required as precursors for the formation of porphyrin compounds, folic acid and vitamin B12 required for the formation of nucleic acids that affect the formation and maturation of erythrocytes. Thus if there is a deficiency of these nutrients then the risk of experiencing anemia becomes larger. Seluang has the amino acids glycine necessary for heme formation, as well as other amino acids necessary for globin protein formation.18,19
Seluang also contains calcium of 1.6 grams/100 grams. The calcium in the fish can be a source of calcium for bone growth, especially in childhood. Calcium is a bone-forming primary mineral that can be obtained from food intake. About 200 mg/day of calcium added in the skeleton during childhood and increases to 400 mg/day for men and 320 mg/day for women during puberty. Prentice et al., (2006)study reported that supplementation of calcium in adolescent boys aged 16-18 years proved to increase skeletal growth significantly including bone mineral content.20
This study proved that malnourished rats treated with seluang diet showed an increase in bone length although lower than standard diet (Figure 4). This study demonstrated that malnourished rats had the lowest bone calcium levels. After standard diet and seluang diet treatments, there was bone calcium levels improvement significantly (Figure 5). This occurred because the calcium content in the standard diet consisted of various blends such as bran. Bran has high calcium content. However, in community implementation, fish are eaten together with other food components, such as vegetables and rice as a source of carbohydrates, so that calcium can be obtained in more than enough quantities. In addition, there are several other dietary factors that affect the absorption of calcium in the gastrointestinal tract. Factors that can increase the absorption of calcium are lactose, carbohydrates, lysin and fat, while those that lower their absorption is fiber, fat, caffeine, iron, and phosphorus.21
The growth and development of bone tissues are influenced by genetic, nutritional and hormonal functions that affect the rate of growth, bone formation, and bone size.15 Widening of the bone is affected by a number of hormones but the most conspicuous by the pituitary growth hormone and IGF-1. Growth hormones regulate various important physiological processes including growth and development of somatic, directly through the activation of a specific growth hormone receptor (GHRs) or indirectly through the IGF1 which is the main product of the liver in response to growth hormone.10
The results of this study showed that malnourished rats IGF1 levels were very low. After the malnourished rats got standard diet and seluang diet for 4 weeks, there was a significant improvement of IGF-1 levels. Compared to standard diet group, seluang diet group had higher IGF1 levels significantly (Figure 6). This suggested that the protein content in seluang able to increase the synthesis of IGF1 which played a role in the process of bone formation and growth.
IGF1 is one of the peptide hormones synthesized in the liver and in other tissues locally acting paracrine or autocrine. Growth hormone (GH) and IGF-1 plays a role in the growth of long bone during the postnatal period, associated with steroid sex hormones and affect the growth and development of bones.22 The study from Yakar et al., (2002) showed that rats with IGF-1 liver deficiency and acid labile subunit knockout (ALSKO) had decreased serum IGF-1 levels and lower linear growth significantly. There was also a decrease in bone density by about 10% and more than a 35% decrease in the periosteal circumcision and the thickness of the tibia bone cortex. When the administration of IGF-1 for 4 weeks total length of the improvement occurs proximal tibial growth plate.23
Nutritional status affects serum IGF1 levels. Suboptimal nutrient intake negatively affects the bioactivity of IGF-1. Nutrients regulate the concentration of IGF-1 to reflect changes in nitrogen balance induced by manipulation of nutrient intake.24 Lack of calories and protein causes growth hormone resistance. This condition is associated with the failure of growth hormone receptor signaling, which decreases the synthesis of IGF1 in the liver. In addition, growth hormone and IGF1 are anabolic hormones, while malnutrition causes the process of catabolism. In the state of catabolism, IGF1 concentrations are low and inhibit the growth hormone (GH). Signaling GH/IGF-1 is an essential factor for growth in childhood and maintaining anabolic processes in adulthood.22,24
Essential amino acid content in the diet is necessary to restore optimal IGF-1 levels after malnutrition. Some evidence showed that the energy requirements for protein intake are less than optimal have failed to increase IGF-1.24 In this study, malnourished rats had lower protein levels, hemoglobin levels, IGF1 levels, short bones and low calcium levels. Seluang has some essential amino acids to fulfill the needs of the essential amino acid, that is approximately 12% of total energy needs, The malnourished rats were treated by seluang showed elevated IGF-1 levels.
Seluang also contains zinc (Zn) of 122.7 ppm despite complete essential amino acids. Zinc is an essential micronutrient that plays a role in a number of enzymatic reactions. Zinc is involved in growth, DNA and protein synthesis, neurosensory function, cell-mediated immunity, thyroid function and bone metabolism. Zinc is also involved in the bioactivity regulation of IGF-1. In vitro study of bone cell culture, zinc strengthens the action of IGF-1 and increases endogenous IGF-1 synthesis. Children with zinc deficiencies have some stunting risk. Zinc supplementation is effectively able to induce growth and associated with increased IGF-1 plasma levels.6,24
Based on the results of this study we found that seluang treatment in malnourished rats can improve the nutritional status include an increase in body weight, serum protein levels, hemoglobin levels, long bone, bone calcium levels and serum IGF-1 levels. Based on the results, we concluded that seluang may have the potency to improve the condition of malnutrition include kwashiorkor, anemia, stunting and prevent further impact the further from malnutrition.
Acknowledgements
We would like to thank Ministry of Research, Technology and Higher Education of the Republic of Indonesia for financial support and all people for their excellent assistance with data collection and analysis.
Conflict of Interest
The authors have no conflict of interest to any financial, personal or other relationships with other people or organizations that can influence their work.
Declaration of Funding Sources
This study was supported by Ministry of Research, Technology and Higher Education of the Republic of Indonesia.
References
- Dhanjal GS, Singh M. Thyroid hormone status in children with protein energy malnutrition a hospital based case control study. Int J Contemp Pediatr,4(2):2-6: (2017).
CrossRef - Rytter MJH, Kolte L, Briend A, Friis H, Christensen VB. The immune system in children with malnutrition – A systematic review. PLoS One ;9(8); (2014).
CrossRef - Amarya S, Singh K, Sabharwal M. Changes during aging and their association with malnutrition. J Clin Gerontol Geriatr;6(3):78-84; (2015).
CrossRef - Ministry of Health. Indonesian Basic Health Research 2013.; (2013).
- Neville MC, Anderson SM, McManaman JL, et al. Lactation and neonatal nutrition: Defining and refining the critical questions. J Mammary Gland Biol Neoplasia;17(2):167-188; (2012)
CrossRef - Nyaradi A, Li J, Hickling S, Foster J, Oddy WH. The role of nutrition in children’s neurocognitive development, from pregnancy through childhood. Front Hum Neurosci;7(March):97; (2013).
CrossRef - Sheetal A, Hiremath VK, Patil AG, Sajjansetty S, Sheetal Kumar R. Malnutrition and its oral outcome – A review. J Clin Diagnostic Res;7(1):178-180; (2013).
CrossRef - Department of Fisheries and Marine of South Kalimantan Province. The level of fish consumption in South Kalimantan.(2010).
- Yunanto A, Sanyoto DD, Noor MS, Kustiyah I. The Quality of Rat Brain Spatial Memory and Expression of Peroxisome Proliferator Activated Receptor ( PPAR ) Which Fed with Seluang ( Rasbora spp .). J Life Sci3(2):43-47; (2015).
CrossRef - Marongiu M, Marcia L, Pelosi E, et al. FOXL2 modulates cartilage, skeletal development and IGF1-dependent growth in mice. BMC Dev Biol;15(1):27;(2015).
- Mashmoul M, Azlan A, Mohtarrudin N, Nisak B. Saffron Extract and Crocin Reduced Biomarkers Associated with Obesity in Rats Fed a High-Fat Diet. Mal J Nutr, 23(1):117-127; (2017).
- Khargekar NC, Khargekar VC, Shingade PP. A cross-sectional study to assess the protein energy malnutrition in children between one to five years of age in a tribal area Parol, Thane district, Maharashtra, India. Int J Community Med Public Heal;3(1):112-120; (2016).
- Junagadh PR, Gupta MC. A critical review of malnutrition and its management 1 1 2. Int J Med Heal Res ;2(4):43-47; (2016).
- Semali IA, Tengia-Kessy A, Mmbaga EJ, Leyna G. Prevalence and determinants of stunting in under-five children in central Tanzania: remaining threats to achieving Millennium Development Goal 4. BMC Public Health;15(1):1153; (2015).
- Florencio-Silva R, Sasso GRDS, Sasso-Cerri E, Simoes MJ, Cerri PS. Biology of Bone Tissue: Structure, Function, and Factors That Influence Bone Cells. Biomed Res Int (2015).
- Prentice AM, Ward KA, Goldberg GR, et al. Critical windows for nutritional interventions against stunting. Am J Clin Nutr;97(5):911-918; (2013).
- Hooda J, Shah A, Zhang L. Heme, an essential nutrient from dietary proteins, critically impacts diverse physiological and pathological processes. Nutrients;6(3): 1080-1102; (2014).
CrossRef - Abbaspour N, Hurrell R, Kelishadi R. Review on iron and its importance for human health. J Res Med19(2):164-174; (2014).
- Marquez-Ibarra A, Huerta M, Villalpando-Hernandez S, et al. The effects of dietary iron and capsaicin on hemoglobin, blood glucose, insulin tolerance, cholesterol, and triglycerides, in Healthy and diabetic Wistar rats. PLoS One;11(4):1-16; (2016).
CrossRef - Prentice A, Schoenmakers I, Laskey MA, de Bono S, Ginty F, Goldberg GR. Nutrition and bone growth and development. Proc Nutr Soc;65(4):348-360; (2006).
CrossRef - Bueno AL, Czepielewski MA. The importance for growth of dietary intake of calcium and vitamin D. J Pediatr (Rio J);84(5):386-394; (2008).
CrossRef - Locatelli V, Bianchi VE. Effect of GH/IGF-1 on Bone Metabolism and Osteoporosis. Int J Endocrinol; (2014)
CrossRef - Yakar S, Rosen CJ, Beamer WG, et al. Circulating levels of IGF-1 directly regulate bone growth and density. J Clin Invest;110(6):771-781; (2002).
CrossRef - Maggio M, De Vita FD, Lauretani F, et al. IGF-1, the cross road of the nutritional, inflammatory and hormonal pathways to frailty. Nutrients;5(10):4184-4205 (2013).
CrossRef.
Accepted on: 12-02-2018
Second Review by: Prof. Sunita Mishra (India)
Final Approval by: Prof. Rajesh Jeewon


Web of Science Coverage
Emerging Sources Citation Index (ESCI)
2024 Journal Impact Factor: 1.1
Scopus Journal Metrics
CiteScore 2025: 2.6
CiteScore Details
Sustainable Nutrition: Food Systems, Nutrient Retention, and Public Health Impact
![]()
This journal is a member of, and subscribes to the principles of, the Committee on Publication Ethics (COPE)


