Application of Peanut Butter to Improve the Nutritional Quality of Cookies
P. N. Timbadiya*1 
1Department of biochemistry, junagadh agricultural university, junagadh, india, 362001.
2Department of R and D (BDL), Intas biopharmaceuticals, Ahmedabad- 380015
3Department of biochemistry junagadh agricultural university, junagadh, India, 362001.
Corresponding Author Email: adi.timbadia@gmail.com
DOI : http://dx.doi.org/10.12944/CRNFSJ.5.3.26
Download this article as:
![]()
The study on Hydrogenated fat replaced with peanut butter to reduce saturated fatty acids in cookies was carried out. Cookies prepared with varied concentrations of hydrogenated fat and peanut butter (100:00, 80:20, 60:40, 40:60, 20:80 and 00:100) were analyzed to check fatty acid composition and textural characteristics. Palmitic acid, Myristic acid and Stearic acid (Saturated fatty acids) were higher in Control cookies, which level was reduced with increasing concentration of PB in different treatments. Linoleic acid and Oleic acid (Unsaturated fatty acids) were lower in control cookies, which were increased with increasing concentration of Peanut butter in different treatments. Oil stability index of experimental cookies increased up to 3.62% with increasing concentration of PB. Cookies hardness was also increased with increasing concentration of PB. Cookies with 40% PB had beneficial fatty acid composition with stable oil quality and also had a greater appreciable sensory quality by evaluation panel.
Objective:
Preparation of peanut butter
Preparation of cookies in different ratio of vegetable fat to peanut butter
Texture analysis and sensory quality
Fatty acid profiling
Cookies; Fatty acid composition; Peanut butter; Sensory acceptability; Vegetable fat;
Introduction
Peanut (Arachis hypogaea L.) is the cheapest source of protein also known as Groundnut because it grows underground.1 It has 40-54% oil and 26-28% protein. Roasting process makes it tastier, imparts flavor and specially inactivates lipoxygenase but the drawback of this process is that it decreases the shelf life of it2 and affects nutrient composition.3 Peanuts are available in the retail market places in the form of raw nuts, salted nuts, roasted in shell nuts, peanut butter and confectioneries.4 Peanut oil has the highest stability with high oleic/ linoleic acid ratio. Nutritionally, high linoleic acid is desirable as it is an essential fatty acid and produces a hypocholesterolemic effect.
Peanut oil contains mainly three fatty acids like Palmitic acid (10%), oleic and linoleic acid (80% combined).5 Peanut oil contains of approximate 81% UFAs in which about 39% are PUFA. Because of this quality of high MUFA content it is ideal diet for lowering cholesterol.6 Peanuts are susceptible to oxygen due to high MUFA content so it reduces damage caused by oxidation during manufacturing and transport which is main reason of losses of quality.7 Cookies are very well accepted product in majority of population from all income groups, and it can be a vehicle for a nutritional source like protein, carbohydrates and fatty acid. Cookies are generally made up of vegetable fat but it can be the best nutritional source for desirable protein and essential fatty acid if supplemented with peanut butter which may improve human health.8 Commercial cookies are made up of refined wheat flour, and it lacks in protein quality as well as quantity. Refined wheat flour has around 10% of protein and is deficient in lysine and essential amino acid. Pulses and oilseeds are the good sources of protein, and effective use of it can solve the human nutritional disease.9
Butter made up of peanuts improves the nutritional quality of Cookies because it contains more amounts of protein and essential fatty acids.10 Peanut butter contains beneficial mono and poly unsaturated fats so it could be good alternative of traditional vegetable fat and help to lower blood cholesterol levels.11 Risk of heart disease can be reduced by 50 percent if the people intake few grams of nuts or peanut butter daily. The β-Sitosterol (phytosterol) is an anti-cancer compound which has been identified in peanuts and peanut butter. Use of Milk Solid Non Fat (MSNF) can also improve the protein quality of the experimental cookies prepared using part of peanut butter in place of vegetable fat.12
Peanut kernel is the main source of protein and lipids, the composition of full-fat flour of peanuts reported 2.5 %, 27.4 %, 44.4%, 2.3 %, 2% and 21.5% for moisture, protein, oil, crude fiber, ash and carbohydrate respectively.13 Biochemical compositions of peanut kernel have different biochemical compounds. Average % of moisture, protein, Lipids, Crude fiber, Nitrogen free extract, Starch, Reducing sugars and Ash is 05.0, 28.5, 47.5, 02.8, 13.3, 04.0, 00.2 and 02.9 respectively. Other biochemical compounds of various peanut butters are as followed, Calories, Iron, Niacin, Calcium, Phosphorus, Riboflavin, Sodium, Vitamin A, Potassium, Thiamine, Ascorbic acid.14 The Sensory evaluation of biscuits prepared with peanut butter had comparatively more hard texture and more dark color than control biscuits. However, the flavor and taste of biscuits made up of PB is more palatable.15
Materials and Methods
Preparation of peanut butter (PB)
100 g peanuts(variety “GG-20”)were heated at 100°C in hot air oven for 8- 10 minutes and cooled to get uniform roasted product, blanched, peel removed, low weight seeds, discolored seeds or other unnecessary parts were removed. Now this whitens peanut kernel was grind at lower speed in a mixer for 1 to 2 minutes, pinch of salt was mixed in peanut powder which was spread on vessels and kept for 4 to 5 hours till deoiling of peanut powder was noticed. Peanut butter was stored in airtight vessels and kept in cooled condition (14°C).
Preparation of cookies
Cookies with vegetable to Peanut butter ratios of T1 (100:0), T2 (80:20), T3 (60:40), T4 (40: 60), T5 (20:80), T6 (0: 100) were prepared according to standard recipe. The oven was preheated to 1500C/3000F/Gas 4. Refine flour (150 gm.), sugar (120gm.), baking powder (4 gm.), Acence (2 ml), Cardamom powder (1 gm.), Nutmeg powder (1gm.) and peanut butter/vegetable fat (appropriate ratio) were mixed by using stand mixer or electric hand mixer. Kneaded dough was prepared for7 to 8 minutes. The dough was rolled in to balls and flattened with bottom of glass. It was placed on the oily surface with enough space to spread out. The oven was heated for 10 to 15 minutes earlier. Cookies were baked at 150oC for 25 minutes. After baking process, cookies became soft so allowed it to cool to get hardness and kept it in air tight vessels.
Fatty acid composition
The presence of fatty acid was analyzed after oil extraction by soxhlet method from experimental cookies and raw materials (PB, refined wheat flour). To determine the presence of fatty acid, methyl esters of different oil samples were prepared.16 Known weight (0.250-0.500 g) of fat/oil sample was placed into a screw cap tube and 6 ml of 0.5 M methanolic sodium methoxide was added. It was mixed thoroughly on a vortex mixer and left in 70o C water bath for 10 min for dissolving the fat globules and then cooled at room temperature. To this, 0.5 ml boron trifluoride reagent was added and mixed thoroughly. It was boiled for 10 min. at 70o C in water bath and, then, allowed to cool at room temperature. 2-3 ml hexane and 1 ml HPLC grade distilled water was added. From this tube, about 1 ml of hexane layer (supernatant) was transferred to another test tube and a small amount of anhydrous sodium sulphate was added. Water free hexane containing fatty acids was injected into a Gas chromatography-Mass Spectroscopy (GC-MS, QP 2010 Plus, Shimadzu)and was run for about 30 min. The fatty acids present in the oil samples were identified and quantified using GC condition. The GC parameters were (1) Capillary column: DB-Wax (30m x 0.25 mm x 0.25µM), (2) Injector temperature: 250, (3) Injector split: 1µl (1:50), (4) Column Oven Program: 60oC→12oC/min→ 150oC (1min)→5oC/min→ 240 oC (5min) and (5)Column Flow: 1ml/min (He). The MS parameters are 1.Ion source temp:230oC, 2.Interface temp: 240oC, 3.Detector Voltage:0.84kV.
Hardness of cookies
The hardness of cookies was measured using ‘texture analyzer’ (Stable micro system, U.K.) by cutting through a blade with which was penetrated in to cookies at speed of 0.5 mm/sec till the depth of 5 mm and post speed was 10 mm/sec. The highest peak (maximum force) was considered as hardness of cookies at that time cookies broken in to two major pieces. When the knife further penetrated in to cookies, force was reduced and it was cut in to broken smaller pieces. The variation in the observation was recorded for different cookies provided as sample (cookies) properties.
Sensory Evaluation
The mean of colour, a colour of crumb, a texture of crumb, surface characteristics, taste and mouth feel by a panel of 10 judges on a 7-point scale (1 for very and 7 for excellent overall qualities) showed the overall sensory quality.
Statistical analysis
The ANOVA (completely randomized design) method was used for analysis of data related to three times replicated cookies for all parameters.17
Results and Discussion
Fatty acid composition of raw materials
Fatty acid analysis of vegetable fat showed that it contains highest proportion of total SFA which is (60.35%) followed by 37% total MUFA and 2.62% total PUFA (Table 1). Wherever the highest oleic acid was (34.56%) in vegetable fat as in which palmitic acid (44.65%) as SFA and linoleic acid (2.62%) as PUFA, however other fatty acids were recorded in lower concentrations (Table 1). 37% oleic acid, 24% palmitic acid and 21.1% linoleic acid in vegetable fat were recorded. Change in fatty acid content of vegetable fat was varied based on the amount of vegetable fat used in its production.18
Fatty acids analysis of peanut butter showed that it contains the highest amount of total MUFA (56.57%), total PUFA (18.83%) and also total SFA (30.86%). Percentage of oleic acid (38.43 %) was greatest in peanut butter than linoleic acid (18.74%) and palmitic acid (14.46%). SFA like palmitic acid and stearic acid were recorded in high proportion significantly (p <0.01) highest in vegetable fat than PB however, MUFA and PUFA like oleic acid and linoleic acid were significantly (p < 0.01) highest in PB than that of the vegetable. While refined wheat flour contained only 1 percent fat so its contribution in experimental cookies is not much important. Due to the highest oleic acid (52%) followed by linoleic acid (26.2%) in peanut butter it has a high nutritive value than other fats and butter. Content of fatty acids were not similar in products of PB and peanut. It changes with area of production and variety.19
Fatty acid content of cookies
Study revealed that total SFA was highest (62.45%) in control cookies but as proportion of PB was increased, Total SFA was decreased gradually which is shown in table 2. In treatment T6the amount of vegetable fat was completely reintegrated by PB so percentage of SFA comes to the lowest range (33.29%). The reason was due to the high amount of SFA found in vegetable than PB. In treatment T3 MUFA content was found 37.27%, where, 40 % vegetable fat and 60 %peanut butter. In treatment T4 MUFA content was found 37.45 % where, 60 % vegetable fat and 40 % peanut butter were added as raw materials to make cookies. In treatment T6 highest MUFA and total PUFA was found 47.50 % and 18.91% respectively. Where, 100% vegetable fat was back up by PB (Table 2).This was probably due to the high content of PUFA (18.91%) in PB, which was100% used to make T6 cookies in place of vegetable fat. The ratio of linoleic acid to total SFA is called nutritional quality index which was found 0.18 (T4) against 0.14 (control cookies). The result recorded of major Fatty acids like palmitic, stearic, oleic and linoleic acids, in the Turkish biscuits, which supported the present study.20
Peanut butter incorporated cookies contained valuable MUFA and PUFA
MUFA and PUFA are blood cholesterol lowering fatty acids and so it decreased the hazards effect of coronary heart diseases.21 In addition it also contains many other nutrients which are beneficial to heart like protein, folic acid, arginine, vitamin E, plant sterols, soluble fiber, copper, zinc, magnesium and selenium.22 Daily supplement of PB can reduce the disease related to heart by 21% however less fat diet decreased it by 12%.23 Total cholesterol level can be reduced by 10% and LDL cholesterol by 14% by using PB diets as it contains high MUFA.24
Sensory acceptability
In treatment T3 40% vegetable fat was replaced by PB which showed improved overall sensory quality (Fig. 1). But when 100% PB was supplemented, cookies became soggy and hard with irregular puffing.25 It was noted that 40% replacement of vegetable fat with PB did not affect spread ratio but replacement of 75 and 100% PB increased spread ratio.26 However, increasing proportion of PB in cookies led to weight increase. The product trustworthiness was disapproved when fat was incorporated by more than 50% with mung bean paste.27 Higher approval of kinema- supplemented (Fermented soybean used product) cookies compared with full fat soybean flour supplemented cookies.28
Table 1: Fatty acid composition of raw materials.
| Sr.No | Fatty acid(% distribution) | Vanaspati | Maida | Raw peanut | Peanut Butter | Pooled mean | S.Em.± | CD at5 % | CV% | ||||||||||||
| A. Saturated Fatty Acids (SFA) | |||||||||||||||||||||
| 1. | Lauric acid, C12:0 | 0.68 | 0.18 | – | 0.03 | 0.30 | 0.01 | 0.04 | 9.77 | ||||||||||||
| 2. | Myristic acid, C14:0 | 1.92 | 0.25 | 0.15 | 0.08 | 0.60 | 0.01 | 0.05 | 4.25 | ||||||||||||
| 3. | Palmitic acid, C16:0 | 44.65 | 28.44 | 16.19 | 14.46 | 23.44 | 0.23 | 0.76 | 1.55 | ||||||||||||
| 4. | Stearic acid, C18:0 | 13.10 | 2.76 | 5.33 | 7.55 | 7.18 | 0.05 | 0.15 | 1.11 | ||||||||||||
| 5. | Arachidic acid, C20:0 | – | – | 2.94 | 3.35 | 3.15 | 0.08 | 0.31 | 4.17 | ||||||||||||
| 6. | Behenic acid, C22:0 | – | 0.42 | 2.67 | 5.39 | 2.83 | 0.16 | 0.57 | 9.98 | ||||||||||||
| B. Mono-Unsaturated Fatty Acids (MUFA) | |||||||||||||||||||||
| 7. | Palmitoleic acid C16:1 | 0.06 | 0.14 | – | 0.13 | 0.11 | 0.01 | 0.02 | 9.75 | ||||||||||||
| 8. | 7-Hexadecenoic acid C16:1 | – | 1.61 | – | – | 1.61 | – | – | – | ||||||||||||
| 9. | Oleic acid, C18:1 | 34.56 | 16.38 | 57.32 | 38.43 | 36.67 | 0.23 | 0.76 | 1.10 | ||||||||||||
| 10. | 10-Octadecenoic acid C18:1(trans oleic acid) | 2.34 | – | – | 8.18 | 5.26 | 0.04 | 0.18 | 1.45 | ||||||||||||
| 11. | Elaidic acid C18:1(trans oleic acid) | – | – | – | 8.13 | 8.13 | – | – | – | ||||||||||||
| 12. | 11-Eicosenoic acid C20:1 | – | – | – | 1.7 | 1.7 | – | – | – | ||||||||||||
| C. Poly-Unsaturated Fatty Acids (PUFA) | |||||||||||||||||||||
| 13. | Linoleic acid, C18:2 | 2.62 | 46.70 | 14.50 | 18.74 | 20.64 | 0.14 | 0.46 | 1.17 | ||||||||||||
| 14. | Linolenic acid, C18:3 | – | 3.42 | – | 0.09 | 1.75 | 0.03 | 0.12 | 2.98 | ||||||||||||
Table 2: Fatty acid composition of experimental cookies supplemented with peanut butter
| Sr.No. | Fatty acid (% distribution) | Treatments | Pooled mean | S. Em.± | CD at5 % | CV% | ||||||
| T1 | T2 | T3 | T4 | T5 | T6 | |||||||
| A. Saturated Fatty Acids (SFA) | ||||||||||||
| 1. | Lauric acid C12:0 | 0.58 | 0.67 | 0.78 | 0.58 | 0.45 | 0.32 | 0.57 | 0.03 | 0.09 | 9.10 | |
| 2. | Myristic acid, C14:0 | 2.42 | 2.35 | 2.34 | 2.33 | 2.14 | 2.29 | 2.34 | 0.11 | 0.34 | 8.16 | |
| 3. | Palmitic acid, C16:0 | 48.65 | 40.67 | 37.78 | 39.27 | 31.50 | 17.58 | 35.91 | 0.28 | 0.85 | 1.33 | |
| 4. | Stearic acid, C18:0 | 10.65 | 9.45 | 8.68 | 9.20 | 7.22 | 7.14 | 8.72 | 0.09 | 0.27 | 1.71 | |
| 5. | Arachidic acid, C20:0 | 0.15 | 0.29 | 0.66 | 0.38 | 2.17 | 2.24 | 0.98 | 0.06 | 0.17 | 9.94 | |
| 6. | Behenic acid, C22:0 | – | 8.76 | 2.62 | 1.04 | 0.56 | 3.45 | 3.29 | 0.12 | 0.39 | 6.53 | |
| B. Mono-Unsaturated Fatty Acids (MUFA) | ||||||||||||
| 7. | Palmitoleic acid C16:1 | 0.65 | 0.14 | 0.26 | 0.06 | 0.14 | 0.15 | 0.23 | 0.01 | 0.04 | 9.52 | |
| 8. | Oleic acid, C18:1 | 26.54 | 26.91 | 34.57 | 31.62 | 32.86 | 31.58 | 30.68 | 0.21 | 0.66 | 1.21 | |
| 9. | 10-Octadecenoic acidC18:1(trans oleic acid) | 1.53 | 1.76 | 2.44 | 2.21 | 1.83 | 2.61 | 2.06 | 0.08 | 0.25 | 6.80 | |
| 10. | Elaidic acidC18:1(trans oleic acid) | – | – | – | 3.56 | 7.34 | 13.61 | 8.17 | 0.13 | 0.47 | 2.82 | |
| 11. | C. Poly-Unsaturated Fatty Acids (PUFA) | |||||||||||
| 12. | Linoleic acid, C18:2 | 8.80 | 8.41 | 9.54 | 9.72 | 13.45 | 18.65 | 11.43 | 0.19 | 0.58 | 2.86 | |
| 13. | Linolenic acidC18:3 | – | 0.42 | 0.36 | 0.26 | 0.55 | 0.26 | 0.52 | 0.02 | 0.06 | 8.53 | |
Where; T1 = Control, V 100: PB 0, T2 = V 80: PB 20; T3 = V 60: PB 40; T4 = V 40: PB 60; T5 = V 20: PB 80; T6 = V 0: PB 100.
Cookies hardness
Hardness of cookies was increased when the increasing the level of Peanut butter instead of vegetable (Fig. 1). The reason behind increasing hardness can be decreased total fat in the cookies as gradual increasing proportion of PB. Same result was found in sweet cookies up to 40% wheat which was replaced with fat free soy flour in sugared cookies and hardness was increased. Cookies textures gradually become harder as 10, 15 and 50% wheat flour was replaced by fat free white skin peanuts. When oatrim, the carbohydrate situated fat replaced 75 and 100% of the butter in PB cookies, activity of water and color get increased, cookie extension and hardness was decreased. It was noted that 0.1% sodium stearoyllactylate repressed the brittleness but observed in a hard cookie.
There was gradual but significant decrease in diameter of cookies which was mentioned in Table 3. Thickness of cookies was significant during T1 to T6 treatments, which was due to irregular puffing and sogginess in experimental cookies prepared with replacement of vegetable fat with peanut butter. Spread ratio was found higher (4.08) in control cookies and recorded significant change between T1 and T2 treatment, followed by significantly declined at T3 treatment again, non- significant change for T3 to T4 treatment. It significantly declined in T4 to T6 treatments compared to control cookies.
Table 3: Physical Characteristics of Cookies Made from Varying Levels of Vanspati (Hydrogenated Fat) and Peanut Butter.
| Sr.No. | Treatments(V : PB) |
Diameter (mm) (D) |
Thickness (mm)(T) | Spread ratio(D/T) | Weight (g) |
Hardness (g force) |
| 1. | ControlT1 (100 : 0) | 45.27 | 11.30 | 4.08 | 9.62 | 19189.33 |
| 2. | ExperimentalT2 (80: 20 ) | 42.00 | 14.50 | 2.92 | 10.15 | 22051.67 |
| 3. | ExperimentalT3 (60 : 40) | 40.73 | 16.47 | 2.45 | 10.33 | 25608.00 |
| 4. | ExperimentalT4 (40 : 60 ) | 39.10 | 18.48 | 2.13 | 11.05 | 26009.00 |
| 5. | ExperimentalT5 (20 : 80 ) | 36.80 | 21.37 | 1.74 | 12.07 | 26509.67 |
| 6. | ExperimentalT6 (0 : 100 ) | 34.67 | 22.39 | 1.53 | 13.08 | 49453.67 |
| Pooled mean | 39.76 | 17.42 | 2.48 | 11.05 | 28136.89 | |
| S. Em. ± | 0.47 | 0.12 | 0.02 | 0.07 | 192.62 | |
| CD at 5 % | 1.45 | 0.38 | 0.05 | 0.22 | 595.11 | |
| CV % | 2.05 | 1.21 | 1.19 | 1.13 | 1.19 | |
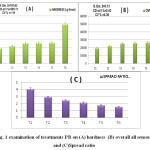 |
Figure 1: Influence of treatments peanut butter on (A) hardness (B) overall all sensory and (C)Spread ratio Click here to View figure |
Conclusion
From Above study it can be concluded that the negligible reduction in the organoleptic score of the experimental cookies containing peanut butter was observed when vegetable fat was substituted up to 40% of peanut butter (T3). Thus, this level of added peanut butter was treated as optimum level in the experimental cookies without much adverse effect on the acceptability i.e. sensory attributes. Cookies’ hardness was elevated with increasing incorporation of vegetable fat with peanut butter. This could be due to increase in protein content and reduction in fat content in the experimental cookies. The SFAs namely; stearic acid, myristic acid, lauric acid, palmitic acid, etc. were found higher in control cookies and significantly declined with rising volume of peanut butter in the developmental cookies. This could be beneficial for heart patients. Oleic acid (MUFA) was found least in control cookies, which was significantly increased when 20 % vegetable fat was replaced by peanut butter (T2) followed by non-significant increase for the rest of treatments (T2 to T6). Nutritionists give more importance to MUFA contents so as to restrict cardiac problems. Linoleic acid (PUFA) was found lower in control cookies and it significantly increased with incorporation of peanut butter in experimental cookies. This could be considered beneficial from the nutritionist point of view for controlling atherosclerosis.
Conflict of interest
Now a days, there are continuously an increase in cardiac disease in human which is majorly cause by intake of saturated fatty acid in our diet. The peanut butter have a high amount of unsaturated fatty acids which is beneficial for human health and it has better nutritional quality so we can decline the risk of cardiac disorder by the replacement of SFAs with the USFAs ( unsaturated fatty acids ). The main source of peanut butter is groundnut which is the easily available and comparatively cheaper than vegetable ghee.
Acknowledgements
All authors are thankful to the Professor and Head, department of Biochemistry, Junagadh Agriculture University (JAU) Junagadh, for the providing the instruments, other laboratory facilities and funding for this research work.
References
- Abegaz, E. G.; Kerr, W. L. and Koehler, P. E. Descriptive sensory analysis of stored model peanut confections with different sugar, moisture, and antioxidant levels. Peanut Science. 2006;33(1):53-59.
CrossRef - Arshad, M. U.;Anjum, F. M. and Tahir. Zahoor nutritional assessment of cookies supplemented with defatted wheat germ. J. Food Science. 2007;102(1):123–128.
- Chun, J. Y. Vitamin E content and stability in peanuts and peanut products during processing and storage.M.A.G., Korea University, Korea. 2002.
- Bartolozzi, G.; Bizzozero, N. and Pistis, A. An investigation on the fat content of industrial biscuits. J. Industrie Alimentary. 2000;39:1391-1393.
- Dhamsaniya, N. K.; Patel, N. C. and Dabhi, M. N. Selection of groundnut variety for making a good quality peanut butter. J. Food Science Technology. 2012;49(1):115–118.
CrossRef - Moore K. M. and Knauft D. A. The inheritance of high oleic acid in peanut. J. of Heredity. 1989;80:252-253.
CrossRef - Anonymous. Peanut oil one of the world traditional healthy oils, www.peanut- institute.org. 2001;9(3).
- Lam, C.; Wong, D.; Cederbaum, S.;, Lim, B.; Qu, Y. Peanut consumption increases levels of plasma very long chain fatty acids in humans, J. Molecular genetics and metabolism. 2012;13:41-45.
CrossRef - Anonymous. Food For Thought Dietary Guidelines Take another Look at Fat 5(1), www.peanutsusa.com. 2001.
- Woodroof, J. G.; Thompson, H. and Cecil, S. R. How refrigeration protect quality of peanut. J. Food Industry. 1949;21:66-71.
- Sahar, R. and El-Hady. Utilization of defatted wheat germ flour as nutrient J. Agricultural. Research Kafer El-Sheikh University. 2012;38(1):238-253.
- Lee, S. S.; Kim, M. B.; Chun, J. C.; Cheong, Y. K. and Lee, J. Analysis of trans-resveratrol in peanuts and peanut butters consumed in Korea. J. Food Research International. 2004;37:247–251.
CrossRef - Freeman, A. F.; Morris, N. J. and Willich, R. K. Peanut butter. U. S. Dept. Agril. AIC. 1954;370.
- Watt, B. K. and Merrill, A. L. Composition of foods, USDA, Agric, Handb.8, U.S. Dept. Agric., Washington, D.C. 1963.
- Sadaf, J.; Bibi, A.; Raza, S.; Waseem, K.; Jilani, M. S. and Ullah, G. Peanut butter incorporation as substitute for shortening in biscuits: Composition and acceptability studies. J. International Food Research. 2013;20(5):3243-3247.
- Woodroof, J. G. Peanuts: production, processing, products. The-AVI publishing company, Inc., (III ed.), West port, Connecticut. 1983.
- Misra J. B. and Mathur R. S. 1998. A simple and economical procedure for transmethylation of fatty acids in groundnut oil for analysis by GLC. J. International Arachis News Letter, 18: 40-42.
- Snedecor, G. W. and Cocharan, W. G.Statistical methods, 6th Ed., Oxford and IBH Publishing Co, Calcutta. 1967.
- Paul, A. A. and Southgate, D. A. T. Fatty acid composition. In “The composition of foods” Elserier / Muth- Holland Biomedical press, New york. 1978;289-300.
- Nagaraj, G. Groundnut: In “quality and utility of oilseeds”: Published by Directorate of oilseeds Research. Hyderabad. 1995;2-8.
- Daglioglu, O.; Tasan, M. and Tuncel, B. Determination of fatty acid composition and total trans fatty acids of Turkish biscuits by capillary gas liquid chromatography. European Food Research and Technology. 2000;211: 41-44.
CrossRef - Kris-Etherton; Pearson, T. A.; Wan, Y.; Hargrove, R. L.; Moriarty, K.;Fishell, V. andEtherton, T. D. High-monounsaturated fatty acid diets lower both plasma cholesterol and triacylglycerol concentrations. J. clinical nutrition. 1999;70(6):1009-1015.
- Gandhi AP, Srivastav DC, Parihar VS, Nadh PR, Kotwaliwale N, Kawalkar J. Effect of incorporation of defatted soy flour on the quality of sweet biscuits. J Food Sci Technol. 2001;38:502–50.
- Ory RL, Conkerton EJ. Supplementation of bakery items with high protein peanut flour. J Am Oil Chem Soc. 1983;60:986–989.
CrossRef - Swanson RB, Garden LA, Parks SS. Effect of carbohydrate based fat substitute and emulsifying agents on reduced fat pea-nut butter cookies. J Food Quality. 1999;22:19–29.
CrossRef - Gajera HP, Kapopara MB, Patel VH, Patel MM. Influence of peanut butter on quality characteristics of biscuits. J Food Sci Technol. 2008;45:373–375
- Adair M, Knight S, Gates G. Acceptability of peanut butter cookies prepared using mungbean paste as a fat ingredient substitute. J Am Dietetic Assoc. 2001;101:467–469
CrossRef - Shrestha AK, Noomhorm A, NoomhormAthapol. Com-parison of physico-chemical properties of biscuits supple-mented with soy and kinema fours. IntJ Food Sci Technol. 2002;37:361–368.
CrossRef
Accepted on: 24-10-2017


Web of Science Coverage
Emerging Sources Citation Index (ESCI)
2024 Journal Impact Factor: 1.1
Scopus Journal Metrics
CiteScore 2025: 2.6
CiteScore Details
Sustainable Nutrition: Food Systems, Nutrient Retention, and Public Health Impact
![]()
This journal is a member of, and subscribes to the principles of, the Committee on Publication Ethics (COPE)


