An investigation into the pragmatic diets of vegetarianism: The results of a pilot study
Derek Obersby1*
1University of West London, School of Psychology, Social Work and Human, Sciences, Paragon House, Boston Manor Road, London, TW8 9GA, UK
2University of West London, London School of Hospitality and Tourism, St Mary’s Road, Ealing, London W5 5RF, UK
3Glasgow Caledonian University, Fashion Street London, E1 6PX, UK.
Corresponding Author Email: dr.derek.obersby@btinternet.com
DOI : http://dx.doi.org/10.12944/CRNFSJ.4.3.01
Download this article as:
![]()
Published recommended various classifications of vegetarian diets are widespread across the globe, but few published articles if any report on the types of foods actually consumed by vegetarians in general. The primary objective was to elucidate this aspect of vegetarianism, analysis of food consumption over a fourteen day period, with respect to the various manifestations of vegetarianism, was undertaken in the form of a pilot study to indicate the contents of these diets as compared with recommended daily allowances (RDA) and adequate intake (AI) values.
Five lactovegetarians, twenty lactoovovegetarians and fourteen vegans, were recruited. The study included a detailed analysis of the vegetarian participants’ diet, through the compilation of an individual diet diary. Statistical analysis employing Microsoft Excel software was conducted to determine the outcome of the vegetarians’ diets, with each mean nutrient and mean dietary energy value compared against RDA and AI.
Analysis of the participants’ diet diaries indicated somewhat unexpectedly a failure to meet the RDA and AI for several important nutrients. Furthermore, the daily metabolizable energy level for all classifications of vegetarians was lower than the recommended AI for daily energy requirements.
Whilst it is generally accepted that vegetarianism can lead to a healthy lifestyle, the findings of this research indicate that vegetarianism participants may be at risk of deficiency of certain nutrients that could potentially lead to chronic medical conditions. The statistical findings obtained in the study will allow an accurate sample size to be calculated for each important item for future large definitive studies.
KEYWORDS:Dietary nutrient intake; Dietary energy intake; Nutrient deficiency; Recommended daily allowance
Introduction
Worldwide there are 75 million vegetarians by choice and 1.45 billion by necessity.1 This is consistent with the approximation of 25% of the world’s population consuming a largely vegetarian diet.2
There are ten recognised classifications of vegetarianism. The most common types being vegan, lactovegetarian (LV) and lactoovovegetarian (LOV).
The defining differences in these most common diets are as follows 3-5:
Vegan
Diet excludes all animal flesh and animal products, and any product tested on animals.
LV
Diet excludes all animal flesh and animal products. They do consume dairy products.
LOV
As per LV, but with eggs included.
Please note that in this paper references to vegetarian or vegetarianism is to be taken as LV, LOV and vegan diets.
This investigation focuses on vegan, LV and LOV diets, with the aim of comparing daily intake of nutrients and energy content of these diets with published RDA and AIs. However,
It was highly unlikely that an accurate calculation of the sample size of a meaningful study could be established unless it was based on existing strong evidence.6,7 In view of the rarity of existing published articles that cover this topic, the present pilot study undertaken was designed to provide an insight into the contents of these types of diets. Also, the statistical findings obtained relating to population variances and standard deviations will allow an accurate sample size to be calculated for each important item for future large definitive studies.8
Materials and Methods
This study comprises an in-depth analysis of the diet diaries of LV, LOV and vegans who previously took part in a double blind placebo controlled clinical pilot study conducted by the same authors of this paper and published in this journal.9 The study was conducted according to the guidelines laid down in the WMA Declaration of Helsinki10 and all procedures involving human subjects were approved by the University of West London Research Scrutiny & Ethics Sub-committee. Written informed consent was obtained from all subjects.
The research findings presented in this paper are therefore a follow-on from a previously conducted pilot study that did not address the analysis of the entire contents of the diets of the participating groups of vegetarians of the trial.
Recap of recruitment of participants
Over the period July 2012 to December 2013 a total of 39 volunteers living in the UK completed their diet diaries. These subjects were recruited via the Vegetarian and the Vegan Societies and who had been practicing vegetarianism for >3years. These subjects comprised of LV, LOV and vegans. In our study LV and LOVs were treated as one group, since there is no nutritional detrimental difference as far as the diet analysis is concerned.
Recap of inclusion criteria
Inclusion criteria were as follows, age between 18 and 65 years old; not participating in a weight reducing diet; not pregnant, lactating or trying to conceive; non-smoker; not consuming alcohol regularly (>2 units/day for females, >3 units/day for males); moderate caffeine consumption (≤ 4 cups/day of strong tea or coffee); not suffering from genetic metabolic disease; not suffering from renal failure, diabetes, thyroid disease, cardiovascular disease, dementia or cancer not using medications known to influence nutritional status.
Recap of data collection
Each participant completed a fourteen day diet diary under the strict supervision of a
Nutritional Therapist. This involved the daily recording of the quantity of all food and
beverages, consumed by the participants.
Statistical analysis
Following analysis of the diet diaries of the participants who completed the study (n=39) the
mean, SD, and CI 95% of daily consumed nutrients were calculated employing Microsoft Excel software.
Also, calculations were made of the daily mean, SD and CI 95% energy intake of the participants employing the same software.
Results and Discussion
The socio demographic characteristics of age, gender, and vegetarian classification of the participants who participated in this investigation are presented in Table 1, which shows that there were thirteen male participants with a mean age of 50.8±14.8 years old and twenty six female participants with a mean age of 44.1±14.4 years old.
Table 1: Socio demographic characteristics of volunteers who participated in the clinical trial
| Socio demographic characteristics | Age Mean | SD |
| Male | 50.8 | 14.8 |
| Female | 44.1 | 14.4 |
| Vegetarian classification (N=39 total) | Males | Females |
| Lactovegeterian | 2 (5.1%) | 3 (7.7%) |
| Lactoovogeterian | 9 (23%) | 11 (28.3) |
| Vegan | 2 (5.1%) | 12 (30.8) |
Adapted from: Obersby et al.,9
It can be observed from Table 2 and Table 3 that both the LV-LOV and the vegan diets exhibited a wide range of daily mean nutrient deficiencies, when compared with appropriate RDA and AIs. It is important to note that in compiling Table 2 and Table 3, nutrient trace values have been taken as zero, since quantities are approaching the limits of detection.11 Also, some nutrient values have been taken from manufacturers published data.
Specifically both male and female LV-LOVs as well as the vegan diets were deficient in the following components: water, protein, fibre, retinal, vitamin D, potassium, calcium, selenium, iodine, choline and TMG compared to their RDA and AIs. Furthermore, the diets of LVs and LOVs of both genders together with the female vegan diets do not meet the RDA for mean daily intake of vitamin E. Moreover, the diets of the LV-LOV for both genders did not meet the AI level for daily intake of vitamin B5. Also, the diets of the female LV- LOV diets did not meet the RDA for mean daily intake of carbohydrates; vegan diets of both genders did not meet the RDA for mean daily intake of vitamin B12. Both LV-LOV and vegan female diets did not meet the RDA for mean daily intake of vitamin B1, vitamin B3, chloride and iron. Both genders of LV-LOV and the male vegan diets did not meet the AI for mean daily intake of vitamin K. Female LV-LOV diets did not meet the AI for mean daily intake of sodium and finally male LV-LOV and female vegan diets fall slightly short of the RDA for the mean daily intake of magnesium.
Table 2: Analysis of daily diets of male LV-LOV and vegan pilot study participants
|
LV-LOV Male (n=11) |
Vegan Male (n=2) |
Adult values |
||||
| Nutrient | Mean | CI 95% | Mean | CI 95% | RDA | AI |
| Water (g) | 2001 | 1785, 2217 | 2565 | 2428, 2702 | 3700 | |
| Protein (g) | 40 | 37.2, 42.9 | 40.12 | 37.8, 42.4 | 56 | |
| Fats (g) | 57.6 | 148, 218 | 67.3 | 46.3, 88.3 | 27.5 (x) | |
| Carbohydrates(g) (a) | 183 | 73.8, 124 | 186 | 161, 211 | 130 | |
| Starch (g) | 98.7 | 73.8, 124 | 107 | 94.3, 120 | (c) | |
| Total sugar | 84.6 | 74.1, 95 | 78.7 | 66.1, 99.2 | (c) | |
| Glucose | 17.3 | 16.6, 18 | 20.6 | 19.1, 22 | (c) | |
| Fructose | 21 | 17.7, 24.4 | 21.4 | 13.8, 29 | (c) | |
| Sucrose | 36.8 | 27.5, 46 | 31.5 | 29.4, 33.5 | (c) | |
| Maltose (g) | 3.2 | 2.8, 3.7 | 5.1 | 4.2, 6.1 | (c) | |
| Lactose (g) | 6.2 | 3.6, 8.7 | 0.2 | 0.004 | (c) | |
| Dietary fibre (g) (d) | 15.8 | 14, 17.6 | 20.2 | 19.2, 21.2 | 38 | |
| Saturated fat (g) | 20.7 | 15.9, 25.6 | 13 | 7.2, 18.7 | 20 (e) | |
| Monounsaturated fat (g) | 20.7 | 16.8, 24.7 | 26.2 | 20.7, 31.6 | (c) | |
| Polyunsaturated fat(g) | 11.5 | 9.1, 11.9 | 24.5 | 16.6, 32.4 | (c) | |
| Trans fat (g) | 1.9 | 1.2, 2.5 | 0.6 | 0.5, 0.6 | ||
| Cholesterol (mg) | 134 | 103, 165 | 11.4 | 6.3, 16.4 | 300 | 2.8 (t) |
| Retinal (µg) | 236 | 197, 275 | 0 | 0, 0 | 900 | |
| Carotene(µg) | 3679 | 2680, 4678 | 2739 | 2562- 2916 | (c) | |
| Vitamin D(µg) | 1 | 0.9, 1.1 | 0.8 | 0.6, 2.2 | 5 | |
| Vitamin E(µg) | 10.1 | 7.9, 1.1 | 17.8 | 13.3, 22.3 | 15 | |
| Vitamin B1(µg) | 1.9 | 1.4, 2.3 | 1.7 | 0.5, 2.8 | 1.2 | |
| Vitamin B2(µg) | 2.1 | 1.9, 2.3 | 1.3 | 1, 1.7 | 1.3 | |
| Vitamin B3(µg) | 17.5 | 15.9, 19.2 | 16.8 | 9.4, 24.2 | 16 | |
| Vitamin B6(µg) | 1.8 | 1.6, 2 | 1.8 | 1.7, 2 | 1.3 | |
| Vitamin B12(µg) | 2.5 | 1.9, 3.2 | 1.3 | -0.1, 2.8 | 2.4 | |
| Folate(µg) | 511 | 504, 518 | 425 | 164, 686 | 400 | |
| Vitamin B5(µg) | 3.2 | 3.1, 3.4 | 8.2 | -1, 17.5 | 5 | |
| Biotin (mg) | 38.8 | 37, 40.4 | 43.6 | 21.4, 41.9 | 30 | |
| Vitamin C(mg) | 108 | 59.8, 156 | 120 | 60.7, 179 | 90 | |
| Vitamin K(µg) | 88.1 | 75.5, 101 | 101 | 27.1, 175 | 120 | |
| Sodium (mg) | 1819 | 1535, 2103 | 1623 | 1532, 1714 | 1500 | |
| Potassium (mg) | 2726 | 2345, 3107 | 3255 | 2458, 4052 | 4700 | |
| Calcium (mg) | 636 | 589, 683 | 668 | 568, 768 | 1000 | |
| Magnesium(mg) | 405 | 361, 449 | 431 | 381, 481 | 420 | |
| Phosphorus (mg) | 907 | 787, 1027 | 945 | 838, 1052 | 700 | |
| Iron (mg) | 8.8 | 7.9, 9.7 | 14.2 | 11, 17.4 | 8 | |
| Copper (mg) | 1.1 | 0.9, 1.4 | 1.7 | 1.3, 2.2 | 0.9 | |
| Zinc (mg) | 11.7 | 7.3, 16.1 | 12.5 | 1.3, 23.8 | 11 | |
| Chlorine (mg) | 3095 | 2652, 3538 | 2805 | 2768, 2842 | 2300 | |
| Manganese(mg) | 4.6 | 3.7, 5.5 | 5.5 | 4.8, 6.2 | 2.3 | |
| Selenium (µg) | 33.5 | 22.3, 44.6 | 43.4 | 6.3, 80.4 | 55 | |
| Iodine (µg) | 72.7 | 54.5, 90.9 | 27.8 | 17.1, 38.4 | 150 | |
| Choline (mg) | 197 | 195, 199 | 205 | 183, 227 | 550 | |
| Trimethylglycine (mg) | 136 | 82.7, 189 | 148 | 107, 189 | 500 – 1000 | |
| Alcohol (g) | 13 | 10.3, 15.8 | 21.2 | 7, 35.3 | 32 (e) | |
| Methionine (mg) | 613 | 532, 694 | 616 | 468, 764 | (c) | |
Legend:
(a) Non-starch polysaccharides, (b) Moderate activity
(c) Not determined, (d) Non-starch polysaccharides.
(e) Maximum, (f) Less than.
(x) Mean acceptable macronutrient distribution range (MAMDR)
Adapted from: Foods Standards Agency 12; Dunne 13; Zeisel et al. 14; Institute of Medicine of the National Academy of Science 15; National Institute of Health 16; The American Heart Association 17; Food and Nutritional Board, Institute of Medicine, 18; U.S. National Library of Medicine 19; Linus Pauling Institute, 20; Bitelog 21; USDA Agricultural Research Service 22.
Table 3: Analysis of daily diets of female LV-LOV and vegan pilot study participants
|
LV-LOV Male (n=11) |
Vegan Male (n=2) |
Adult values |
||||
| Nutrient |
Mean |
CI 95% | Mean |
CI 95% |
RDA | AI |
| Water (g) |
1642 |
1427, 1857 |
1640 |
1075, 2204 |
2700 | |
| Protein (g) |
29.5 |
27.3, 31.8 |
30.1 |
23.1, 37.1 |
46 |
|
| Fats (g) |
46.2 |
45.1, 47.4 |
40.4 |
39.1, 41.7 |
27.5(x) | |
| Carbohydrates(g) (a) |
122 |
111, 133 |
152 |
124, 180 |
130 |
|
| Starch (g) |
60.7 |
51.7, 69.7 |
75.9 |
70.6, 81.1 |
(c) |
|
| Total sugar |
60.5 |
45.1, 75.9 |
76.2 |
53.1, 99.2 |
(c) |
|
| Glucose |
11.4 |
7, 15.7 |
23.4 |
17, 29.9 |
(c) |
|
| Fructose |
12 |
7.4, 16.6 |
25.8 |
18.5, 33.2 |
(c) |
|
| Sucrose |
28.5 |
22.4, 34,7 |
25.5 |
16.6, 34.3 |
(c) |
|
| Maltose (g) |
2.3 |
1.7, 2.9 |
1.8 |
1.2, 2.5 |
(c) |
|
| Lactose (g) |
6.2 |
4.5, 7.9 |
0 |
0, 0 |
(c) |
|
| Dietary fibre (g) (d) |
11.7 |
10.8, 12.5 |
20 |
15.7, 24.2 |
25 | |
| Saturated fat (g) |
19.7 |
18.3, 21.1 |
8 |
7.7, 8.2 |
20(e) | |
| Monounsaturated fat (g) |
15.9 |
14.2, 17.7 |
15.3 |
14.4, 16.2 |
(c) |
|
| Polyunsaturated fat(g) |
7 |
5.7, 8.3 |
12.8 |
11.3, 14.4 |
(c) |
|
| Trans fat (g) |
1.4 |
0, 2.3 |
1.1 |
0.5, 1.8 |
2.8(f) | |
| Cholesterol (mg) |
119 |
70.4, 168 |
11.7 |
3.6, 19.9 |
300 |
|
| Retinal (µg) |
270 |
222, 318 |
0 |
0, 0 |
700 |
|
| Carotene(µg) |
1121 |
850, 1392 |
5424 |
2300, 8547 |
(c) |
|
| Vitamin D(µg) |
0.6 |
0.3, 0.8 |
0.5 |
0.3, 0.7 |
5 | |
| Vitamin E(µg) |
5.2 |
3.5, 6.9 |
9.4 |
9.3, 9.5 |
15 |
|
| Vitamin B1(µg) |
0.6 |
0.6, 0.7 |
1 |
0.8, 1.2 |
1.1 |
|
| Vitamin B2(µg) |
1.3 |
1, 1.6 |
1.3 |
1.2, 1.5 |
1.1 |
|
| Vitamin B3(µg) |
9.1 |
8.1, 10.1 |
10.9 |
9, 12.8 |
14 |
|
| Vitamin B6(µg) |
1.4 |
1.2, 1.6 |
1.8 |
1.6, 1.9 |
1.3 |
|
| Vitamin B12(µg) |
3.2 |
2.3, 4 |
1.2 |
0.8, 1.6 |
2.4 |
|
| Folate(µg) |
407 |
374, 440 |
434 |
421, 447 |
400 |
|
| Vitamin B5(µg) |
2.8 |
2.5, 3 |
7.5 |
3.25, 11.7 |
5 | |
| Biotin (mg) |
32.4 |
27.9, 36.8 |
31.7 |
21.4, 41.9 |
30 | |
| Vitamin C(mg) |
81.1 |
43.8, 118 |
126 |
87.3, 164 |
75 |
|
| Vitamin K(µg) |
46.8 |
45.3, 48.2 |
112 |
98.4, 126 |
90 | |
| Sodium (mg) |
1310 |
1094, 1532 |
1755 |
1074, 2436 |
1500 | |
| Potassium (mg) |
1948 |
1578, 2318 |
2575 |
2246, 2904 |
4700 | |
| Calcium (mg) |
544 |
487, 591 |
475 |
300, 650 |
1000 | |
| Magnesium(mg) |
402 |
352, 452 |
315 |
308, 322 |
320 |
|
| Phosphorus (mg) |
860 |
719, 1001 |
717 |
552, 882 |
700 |
|
| Iron (mg) |
6.8 |
5.8, 7.7 |
9.4 |
7.9, 10.9 |
18 |
|
| Copper (mg) |
0.9 |
0.8, 1 |
1.4 |
0.9, 1.8 |
0.9 |
|
| Zinc (mg) |
10.4 |
7, 13.8 |
15.3 |
7.2, 23.5 |
8 | |
| Chlorine (mg) |
214 |
211, 217 |
1926 |
1491, 2361 |
2300 | |
| Manganese(mg) |
6.1 |
4.3, 8 |
4.3 |
4.1, 4.5 |
1.8 | |
| Selenium (µg) |
18.9 |
14.4, 23.3 |
22.3 |
19.4, 25.1 |
55 |
|
| Iodine (µg) |
71.6 |
63.2, 79.9 |
24.9 |
13.6, 36.3 |
150 |
|
| Choline (mg) |
214 |
211, 217 |
183 |
1.7, 196 |
425 | |
| Trimethylglycine (mg) |
238 |
210, 266 |
223 |
204, 242 |
500-100 | |
| Alcohol (g) |
7.6 |
0.7, 14.5 |
5 |
1.8, 8.1 |
24(e) | |
| Methionine (mg) |
441 |
415, 465 |
421 |
387, 455 |
(c) |
|
Legend:
(a) Non-starch polysaccharides, (b) Moderate activity
(c) Not determined, (d) Non-starch polysaccharides
(e) Maximum, (f) Less than
(x) MAMDR
Adapted from: Foods Standards Agency 12; Dunne 13; Zeisel et al.14; Institute of Medicine of the National Academy of Science 15; National Institute of Health 16; The American Heart Association 17; Food and Nutritional Board, Institute of Medicine 18; U.S. National Library of Medicine 19; Linus Pauling Institute 20; Bitelog 21; USDA Agricultural Research Service 22.
It is recognised that whilst both male and female LV-LOV and vegan diets contained only a mean daily intake of ≤ 1µg of vitamin D, which is much lower than the daily AI of 5µg. This shortfall has the potential to be supplemented by induced vitamin D, generated from sunlight to obtain a sufficient supply of this important essential nutrient.
Dietary energy intake calculations
Calculations of the daily energy intake are based on the formula shown in Figure 1 with the appropriate nutrient values taken from Table 2 and Table 3. Conversion factors for metabolizable energy as shown in Table 4 are also utilised. The calculated energy values are presented in Table 5 and Table 6 which, assumes polyols and organic acids are omitted in the calculation of metabolizable energy, as they only represent a small percentage of energy from which there is no published validated information available. Also, it should be noted that available carbohydrate is the sum of the free sugars (glucose, fructose, galactose, sucrose, maltose, lactose and oligosaccharides) and complex carbohydrates (dextrin, starch and glycogen). These are the carbohydrates which are digested and absorbed and are glucogenic in human beings.8 Furthermore, that digestibility does not vary significantly among the participants and conversion factors for metabolizable energy of the diets are taken from
Table 4: Conversion factors for metabolizable energy of the diet
| Energy from: | Kcal/g | Kj/g |
| Protein | 4 | 17 |
| Fat | 9 | 37 |
| Available carbohydrate (monosaccharide equivalent) | 3.75 | 17 |
| Dietary fibre (Non-starch polysaccharides) | 2 | 8 |
| Total polyols | 2.4 | 10 |
| Alcohol | 7 | 29 |
| All organic acids | 3 | 13 |
Adapted from: Foods Standards Agency 12.Food and Agriculture Organization of the United Nations 23.
Table 5: Energy intakes of pilot study male participants who completed the study
| Energy from: | Mean (kcal/d) | SD(kcal/d) | CI(95%) | Mean (kcal/d) | SD(kcal/d) | CI(95%) | AI(kcal/d) |
| (A) Carbohydrate-total | 687 | 171 | 586,788 | 694 | 48 | 627, 760 | 1375 (d) |
| Starch | 370 | 158 | 277, 463 | 399 | 35 | 351, 447 | (c) |
| Total sugars | 317 | 66 | 278, 356 | 296 | 33 | 249, 341 | (c) |
| (B) Fats-total | 518 | 103 | 457, 579 | 605 | 74 | 503, 707 | 625 (e) |
| Saturated fat | 186 | 74 | 142, 230 | 117 | 38 | 65, 169 | (c) |
| Monounsaturated fat | 187 | 60 | 151, 221 | 235 | 35 | 186, 284 | (c) |
| Polyunsaturated fat | 103 | 37 | 81, 125 | 220 | 51 | 149, 291 | (c) |
| Trans fat | 17 | 10 | 11, 24 | 5 | 0.2 | 4.7, 5.2 | (c) |
| Unidentified fat | 25 | 6 | 22, 28 | 28 | 12 | 12, 45 | (c) |
| (C) Protein | 160 | 19 | 149, 171 | 161 | 12 | 151, 169 | 400(f) |
| (D) Alcohol | 91 | 33 | 72, 111 | 148 | 7 | 49, 247 | (c) |
| (E) Dietary Fibre | 32 | 6 | 28, 35 | 40.5 | 1.5 | 38.4, 42.4 | (c) |
| (F) Total per day (A)+(B)+(C)+(D)+(E) | 1488 | 203 | 1368, 1608 | 1648 | 113 | 1491, 1804 | 2500(a) (b) |
Legend:
(a) Moderate activity.
(b) Average adult.
(c) Not determined.
(d) Based on an average energy contribution of 55 %.
(e) Based on an average energy contribution of 25%.
(f) Based on an average energy contribution of 20%.
Table 5: Energy intakes of pilot study male participants who completed the study
|
|
LV-LOV (n=11) |
Vegan (n=2) |
|||||
| Energy from: | Mean (kcal/d) | SD(kcal/d) | CI(95%) | Mean (kcal/d) | SD(kcal/d) | CI(95%) |
AI (kcal/d) |
| (A) Carbohydrate-total | 687 | 171 | 586,788 | 694 | 48 | 627, 760 | 1375 (d) |
| Starch | 370 | 158 | 277, 463 | 399 | 35 | 351, 447 | (c) |
| Total sugars | 317 | 66 | 278, 356 | 296 | 33 | 249, 341 | (c) |
| (B) Fats-total | 518 | 103 | 457, 579 | 605 | 74 | 503, 707 | 625 (e) |
| Saturated fat | 186 | 74 | 142, 230 | 117 | 38 | 65, 169 | (c) |
| Monounsaturated fat | 187 | 60 | 151, 221 | 235 | 35 | 186, 284 | (c) |
| Polyunsaturated fat | 103 | 37 | 81, 125 | 220 | 51 | 149, 291 | (c) |
| Trans fat | 17 | 10 | 11, 24 | 5 | 0.2 | 4.7, 5.2 | (c) |
| Unidentified fat | 25 | 6 | 22, 28 | 28 | 12 | 12, 45 | (c) |
| (C) Protein | 160 | 19 | 149, 171 | 161 | 12 | 151, 169 | 400(f) |
| (D) Alcohol | 91 | 33 | 72, 111 | 148 | 7 | 49, 247 | (c) |
| (E) Dietary Fibre | 32 | 6 | 28, 35 | 40.5 | 1.5 | 38.4, 42.4 | (c) |
| (F) Total per day (A)+(B)+(C)+(D)+(E) | 1488 | 203 | 1368, 1608 | 1648 | 113 | 1491, 1804 | 2500(a) (b) |
Legend
(a) Moderate activity.
(b) Average adult.
(c) Not determined.
(d) Based on an average energy contribution of 55 %.
(e) Based on an average energy contribution of 25%.
(f) Based on an average energy contribution of 20%.
Mean energy intakes were found to be 1488 ± 203 kcal/d and 1648 ± 113 kcal/d for male LV-LOV and vegan diets respectively (Table 5). For female LV-LOV and vegan diets they were
found to be 1043 ± 146 kcal/d and 1129 ± 172 kcal/d respectively (Table 6).
The pictorial representation of the calculated mean energy intakes of the participants are presented in Figure 1 and Figure 2.
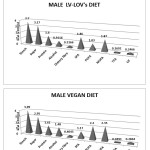 |
Figure 1: Pictorial representation of mean daily energy intake of male participants and total energy formula
|
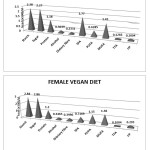 |
Figure 2: Pictorial representation of mean daily energy intake of female participants
|
Analysis of the participant food diaries indicates that there is a considerable deficiency of dietary vitamin D for both LV-LOVs and vegans indicating a likely dietary vitamin D deficiency. This can be clearly observed in Table 2 and Table 3, and these individuals are probably unaware that they need to rely on their supply of vitamin D from synthesis by the body from the sun’s ultra violet radiation. Therefore, in this instance it is reasonable to recommend that both vegetarian groups should consider supplementing their diets with this very important essential nutrient, particularly during winter months. In terms of meeting the RDA and AIs both vegetarian groups need to increase their intake of appropriate nutrients in order to satisfy their RDA and AIs. Moreover, it would not be appropriate in this investigation to recommend an increase of nutrients that are based on mean values of groups of people. This can only be effectively achieved on an individual basis (n=39), which is outside the scope of this investigation. However, it is worth noting that the deficiency of the above nutrients can potentially raise health issues, these are summarised in Table 7. The evidence obtained from Table 5 and Table 6 indicates that the mean daily intake of energy 1488 ± 203 kcal/d for male LV-LOVs, 1648 ± 113 kcal/d for male vegans, 1043 ± 146 kcal/d for female LV-LOVs and 1129 ± 172 kcal/d for female vegans appears to be low when compared with the recommended AIs of 2500 kcal/d for males and 2000 kcal/d for females for average adults who undertake moderate physical activity.
Table 6: Energy intakes of pilot study female participants who completed the study
|
LV-LOV (n=11) |
Vegan (n=2) |
||||||
| Energy from: | Mean (kcal/d) | SD(kcal/d) | CI(95%) | Mean (kcal/d) | SD(kcal/d) | CI(95%) | AI(kcal/d) |
| (A) Carbohydrate-total | 455 | 128 | 388, 522 | 570 | 157 | 481, 659 | 1100 (d) |
| Starch | 228 | 65 | 194, 262 | 284 | 35 | 264, 304 | (c) |
| Total sugars | 227 | 110 | 169, 285 | 286 | 153 | 199, 373 | (c) |
| (B) Fats-total | 416 | 46 | 392, 440 | 364 | 26 | 349, 379 | 500 (e) |
| Saturated fat | 177 | 24 | 165, 189 | 72 | 4 | 69, 74 | (c) |
| Monounsaturated fat | 143 | 31 | 127, 159 | 138 | 14 | 130, 146 | (c) |
| Polyunsaturated fat | 63 | 22 | 51, 74 | 115 | 18 | 105, 125 | (c) |
| Trans fat | 13 | 1.6 | 11.8, 13.5 | 10 | 10.1 | 4.3, 15.8 | (c) |
| Unidentified fat | 20 | 11 | 14, 26 | 29 | 5.8 | 26, 33 | (c) |
| (C) Protein | 118 | 17 | 109 | 120 | 50 | 92 | 400(f) |
| (D) Alcohol | 30.4 | 53 | 28, 78 | 35 | 39 | 13, 57 | (c) |
| (E) Dietary Fibre | 23 | 3 | 22, 25 | 40 | 15 | 31, 49 | (c) |
| (F) Total per day (A)+(B)+(C)+(D)+(E) | 1043 | 146 | 967, 1119 | 1129 | 172 | 1031, 1225 | 2000(a) (b) |
Legend
(a) Moderate activity.
(b) Average adult.
(c) Not determined.
(d) Based on an average energy contribution of 55 %.
(e) Based on an average energy contribution of 25%.
(f) Based on an average energy contribution of 20%.
Table 7: Summary of some potential health issues due to inadequate intake and deficiency of nutrients.
| Inadequate intake & deficiency of nutrient (< RDA or AI) | Some potential health issues |
| Water | Dehydration, effects include impaired mental function and motor control, reduced tolerance to stress or exercise and heat and increased resting heart rate. |
| Protein | Affects all body organs and many of its systems and the immune system , thus elevating risk of infection |
| Carbohydrates | Increased production of keto acids leading to bone mineral loss, hypercholesterolemia, and increased risk of urolithiasis. |
| Dietary fibre | Inadequate faeces bulk and may detract from optimal health |
| Vitamin D | Demineralization of the skeleton. Potential effects are rickets (in children), osteomalacia (in adults), and osteoporosis. |
| Vitamin E | Deficiency very rare only occurs as a result of genetic abnormalities of vitamin E metabolism, fat malabsorption syndromes or protein-energy malnutrition. Main symptom peripheral neuropathy. |
| Vitamin B3 | Pellagra causing pigmented rash, vomiting, depression, apathy, headache, fatigue, memory loss. |
| Vitamin B5 | Deficiency very rare only occurs with diets completely devoid of the vitamin. Main sympoms include irritability, fatigue, apathy, malaise, sleep disturbances, nausea, muscle cramps. |
| Vitamin B12 | Elevated homocysteine leading to cardiovascular disease, pernicious anemia, dementia, depression, impaired cognition, autoimmune dysfunction, neurological and gastrointestinal effects. |
| Vitamin K | Deficiency is extremely rare in the general population, in such cases an increase in prothrombin time and bleeding may occur. |
| Sodium | Overall, there is little evidence of any adverse effect of low dietary sodium intake on serum or plasma sodium concentrations in healthy people. |
| Potassium | Hypertension, increased salt sensitivity, an increased risk of kidney stones and cardiovascular disease, particularly stroke. |
| Calcium | Reduced bone mass resulting in ostcopenia, osteoporosis, and increase risk of bone fracture. |
| Magnesium | Muscle cramps, interference with vitamin D metabolism, latent tetany, spontaneous carpal-pedal spasm, seizures and hypertension. |
| Iron | Iron deficiency anemia is the most common nutritional deficiency causing reduced physical work capacity, delayed psychomotor development in infants and impaired cognitive function. |
| Chloride | Deficiency is rarely seen in healthy people because most foods that contain sodium also provide chloride. Excess depletion causes hypochloremic metabolic alkalosis |
| Selenium | May lead to biochemical changes that can predispose a person to illness associated with other stresses, such as: Keshan disease, and Kashin-Beck disease |
| Iodine | Goiter, fatigue, lethargy, high cholesterol and depression |
| Choline | Can cause liver damage, resulting in elevated alanine aminotransferase. |
|
Trimethylglycine |
Can contribute to hyperhomocysteinemia, which increases risk of developing cardiovascular disease. |
Adapted from: Institute of Medicine of the National Academy of Sciences 16; Kuwabara et al 23; Obersby et al.,24
In conclusion, the findings of this paper demonstrate that all vegetarian participants exhibit a deficiency of several important dietary nutrients that potentially could lead to chronic medical conditions. Whilst it was outside the scope of this research to recommend dietary changes on an individual basis, the results clearly show that on a group basis that there is a dire lack of vitamin B12, due to an absence of dietary animal products in vegan diets. Also, LV-LOV male diets only marginally meet the RDA for this very important nutrient. Furthermore, all groups exhibit a deficiency of dietary vitamin D, although dietary deficiency of vitamin D can be compensated by one’s exposure to sunlight.
The mean daily metabolizable energy intake for all groups of participants indicate that this is well below recommendations which, can in certain instances such as with high activity lead to certain individuals becoming significantly under weight.
The analysis of the diets provides suitable statistical data to allow the calculation of an accurate sample size for each important item of future large scale definitive studies.
Further research is called for into establishing the nutritional contents of practical vegetarian diets. Meanwhile, It is recommended for LV, LOV and vegans to carefully monitoring their diets and possibly supports these with supplements.
Acknowledgements
Our thanks go out to all respondents for their participation, Moreover, we would like to thank the Vegetarian and Vegan Societies for their help in recruiting the participants of the study, without which the research project could not have taken place.
References
- World Population of Vegetarians. The Economic and Social Research Institute. 2011. http://www.answers.com/worldpopulationofvegetarians.
- Vegetarian and vegan diets. Foods Standards Agency. 2010. http://www.food.gov.uk/northernireland/nutritionni/nigourypeople/survivorform/brea.
- Antony AC. Vegetarianism and vitamin B12 (cobalamin) deficiency. Am J Clin Nutri;78 (1): 3-6: (2003).
- Key TJ, Appleby PN, Rosell S. Health effects of vegetarian and vegan diets.Proc Nutri Soc; 65: 35-41: (2006).
CrossRef - Craig WJ. Position of the American Dietetic Association: vegetarian diets.J Am Die Soc; 109 (7): 1266-1282: (2009).
- Whitey E & Ball J. Statistics review 4: sample size calculations. Crit Care; 6: 335-345:(2002).
CrossRef - Kirby A, Gebski V, Keech C. Determining the sample size in a clinical trial. Med J Aust, 256-257: (2002).
- Bartlett H, Kotrlik JW, Higgins CC. Organizational research: determining appropriate sample size in survey research. Int Tech Learn Performance J, 19: 43-50: (2001).
- Obersby D, Chappell DC, Dunnett A, Tsiami AA. Efficacy of methylcobalamin to normalise elevated homocysteine of vitamin B12 deficient vegetarians; a double blind placebo control study. Current Res Nutr Food Sc; 3(3): 187-196: (2015).
CrossRef - Ethical principles for medical research involving human subjects.WMA Declaration of Helsinki. 1964. http://wma.net/en/30publications/10policies/b3/.
- Namiesnik, J. Trace analysis. Crit Rev Anal Chem; 32 (4): 271-300: (2002).
CrossRef - Foods Standards Agency: McCance and Widdowson’s the composition of foods, sixth summary edition. Cambridge: Royal Society of Chemistry; 2002Dunne LJ: Nutrition Almanac fifth edition New York: McGraw-Hill; 2002
- Zeisel SH, Mar MH, Howe JC, et al. Concentrations of choline-containing compounds and betaine in common foods. J Nutri; 133: 1302-1307: (2003).
- Institute of Medicine of the National Academy of Sciences. Dietary references intakes tables and applications November edition. Washington DC: National Academy Press;2010.
- Nutrient recommendations. National Institute of Health. 2011: http://ods.nih.gov/information/DietaryReferenceIntakes.aspx.
- Trans fats and saturated fats. The American Heart Association 2011: https://heart.organisation.
- Food and Nutritional Board. Institute of Medicine Dietary reference intakes: recommended dietary allowances and adequate intakes. Washington DC: National Academy Press; 2011.
- Vitamin K. US National Library of Medicine. 2013. http://www.nim.nih.gov/medicineplus/enoy/article/002407.htm.
- Recommendations dietary allowances. Linus Pauling Institute. 2013. http://lpi.oregonstate.edu/infocenter/choline/ribotlavin/.
- Narrow food search. Bitelog. 2014. http://www.bitlog.com/diet/.
- National database for standard reference release 26. USDA Agricultural Research Service. 2014. ndb.nal.usda.gov/ndb/search/list.
- Conversion factors for metabolizable energy of nutrients. Food and Agriculture Organization of the United Nations. 2003. http://.fao.org/docrep/006/y50022e/5022e07.htm.
- Kuwabara S, Nakazawa N, Azuma N, et al. Intravenous methylcobalamin treatment for uremic and diabetic neuropathy in chronic hemodialysis patients. Int Med J; 38:472-475: (1999).
CrossRef - Obersby D, Chappell DC, Tsiami AA. Plasma total homocystine and its relationship with cardiovascular disease. J Nutr Thera; 2(4): 182-193: (2013).


Web of Science Coverage
Emerging Sources Citation Index (ESCI)
2024 Journal Impact Factor: 1.1
Scopus Journal Metrics
CiteScore 2025: 2.6
CiteScore Details
Sustainable Nutrition: Food Systems, Nutrient Retention, and Public Health Impact
![]()
This journal is a member of, and subscribes to the principles of, the Committee on Publication Ethics (COPE)


