Introduction
Overweight and obesity have been established as one of the public health concern of the 21st century by World Health Organization.1. In the last few decades, the cause of death especially in the developing country like Nigeria has gradually been shifting from the infectious diseases to Non Communicable Diseases (NCDs) that were strongly attributed to overweight and obesity.3,4,5,6 Globally, the prevalence of overweight and obesity among children and adolescents has significantly increased over the last three decades particularly in Africa, Eastern Mediterranean Region (EMR) and Asia. 7,8,9,10,11,12,13 It has been established through several studies that overweight and obesity caused high morbidity and mortality among different age groups.13 Adolescents who are overweight could experience conditions like depression, anxiety, low-self esteem and peer rejection.2 Overweight and obesity are nutritional disorders emanating from calorie imbalances. These disorders develop when calorie consumption surpasses calorie expenditure, and the excess calorie gradually accumulates which later results into abnormal weight gain. Furthermore, the underlying causes of overweight and obesity were unhealthy food consumption and physical inactivity. These causes were formerly attributed to affluence but of recent, the disorders could be experienced by all the socio- strata.14,15,16,17,18,19,20 Although the predictive factors of overweight and obesity development are becoming more contextual due to how the condition is determined and what parameter was used to establish its occurrence in an individual. However, the behavioral factors are still paramount in the determination of overweight and obesity among adolescents.21,22,23,24 Human behavior is dynamic within certain situations. For instance, economic developments in Africa had changed the lifestyle of people in relation to consumption of certain foods and drinks, their means of transportation, relaxation, the percentage of income spent on social activities and domestic appliances available in their homes. According to Dr. David, an associate professor in the department of human health and nutritional sciences, university of Guelph, Canada, “Obesity is a complex disease that is highly influenced by an individual’s lifestyle habits (diet & physical activity). Importantly, each of these lifestyle habits can influence the activity of our genes, and ultimately an individual’s susceptibility to developing disease’’
Adolescents are exposed to this changed lifestyle early in life that it is seen as the best form of life to live. The dietary transition recently going on in Africa is contributing greatly to high mortality and morbidity attributed to overweight and obesity.26,27,9,28,29 The frequency of consumption of energy dense snacks and sugary beverages has increased considerably particularly among the adolescents students in urban areas and in private schools. Also physical inactivity which has been observed to increase among the adolescents due the use of varieties of electronic devices that keep them awake almost always throughout the night.30,31,32,33 School sporting and physical activities practice have been judged to equally be on the decline as a result of inadequate governments support for sports in public schools.33,34,35
In Nigeria, overweight and obesity disparities exist between adolescents in private and public schools. Overweight and obesity prevalence have been reported to be on the increase among students in private secondary schools but very few research studies were carried out in public schools.36,37,38,39,40 The need to appraise determinants of overweight and obesity of the public secondary schools students in Kwara state was a worthwhile task, hence this study was carried out in order to enable the policymakers and caregivers as well as administrators of public schools make decisions that will help improve the nutritional status of public students for healthy living.
Material and Methods
Cross-sectional analytical design was used in the study because it was ideal for rapid data collection in which large sample size is involved. The study was conducted in the southern senatorial districts comprised of seven local government areas in the state. A multistage random sampling technique was used to select 515 participants (343 girls and 172 boys) from 8 public secondary schools among 32 public secondary schools within two zonal inspectorate divisions. Research assistants for the study were trained for two days in order to sensitize them for the purpose of the study and to standardize the instruments of data collection so as to minimize errors. Also pilot study was carried out in a separate school from the participating schools so as to identify challenges that participants may face and also to make appropriate adjustment before the main study was conducted. Data was collected using a modified Food Frequency Questionnaire (FFQ), physical activity questionnaire for adolescents, digital bathroom scale and stadiometer. The food frequency questionnaire (FFQ) was self-administered with 4 optional responses, (1) never/once per week, (2) 2-3 times per week, (3) 4-5 times per week, (4) more than 5times per week. Participants reported their food consumption by choosing appropriate option. Similarly, physical activity questionnaire for the participants contained 4 options to indicate the frequency of their involvement in physical activity per week. Metabolic equivalent (METs) of participants were calculated using (metabolic equivalent for each physical activity*minutes*days). Total METs for individual participant was determined and categorized according to standard practice. . Participants responded to the questionnaire when they were seated in a well ventilated and spacious classroom. Participants’ weights and heights were measured using digital weighing scale and stadiometer respectively. Data was analyzed using statistical package for social science (SPSS version 20) and Anthro-plus package was also used to determine overweight and obesity status of the participants.
Results
Table 3.1 Demographic characteristics of participants
| Participants characteristics | No. of participants | % of participants |
| GenderMaleFemale | 172343 | 33.466.6 |
| TOTAL | 515 | 100% |
| Age Distribution (years/months) 9.6-12.512.6-15.515.6-18.518.6-19.5 | 2616227849 | 5.031.554.09.5 |
| TOTAL | 515 | 100% |
| Type of schoolBoysGirlsMixed | 116 | 12.512.575.0 |
| TOTAL | 8 | 100% |
In table 3.1 above, many of the participants were female (66.6%), also the higher proportion of them were between 15years and 6months to 18 years and 5months and 75% of the participants came from mixed schools. This result may influence the food consumption as well as physical activity practice of the participants and equally contribute to overweight and obesity prevalence among them.
Table 3.2: Demographic characteristics of participants
|
Participants characteristic |
No. of participants |
% of participants |
| Participants means of transportation to schoolMotorcyclesPublic transportwalkedParents/guardians or cars | 1192631852 | 23.15.161.710.1 |
| TOTAL | 515 | 100% |
| Participants by whom they lived with.ParentsGuardiansAlone | 259123133 | 50.323.925.8 |
| TOTAL | 515 | 100% |
Table 3.2 indicated that majority of participants walked to school (61.7%) and about a half of them lived with parents. Walking to school daily will improve physical activity of participants; also, living with parents could influence the participants’ food consumption as well as activity practice at home. The result could be a contributing factor in overweight and obesity of participants.
Table 3.3: Demographic characteristics of participants’ parents or guardians
|
Participants characteristic |
No. of participants | % of participants |
| Educational background of participant’s parents/guardiansNonePrimarySecondaryUniversityOthers | 63201055925 | 1.262.120.411.54.9 |
| TOTAL | 515 | 100% |
| Occupation of participant’s parents/guardiansCivil servantsArtisanFarmersBusiness activities | 1736351111 | 3.37.068.121.6 |
| TOTAL | 515 | 100% |
Table 3.3 showed that majority of participants’ parents and guardians completed primary education (62.1%) and chose farming as their main occupation (68.1%). The result could influence participants overweight and obesity prevalence.
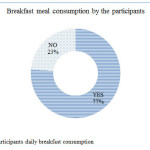 |
Figure 3.1: Participants daily breakfast consumption Click here to View figure |
Breakfast consumption of participants showed that majority of them consumed breakfast (77%) daily (Fig. 3.1). Irregular or skipping breakfast may influence the amount and frequency of food consumption. This result may contribute to the participants overweight and obesity prevalence.
Table 3.4: Mean frequency of consumption of foods by participants in a week (n=515)
| Selected food items | Mean frequency of consumption per week |
| Boiled yam/Cassava | 2.15±0.89 |
| Boiled potatoes | 1.78±0.81 |
| Potatoes chips | 2.14±0.84 |
| Doughnut & Biscuits | 2.36±0.99 |
| Spaghetti & Noodles | 2.14±0.85 |
| Peanut butter | 2.34±1.15 |
| Roasted peanut | 2.04±1.06 |
| Snacks | 2.71±0.87 |
| Whole milk | 2.08±0.71 |
| Ice-cream & yogurt | 2.10±0.72 |
| Fried eggs/boiled eggs | 2.15±0.69 |
| Soda drink | 2.14±1.05 |
| Fruits | 2.37±0.07 |
Table 3.4 showed participants’ mean frequency of consumption of some selected foods which may influence their overweight and obesity status. Snacks (2.71±0.87) had highest mean frequency of consumption, while boiled potatoes (1.78±0.81) had the lowest mean frequency of consumption per week. Certain food items were known to have high calories and the calories could also increase further with the number of times such food items may be consumed per week.
Table 3.5: Metabolic equivalent scores (METS) per week of the participants
| N=515 | |||
| IPAQ METs Categories per week | Number of participants | % of participants | Physical activities intensity |
| <600 | 61 | 11.8 | low |
| 600-3000 | 251 | 48.7 | medium |
| >3000 | 203 | 39.4 | high |
Table 3.5 showed the metabolic equivalent scores (METS) of participants per week, the result indicated that majority (48.7%) of the participants’ physical activity intensity per week were categorized as medium while a lower proportion (11.8%) of participants physical activity intensity was categorized as being low according to World Health Organization classification. METs estimation gave an indication of the energy expenditure in various physical activity engaged-in by participants and this may influence their overall weight status.
Table 3.6: Summary of participants’ body mass index for age (BMI for age) as classified by (WHO, 2007) 41
| BMI for age | Categories of weight status | Male participantsn=172 | Female participantsn=343 | Total participantsn=515 | Mean (BMI) for age of all the participants (kg/m2) | |||
| <15th percentile | Underweight | 82 | 47.7% | 68 | 19.8% | 150 | 29.1% | 19.76±2.62 |
| 15th-84.5th percentile | Normal weight | 89 | 51.7% | 251 | 73.2% | 340 | 66.0% | |
| 85th -97th percentile | Overweight | 1 | 0.6% | 23 | 6.7% | 24 | 4.7% | |
| >97th percentile | Obese | 0 | 0% | 1 | 0.3% | 1 | 0.2% | |
| Total | 172 | 100% | 343 | 100% | 515 | 100% | ||
Footnote.- * BMI for age in (kg/m2) was calculated to give the mean BMI for age of all the participants
Table 3.6 showed the participants weight status by gender. This result indicated that prevalence of overweight and obesity among male (0.6%, 0.0%) participants was lower compared to female (0.0%, 0.3%). The sample size may cause the disparities between prevalence of the participants, however girls are usually tend to be overweight than obese because they are always cognizant of their appearance as compared to boys and also girls tend to eat more frequently than boys.
Table 3.7: Relationships between BMI for age, food consumption pattern (FCP) and physical activity level (PAL) for the participants
| Variables | P value | Coefficient of correlation(r) | |
| BMI and food consumption pattern(FCP) | P=0.785 | 0.012 | |
| BMI and physical activity level(PAL) | P=0.017 | -0.105 | |
Table 3.7 showed the relationships between food consumption pattern and the body mass index for age of participants. This result indicated that a weak but positive relationship existed between participants’ food consumption and their body mass index, although the relationship was not significant. However, the relationship between physical activity level and body mass index for age of participants was negative and weak but significant. The low food consumption pattern of participants could contribute to the weak and significance of the relationship. In addition, negative relationship that existed between physical activity level and body mass index indicated that as the physical activity increases the weight reduces or vice versa
Table 3.8: ANOVA test of food consumption pattern (FCP) and physical activity (METs) based on BMI for age categories of the participants
| Body mass index (BMI)For age categories | Number of participants n=515 | Mean composite scores for (FCP) | Physical activity(METs) |
| Underweight | 150 | 61.36±11.44a | 2235.72±1670.86a |
| Normal weight | 340 | 65.84±11.64b | 2263.81±1534.69a |
| Overweight | 25 | 70.24±9.58c | 2506.56±1376.69a |
| P-value (ANOVA) | 515 | p=0.001 | p=0.725 |
Foot note- scores with different letters varied significantly with BMI for age categories while scores with same letters did not vary significantly with the BMI for age categories
Table 3.8 showed the analysis of variance between body mass index for age categories of participants and mean composite scores for food consumption and physical activity (METs). This result indicated that mean composite scores for each weight status varies, the overweight participants had higher mean composite score than the normal weight participants and so on. The mean composite scores of participant showed level of acceptable significance, this indicates that overweight participants ate more than normal weight participants as so on. Similarly METs score also varies with weight status, however, the METs scores did not show level of acceptable significance. This indicates that participants METs scores did not vary much to the participants’ weight status. The physical activity of those who were overweight did not vary much from those participants who are of normal weight and so on.
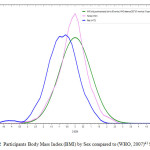 |
Figure 3.2: Participants Body Mass Index (BMI) by Sex compared to (WHO, 2007)41 Standard Click here to View figure |
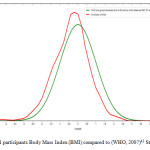 |
Figure 3.3: All participants Body Mass Index (BMI) compared to (WHO, 2007)41 Standard Click here to View figure |
Discussion
Finding of this study indicated that 54% of participants were between 15 years and 6 months to 18 years and 5 months, this finding is similar to finding reported by.40,43 among public and private school participants in which about 60.8% of them were between (15-19) years. This clearly illustrates that participants in this study might have established certain food habits in their food consumption and physical activity practice that may influence their weight status. Furthermore, about 61.7% of participants walked to school, this is in line with findings of.43 where majority of participants walked to school. Walking to school may influence physical activity level of participants and since this study was conducted in rural and semi-urban areas. It indicates that the environment encouraged free movement of participants unlike in many urban cities where neighborhood environment does not encourage human movement. Socially disadvantage environments like rural areas reduce the prevalence of overweight and obesity.44 The findings showed that 50.3% of participants lived with parent, this is similar to finding of.43 Majority of participants’ parents/guardians occupation was farming, this means that many of them were likely to be unskilled workers and may likely have low income, and this condition places them at the bottom of socioeconomics strata. Participants’ parents/guardians’ socioeconomic status may influence their children food consumption and physical activity practices because many of the participants are still dependants, as it was observed by.27 in which lower socioeconomic status determined food consumptions of adolescents.
Breakfast consumption pattern indicated that 77% of participants do eat breakfast at home before leaving for school, this finding agrees with similar study conducted by.4 among government and private students in secondary schools, his finding showed that 73.8% of students in governments’ school ate breakfast as compared to 66.3% students from private schools. Breakfast consumption by participants may influence their weight status and prevalence of overweight and obesity among them.4 reported that daily breakfast consumption was associated with less overweight and obesity, healthier dietary practice and physical activity related behaviors. Furthermore,4,5 reported that in a similar study that 84% of children who eat breakfast with family ate fruits and vegetables 5 or more times per week, but this is contrary to findings of this study where the mean times of fruits consumption of participants was (2.37±0.07) indicating that the participants fruits consumption was less than 3 times per week. Low fruits consumption may lead to deficiency of water soluble vitamin particularly Vitamin C and other micronutrients.
Finding on food consumption of participants indicated that all the selected food items in this study were consumed in less than 3 times per week. Mean consumption of snacks was higher than the other foods, this finding agrees with finding of similar study conducted by.46 in which higher proportion of participants in his study consumed fast foods with soft drinks. This clearly illustrates that participants snacks and soda consumption may influence overweight and obesity among participants. Several studies associated higher prevalence of overweight and obesity to snacking among other obesity risk factors.42,43,47,48 The finding on physical activity level (PAL) of participants in this study indicated that only 11.8% had low physical activity intensity, while majority of participants had between moderate and high intensities. The finding further showed that weak but negative relationship existed between body mass index (BMI) and physical activity of participants (r=-0.105; p=0.01), meaning that as physical activity level decreases, participants BMI increases, invariably overweight and obesity will increase. However, this finding is in contrast with a similar study conducted by.5 in which no significant relationship existed between overweight and obesity and physical inactivity of participants. Furthermore, finding in this study revealed that physical activity level failed to determine overweight and obesity of participants because no significant difference between the physical activities in different categories. This finding agrees with,49 in which there was no significant association between risk factors i.e. physical activity and weight status of participants. This clearly illustrates that physical activity level of participants were not different among different weight categories.
The finding of this study clearly shows that food consumption of participants determined overweight and obesity because significant association exits between the overweight and obese participants (p< 0.01) and those participants who were not. This showed that the participants who were overweight and obese ate more food than those who were not, therefore in order to reduce the prevalence of overweight and obesity among adolescents students in public secondary schools in Kwara state, the students food consumption need some modifications.
Conclusion
Determinants of overweight and obesity among participants indicated that only food consumption positively determines participants’ weight status, although frequency of food consumption was low as compared to other research studies. In addition to that, physical activity of participants do not determine overweight and obesity among participants, but it shows that physical activity level negatively influenced weight status of participants thereby reducing prevalence of overweight and obesity among them. Therefore, participants need to improve on consumption of fruits and vegetables as well as reduce consumption of soda and other sweet sugary beverages (SSBs) in order to maintain desirable weight. Participants also need to improve on their physical activity practices as this will in long term control their weight.
Acknowledgements
Special thanks go to the under-mentioned institutions and organizations for their contributions to the success of this research work:
- Department of Food, Nutrition and Dietetics, Kenyatta University (KU).
- Graduate School Kenyatta University.
- Federal Polytechnic Bauchi, Nigeria.
- Tertiary Education Trust Fund (TET-Fund) Nigeria.
- Kwara State Teaching Service Commission (KSTSC) Nigeria
- Kwara State Universal Basic Education Board (KSUBEB), Nigeria.
I also acknowledged the support of all the participating schools in Kwara state, as well as all the participants for their patience and cooperation
References
- WHO (2015) | Childhood overweight and obesity.. Retrieved May 7, 2015, from http://www.who.int/dietphysicalactivity/childhood/en/
- Aounallah-Skhiri, H., El Ati, J., Traissac, P., Romdhane, H. B., Eymard-Duvernay, S., Delpeuch, F., Maire, B. (2012). Blood pressure and associated factors in a North African adolescent population. A national cross-sectional study in Tunisia. BMC Public Health, 12(1), 98.
CrossRef - Arora, M., Nazar, G. P., Gupta, V. K., Perry, C. L., Reddy, K. S., & Stigler, M. H. (2012). Association of breakfast intake with obesity, dietary and physical activity behavior among urban school-aged adolescents in Delhi, India: results of a cross-sectional study. BMC Public Health, 12(1), 881.
CrossRef - Coelho, L. G., Cândido, A. P. C., Machado-Coelho, G. L. L., & Freitas, S. N. de. (2012). Association between nutritional status, food habits and physical activity level in schoolchildren. Jornal De Pediatria, 88(5), 406–412. http://doi.org/doi:10.2223/JPED.2211
CrossRef - Hallström, L., Labayen, I., Ruiz, J. R., Patterson, E., Vereecken, C. A., Breidenassel, C., others. (2013). Breakfast consumption and CVD risk factors in European adolescents: the HELENA (Healthy Lifestyle in Europe by Nutrition in Adolescence) Study. Public Health Nutrition, 16(07), 1296–1305.
CrossRef - Azadbakht, L., & Esmaillzadeh, A. (2011). Dietary diversity score is related to obesity and abdominal adiposity among Iranian female youth. Public Health Nutrition, 14(01), 62–69.
CrossRef - Gewa, C. A. (2010). Childhood overweight and obesity among Kenyan pre-school children: association with maternal and early child nutritional factors. Public Health Nutrition, 13(04), 496–503.
CrossRef - Gupta, N., Goel, K., Shah, P., & Misra, A. (2012). Childhood obesity in developing countries: epidemiology, determinants, and prevention. Endocrine Reviews, 33(1), 48–70.
CrossRef - Mozaffarian, D., Hao, T., Rimm, E. B., Willett, W. C., & Hu, F. B. (2011). Changes in diet and lifestyle and long-term weight gain in women and men. New England Journal of Medicine, 364(25), 2392–2404.
CrossRef - Schmidt, M. I., Duncan, B. B., e Silva, G. A., Menezes, A. M., Monteiro, C. A., Barreto, S. M.,Menezes, P. R. (2011). Chronic non-communicable diseases in Brazil: burden and current challenges. The Lancet, 377(9781), 1949–1961.
CrossRef - Vernarelli, J. A., Mitchell, D. C., Hartman, T. J., & Rolls, B. J. (2011). Dietary energy density is associated with body weight status and vegetable intake in US children. The Journal of Nutrition, 141(12), 2204–2210.
CrossRef - Sawyer SM. Afifi RA. Bearinger LH. Blackmore SJ. Dick B. Ezeh AC. Patton GC. (2012). Adolescence: A foundation for future health. Lancet (2012): 1630-40. Doi:10.1016/S0140-6736(12) 60072-5
- Wang, Y., Jahns, L., Tussing-Humphreys, L., Xie, B., Rockett, H., Liang, H., & Johnson, L. (2010). Dietary intake patterns of low-income urban african-american adolescents. Journal of the American Dietetic Association, 110(9), 1340–1345.
CrossRef - Cutler, G. J., Flood, A., Hannan, P., & Neumark-Sztainer, D. (2011). Multiple socio demographic and socio environmental characteristics are correlated with major patterns of dietary intake in adolescents. Journal of the American Dietetic Association, 111(2), 230–240.
CrossRef - Danielzik, S., Czerwinski-Mast, M., Langnäse, K., Dilba, B., & Müller, M. J. (2004). Parental overweight, socioeconomic status and high birth weight are the major determinants of overweight and obesity in 5–7 y-old children: baseline data of the Kiel Obesity Prevention Study (KOPS). International Journal of Obesity, 28(11), 1494–1502.
CrossRef - Dinsa, G. D., Goryakin, Y., Fumagalli, E., & Suhrcke, M. (2012). Obesity and socioeconomic status in developing countries: a systematic review. Obesity Reviews, 13(11), 1067–1079.
CrossRef - Finucane, M. M., Stevens, G. A., Cowan, M. J., Danaei, G., Lin, J. K., Paciorek, C. J.,others. (2011). National, regional, and global trends in body-mass index since 1980: systematic analysis of health examination surveys and epidemiological studies with 960 country-years and 9· 1 million participants. The Lancet, 377(9765), 557–567.
CrossRef - Labree, L. J. W., Van De Mheen, H., Rutten, F. F. H., & Foets, M. (2011). Differences in overweight and obesity among children from migrant and native origin: a systematic review of the European literature. Obesity Reviews, 12(5), e535–e547.
CrossRef - Wang, Y. (2011). Disparities in pediatric obesity in the United States. Advances in Nutrition: An International Review Journal, 2(1), 23–31.
CrossRef - Wrotniak, B. H., Malete, L., Maruapula, S. D., Jackson, J., Shaibu, S., Ratcliffe, S., Compher, C.(2012). Association between socioeconomic status indicators and obesity in adolescent students in Botswana, an African country in rapid nutrition transition. Pediatric Obesity, 7(2), e9–e13.
CrossRef - Al-Hazzaa, H. M., Abahussain, N. A., Al-Sobayel, H. I., Qahwaji, D. M., & Musaiger, A. O. (2012). Lifestyle factors associated with overweight and obesity among Saudi adolescents. BMC Public Health, 12(1), 354.}
CrossRef - Manios, Y., & Costarelli, V. (2011). Childhood obesity in the WHO European Region. In Epidemiology of obesity in children and adolescents (pp. 43–68). Springer. Retrieved from http://link.springer.com/chapter/10.1007/978-1-4419-6039-9_4
CrossRef - Mushtaq, M. U., Gull, S., Mushtaq, K., Shahid, U., Shad, M. A., & Akram, J. (2011). Dietary behaviors, physical activity and sedentary lifestyle associated with overweight and obesity, and their socio-demographic correlates, among Pakistani primary school children. Int J Behav Nutr Phys Act, 8(1), 130.
CrossRef - Muthuri, S. K., Francis, C. E., Wachira, L.-J. M., LeBlanc, A. G., Sampson, M., Onywera, V. O.,& Tremblay, M. S. (2014). Evidence of an overweight/obesity transition among school-aged children and youth in Sub-Saharan Africa: a systematic review. PLoS One, 9(3), e92846.
CrossRef - Rosas, L. G., Guendelman, S., Harley, K., Fernald, L. C., Neufeld, L., Mejia, F., & Eskenazi, B.(2011). Factors associated with overweight and obesity among children of Mexican descent: results of a binational study. Journal of Immigrant and Minority Health, 13(1), 169–180.
CrossRef - Fleischhacker, S. E., Evenson, K. R., Rodriguez, D. A., & Ammerman, A. S. (2011). A systematic review of fast food access studies. Obesity Reviews, 12(5), e460–e471.
CrossRef - Grimes, C. A., Riddell, L. J., Campbell, K. J., & Nowson, C. A. (2013). Dietary salt intake, sugar-sweetened beverage consumption, and obesity risk. Pediatrics, 131(1), 14–21.
CrossRef - Popkin, B. M. (2011). Contemporary nutritional transition: determinants of diet and its impact on body composition. Proceedings of the Nutrition Society, 70(01), 82–91.
CrossRef - Smpokos, E. A., Linardakis, M., Sarri, K., Papadaki, A., Theodorou, A. S., & Kafatos, A. (2013).Differences in food consumption according to weight status and physical activity levels among Greek children between 1992/93 and 2006/07. Journal of Human Nutrition and Dietetics, 26(3), 259–267. p://doi.org/10.1111/jhn.12004
CrossRef - Lipsky, L. M., & Iannotti, R. J. (2012). Associations of television viewing with eating behaviors in the 2009 Health Behaviour in School-aged Children Study. Archives of Pediatrics & Adolescent Medicine, 166(5), 465–472.
CrossRef - Nguyen, B., Kornman, K. P., & Baur, L. A. (2011). A review of electronic interventions for prevention and treatment of overweight and obesity in young people. Obesity Reviews, 12(5), e298–e314.
CrossRef - Adamo, K. B., Sheel, A. W., Onywera, V., Waudo, J., Boit, M., & Tremblay, M. S. (2011). Child obesity and fitness levels among Kenyan and Canadian children from urban and rural environments: A KIDS-CAN Research Alliance Study. International Journal of Pediatric Obesity, 6(2Part2), e225–e232.
CrossRef - del Mar Bibiloni, M., Pich, J., Córdova, A., Pons, A., & Tur, J. A. (2012). Association between sedentary behaviour and socioeconomic factors, diet and lifestyle among the Balearic Islands adolescents. BMC Public Health, 12(1), 718.
CrossRef - Tudor-Locke, C., Craig, C. L., Thyfault, J. P., & Spence, J. C. (2012). A step-defined sedentary lifestyle index:< 5000 steps/day. Applied Physiology, Nutrition, and Metabolism, 38(2), 100–114.
CrossRef - Adesina, A. F., Peterside, O., Anochie, I., Akani, N. A., & others. (2012). Weight status of adolescents in secondary schools in port Harcourt using Body Mass Index (BMI). Ital J Pediatr, 38, 31.
CrossRef - Doku, D., Koivusilta, L., Raisamo, S., & Rimpelä, A. (2013). Socio-economic differences in adolescents’ breakfast eating, fruit and vegetable consumption and physical activity in Ghana. Public Health Nutrition, 16(05), 864–872.
CrossRef - Ejike, C. E., & Ijeh, I. I. (2012). Obesity in young-adult Nigerians: variations in prevalence determined by anthropometry and bioelectrical impedance analysis, and the development of % body fat prediction equations. International Archives of Medicine, 5(1), 22.
CrossRef - Ene-Obong, H., Ibeanu, V., Onuoha, N., & Ejekwu, A. (2012). Prevalence of overweight, obesity, and thinness among urban school-aged children and adolescents in southern Nigeria. Food & Nutrition Bulletin, 33(4), 242–250.
CrossRef - Nwizu, S. E., Njokanma, O. F., Okoromah, C. A. N., & David, N. A. (2011). Relationship between bioelectrical impedance analysis and body mass index in adolescent urban Nigerians. West African Journal of Medicine, 30(2), 99– 103.
- Ojofeitimi, E. O., Olugbenga-Bello, A. I., Adekanle, D. A., & Adeomi, A. A. (2011). Pattern and determinants of obesity among adolescent females in private and public schools in Olorunda local government area of Osun state, Nigeria: a comparative study. Journal of Public Health in Africa, 2(1), 11.
- WHO, (2007). BMI-for- age, Boys and Girls (5 to 19) years. Geneva, Switzerland. Accessed on 4th May, 2015.
- Olubanji Ojofeitimi, E., Ojofeitimi, E. O., Olugbenga-Bello, A. I., Adekanle, D. A., & Adeomi, A. A. (2011). Pattern and determinants of obesity among adolescent females in private and public schools in Olorunda local government area of Osun state, Nigeria: a comparative study. Journal of Public Health in Africa, 2(1), e11. http://doi.org/10.4081/jphia.2011.e11
CrossRef - Chiang, P.-H., Wahlqvist, M. L., Lee, M.-S., Huang, L.-Y., Chen, H.-H., & Huang, S. T.-Y. (2011). Fast-food outlets and walkability in school neighbourhoods predict fatness in boys and height in girls: a Taiwanese population study. Public Health Nutrition, 14(09), 1601–1609.
CrossRef - Andaya, A. A., Arredondo, E. M., Alcaraz, J. E., Lindsay, S. P., & Elder, J. P. (2011). The association between family meals, TV viewing during meals, and fruit,vegetables, soda, and chips intake among Latino children. Journal of Nutrition Education and Behavior, 43(5), 308–315
CrossRef - Onyiriuka, A. N., Ibeawuchi, A. N., & Onyiriuka, R. C. (2013). Assessment of eating habits among adolescent Nigerian urban secondary schoolgirls. Retrieved from http://imsear.li.mahidol.ac.th/handle/123456789/149710
CrossRef - Hafekost, K., Mitrou, F., Lawrence, D., & Zubrick, S. R. (2011). Sugar sweetened beverage consumption by Australian children: implications for public health strategy. BMC Public Health, 11(1), 950.
CrossRef - Mishra, M. B., & Mishra, S. (2011). Sugar-Sweetened Beverages: General and Oral Health Hazards in Children and Adolescents. International Journal of Clinical Pediatric Dentistry, 4(2), 119–123.
CrossRef - Rouhani, M. H., Mirseifinezhad, M., Omrani, N., Esmaillzadeh, A., & Azadbakht, L. (2012). Fast food consumption, quality of diet, and obesity among Isfahanian adolescent girls. Journal of Obesity, 2012. Retrieved fromhttp://downloads.hindawi.com/journals/jobes/2012/597924.pdf
CrossRef - Manyanga, T., El-Sayed, H., Doku, D. T., & Randall, J. R. (2014). The prevalence of underweight, overweight, obesity and associated risk factors among school-going adolescents in seven African countries. BMC Public Health, 14(1), 1–11.http://doi.org/10.1186/1471-2458-14-887
CrossRef.

This work is licensed under a Creative Commons Attribution 4.0 International License.


