High Fiber Caribbean Diets with Low-Intermediate GI Improve Glycemic Control, Cardiovascular and Inflammatory Indicators in Overweight Persons with Type 2 Diabetes: A Randomized Control Study
1Biotechnology Center
2Department of Basic Medical Sciences (Biochemistry Section)
3Tropical Metabolic Research Institute, University of the West Indies, Mona
4Scientific Research Council of Jamaica
5National Commission on Science and Technology, Jamaica.
DOI : http://dx.doi.org/10.12944/CRNFSJ.3.1.05
Download this article as:
![]()
This study focused on the effect of consumption of indigenous Caribbean foods with low and intermediate glycemic index (GI) high fiber contents on glycated haemoglobin (A1c), insulin, fasting blood glucose, homocysteine (tHCY), high sensitivity C-reactive protein (hs-CRP), HOMA-IR and lipoprotein profile levels in overweight persons with type 2 diabetes. The methodology followed a randomized controlled parallel design, which compared two dietary treatment modalities in adult Jamaicans who were overweight and diagnosed with type 2 diabetes (mean age 42.5 ± 2.0 years, 55% females, mean A1c 9.30 ± 0.56%) over six months. The intervention group (n=32) underlined the consumption of low-intermediate-GI foods, whereas the control group (n = 33) were not so advised and consumed a high-GI diet. Attempts were made to ensure that both groups were isocaloric with 45-50% of energy from carbohydrates. Consumption of low-intermediate GI foods resulted in significant reductions (p<0.005) in A1C compared to participants who consumed high GI foods (-0.84 ± 0.26 vs. -0.35 ± 0.04%), hs-CRP (-0.52 ± 0.17 vs. -0.17 ± 0.31 mg/dL) and tHCY (-1.32 ± 0.39 vs. -0.59 ± 0.38 µmol/L). Insulin sensitivity, HDL-C and triglycerides significantly improved in participants who consumed the low-intermediate-GI diet. The data strengthen the metabolic benefits of meal plans that emphasize the consumption of low and intermediate GI high fiber foods, particularly, indigenous Caribbean complex starchy foods.
KEYWORDS:High Fiber Caribbean; haemoglobin; overweight
Introduction
The traditional Caribbean diet is comprised predominantly of vast amounts of root and tuber crops (Samuda et al., 1998) and is the primary source of digestible carbohydrates (Riley, et al., 2008). Conversely, intake of some of these complex carbohydrate foods have been implicated in the increased incidence of insulin resistance, type 2 diabetes mellitus and cardiovascular diseases in the Caribbean (Ramdath et al., 2008).
These effects may be possible since carbohydrate metabolic studies have clearly proven that “equal” exchanges of carbohydrates do not necessarily elicit similar glycemic responses (Wolever et al., 2003; Brand-Miller et al., 2003). Furthermore, some complex carbohydrates have the potential to increase blood glucose levels equally and at times greater than simple sugars (Wolever et al., 1991; Foster-Powell and Holt, 2002). Studies have shown that different food processing methods of complex carbohydrates can result in variations in glycemic indices and trigger spikes in blood glucose response (Bahado-Singh et al., 2006; Chryssanthopoulos et al., 2014). Notwithstanding, dietary recommendations over the years have emphasized the quantity rather than the quality of carbohydrate, despite the fact that carbohydrate source and chemical composition profoundly influence postprandial glycemia (Chandalia et al., 2000).
Data on the comparison of glycemic indices (GI) of meals, with similar carbohydrate content, could have as much as a five-fold difference in glycemic impact (Foster-Powell and Holt, 2002). On the other hand, a positive correlation was reported in epidemiologic studies between consumption of dietary GI and increased risk of developing type 2 diabetes (Salmeron et al., 1998). Similarly, the increased consumption of whole grains (low GI food) with high levels of dietary fiber (DF) prevents the risk of cardiovascular diseases (Jenkins et al., 2005).
However, little is known about the effects of the varying GI of indigenous complex carbohydrate-rich Caribbean foods as it relates to the management of glycemia, cardiovascular and inflammation risks. The study had a special interest to evaluate the effects of traditional Caribbean foods, with pronounced differences in GI (low-intermediate and high), on metabolic parameters and the overall cardiovascular risk profile in type 2 diabetic overweight individuals.
Materials and Methods
Study Design
The study had a randomized parallel design where participants were allocated to one of the two treatment modalities, the control group (high GI diet) or the intervention group (low-intermediate-GI diet) for duration of six months. The study protocol was granted by the University Hospital of the West Indies, Ethics Committee. All participants gave written informed consent after the study protocol was verbally outlined to them. The primary outcome measure was A1C, with fasting blood glucose, high sensitivity C-reactive protein (hs-CRP), homocysteine (tHCY), homeostasis model assessment as a marker of insulin resistance (HOMA-IR) and blood pressure as secondary outcome measures.
Recruitment – Screening and Enrollment
Persons living with type 2 diabetes were recruited primarily from the University Hospital of the West Indies (Diabetic Clinic) and from the Diabetes Association of Jamaica Outreach Centers. The American Diabetes Association (American Diabetes Association, 2005) diagnostic criteria for type 2 diabetes mellitus were used.Emphasis was placed on enrollment of participants who were overweight with a sedentary lifestyle and had low physical activity related jobs. The participants were advised to continue their customary daily activities without any change in their physical activities. Anthropometric data and lifestyle factors were derived from questionnaires.
Inclusion Criteria
Individuals eligible for the study were between the ages 25-65 years, clinically diagnosed with type 2 diabetes mellitus. Individuals who were previously using oral anti-diabetic medication were included, but the type and dosage of the medication had to remain unchanged throughout the study period.
Exclusion Criteria
Individuals with chronic medical diseases other than type 2 diabetes, such as thyroid, liver disease and vascular diseases (i.e. peripheral artery disease, stroke and coronary heart disease) or participants who were treated with insulin were excluded.
Dietary Intervention
Prior to the start of the intervention there were no differences in dietary habits of the participants, this was to ensure that the outcome of the study was not influenced by a selection bias. Data for the GI of the foods used in this study was previously reported by Bahado-Singh et al., (2006). Consequently, attempts were made to ensure that both groups were isocaloric using food frequency questionnaires to avoid the confounding effect of the intervention group being relatively hypocaloric. Dietary advice was as outlined by Lindstrom et al., (2003), daily calories of 50% from carbohydrates; 25% from combined saturated, mono- and polyunsaturated; and over 1.0 g protein per body weight. Table 1 shows a typical menu for the low-intermediate diet and the high GI diet.
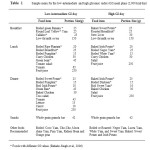 |
Table 1: Sample menu for the low-intermediate and high glycemic index (GI) meal plans (2,000 kcal/day) Click here to View table |
The participants were strictly monitored by scheduled monthly visits, as well as frequent surprise visits to their homes and place of work, during scheduled meal times. Three (3) day food records were kept throughout the study together with semi-quantitative food frequency questionnaires to assess nutrition intakes and verified by a 24 hour dietary recall on each visit. Eating-related behaviour was discussed and the nutrient intakes according to food records were compared with recommendations. Food records were analyzed using the NUTRIPUT computer program (version 2.02; University of Toronto, Toronto).
Attempts were made to maintain a constant body weight among the participants during the study. Additionally, adjustments in energy levels were done for patients who were unable to maintain their weight or experienced fluctuations in body weight during the study. Despite this however, it was not always possible to adjust the energy intake to avoid reduction in the body weight primarily due to the diversity in the patient’s diets.
Assays
Markers of glycemia (A1C and fasting blood glucose [FBG]) and inflammation (hs-CRP and tHCY) and atherogenic risk (cholesterol, triglyceride, HDL and LDL) were assessed. Blood samples were collected at week 1 (baseline), week 12 and week 24. A1C was determined by boronate affinity and high-performance liquid chromatography (HPLC) using the Primus-PDQ Plus Analyzer (Primus Plus Corporation, Kansas City, MI, USA), with a measurement resolution of 0.1% HbA1C and coefficient of variation (CV) <2%. Blood samples for tHCY measurement were collected, immediately placed on ice and centrifugated at 4°C. Plasma was separated within 30 min and stored at -70°C. Plasma tHCY concentration was measured by chemiluminescent enzyme immunoassay (Immulite 2000 Diagnostic Products, Los Angeles, CA, USA). Normal reference ranges of our laboratory were 5-12 μmol/L and inter-assay and intra-assay CV 7.4%.
EDTA-plasma specimens for hs-CRP were centrifuged at 3000 g for 10 min, immediately aliquoted and frozen at -70°C until analyzed by chemiluminescent enzyme immunoassayusing the Immulite 2000 Analyzer (Immulite 2000, Diagnostic Products Corp., Los Angeles, CA, USA). Analytical sensitivity of hs-CRP was 0.01 mg/dL, with intra-assay and inter-assay coefficient of variation not more than 7.1%, according to the manufacturer. Using the recommendations from the Centers for Disease Control and Prevention and the American Heart Association (Pearson et al., 2003). Serum hs-CRP concentration was categorized as low if the value was less than 1.0 mg/L,average if the values ranged from 1.0–3.0 mg/L, and high if the values were greater than >3.0 mg/L. Determination of serum insulin and C-peptide concentrations were measured by chemiluminescent enzyme immunoassayusing the Immulite 2000 Analyzer (Immulite 2000, Diagnostic Products Corp., Los Angeles, CA, USA). The analytical sensitivity of the insulin assay was 2 mIU/ml (i.e. 13.9 pmol/l), with inter-assay and intra-assay CV <6.4%. There was no detectable cross-reactivity with proinsulin or C-peptide. Insulin resistance was calculated using HOMA-IR (Borai et al., 2007). Serum cholesterol, HDL and triglyceride concentrations were measured by an automated enzymatic colorimetric method; using the Abbott Alcyon 300i auto analyzer (Abbott Laboratories, Abbott Park, IL, USA), using laboratory kits produced from the same supplier.
Power Calculations
It was assumed that the intervention group would see a 1% fall in A1C levels and the attrition rate would be 33%. Hence, to achieve 80% power and one-sided alpha value of 0.05, a minimum of 22 participants were required in each group.
Statistical Analysis
Intention to treat analyses was used. Comparisons and ranking of biochemical parameters was done with the Duncan’s multiple range test using a 5% level of variation as limit of acceptance/rejection at p < 0.05. A linear regression model was used to evaluate associations between the dietary intervention and A1C concentrations. Adjustments were made for age, BMI, smoking, alcohol consumption, history of hypertension, history of hypercholesterolemia and duration of diabetes. The SPSS statistical package was used for all analyses (SPSS 13 for Windows, Chicago, IL, USA).
Results
Dietary Intervention
Strict adherence to the dietary guidelines in both treatment groups was observed. There were no significant differences in the dietary composition in both treatment groups except for total DF intake (Table 2), which was significantly different in the low-intermediate GI diet than the high GI group at baseline and at the end of the study. Soluble and insoluble fiber contents were significantly higher in the low-intermediate-GI group than the high-GI group, which increased slightly from baseline to week 24 in the two treatment groups.
 |
Table 2: Dietary composition of Low-Intermediate-GI and High GI diets Click here to View table |
Clinical Parameters
Sixty five overweight participants (age and sex matched) were enrolled/ randomized in this study and 53 completed the trial giving an overall compliance rate of 82% (Figure 1). The corresponding drop out rates was 13% and 24% for the intervention and control groups respectively. The reasons for dropping out were not specific to age, sex, duration of diabetes, A1C levels or sheer stress of the study, but were mostly due to migration. At baseline, the age of participants (mean ± SD) was 42 ± 2.0 years, 55% were female, had diabetes for 5.9 ± 0.9 years, the mean BMI was 26.5 ± 0.8 kg/m2, and the entry A1C was 9.30 ± 0.56%. These variables were not statistically different between the treatment groups (Table 3).
Over the 24 weeks study period, the mean percentage systolic blood pressure decreased in the intervention group and increased in participants in the control group (-2.65% and 1.04% respectively; p < 0.05). Diastolic blood pressure decreased in both groups and after six months was 82.74 ± 1.15 mg Hg and 85.29 ± 2.33 mg Hg in the intervention and control groups respectively (p < 0.05). There was no significant change in BMI between the groups during the dietary intervention in both diets, 0.06 ± 0.01 kg/m2 on the low-intermediate-GI diet and 0.05 ± 0.01 kg/m2 on the high-GI diet; p > 0.1 (Table 3).
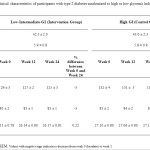 |
Table 3: Clinical characteristics of participants with type 2 diabetes randomized to high or low glycemic index (GI) foods. |
Biochemical Parameters
The results of the dietary intervention study revealed significant differences in biochemical markers between the groups at the end of the six months (Table 4). There was a greater decrease in A1C between the low-intermediate-GI group and the high-GI group (9.03% and 4.03% respectively; p < 0.05) shown in Figure 2a. This percentage decrease represents an absolute decrease in A1C units of 0.84% in the low-intermediate-GI group which was lower than that observed for the high-GI group, which had a decrease of 0.35%. The decrease in A1C correlates with fasting blood glucose levels (Table 4), which decreased by 11.4% in the low-intermediate-GI group and showed a marginally increase in the high-GI group by 2.9% (p < 0.05).
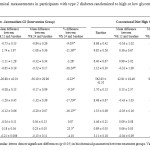 |
Table 4: Biochemical measurements in participants with type 2 diabetes randomized to high or low glycemic index diets Click here to View table |
There were significant decreases in insulin and C-peptide levels in the low-intermediate-GI group and concomitant increases in the high-GI group (Table 4). HOMA-IR was decreased in participants in the low- intermediate GI group, while it was increased in the high-GI group (Figure 2b).
Overall, the atherogenic pattern improved in the dietary intervention group. Consequently, markers of inflammation, hs-CRP and tHCY, significantly decreased in the low-intermediate-GI group. Also, plasma triglycerides decreased and HDL-C levels increased significantly in the intervention group during the period of the study. While LDL levels decreased in the intervention group more than the control group, the difference was not significant.
An exit survey revealed that 95% of the participants who completed the study and consumed the low-intermediate-GI diet qualitatively reported that they felt much better, had more energy on a daily basis and importantly, would continue to manage their diet using low and intermediate GI foods (data not shown).
Discussion
The rising diabetes epidemic in the Caribbean as well as other nutritional related diseases; especially obesity in adults and children, needs urgent attention and can be alleviated through effective dietary management utilizing the GI concept. Our findings support the hypothesis that low-intermediate-GI foods can improve the dysmetabolism (glycemia, insulin resistance and cardiovascular risk factors) of West Indian individuals with type 2 diabetes, and therefore the use of low-intermediate GI foods is a clinically useful tool. A meta-analysis by Brand-Miller et al., (2003) showed the benefits of low GI diets in 14 randomized controlled trials, but many of the studies involved a small cohort and were of short durations (i.e. less than 3 months). Our study is among the few long-term reports and the exit survey suggested that longer term use of the meal plan would be possible. Of note, none of the studies in the meta-analysis investigated the combined effect of low and intermediate GI foods.
The improvement in glycemia from the consumption of the low-intermediate GI diet in our study is inline with results reported in a recent study by Jenkins et al., (2008), which showed a decrease in A1C units of 0.5% over a six months period in Canadians with type 2 diabetes. In Brand-Miller’s meta-analysis, participants with type 1 diabetes and type 2 diabetes who were on low GI diets had a decrease in A1C units of approximately 0.4 % (95% CI: 0.1-0.7) lower than those ingesting a high GI diet over an average of 10 weeks. If the reduction in A1C in this study can be maintained in the long term, one could expect clinical benefits. The United Kingdom Prospective Diabetes Study found that in patients with type 2 diabetes, a reduction in mean A1C units by 1% resulted in a reduction of 21% in the number of diabetes-related end points (nephropathy, neuropathy and retinopathy), 14% for myocardial infarction and 37% for mircovascular complications (UK Prospective Diabetes Study Group, 1998). The A1C reduction observed in this study would suggest an improvement in myocardial infarction and mircovascular complications by approximately 12% and 31%, respectively. This is greater than the observed decrease of 10-12% in mircovascular complications reported by Jenkins et al., (2008).
There is little data available on the effects of low-intermediate-GI foods on systemic inflammation and the pathogenesis of atherosclerosis in persons with diabetes. However, our study shows a reduction in hs-CRP and tHCY levels with a diet of low and intermediate GI foods and this may translate into reduced risk of developing cardiovascular diseases. This correlates with the findings of Qi et al., (2006) where the intake of whole grains, bran and cereal fiber was associated with significant reductions in hs-CRP and tumor necrosis factor-α receptor 2 (TNF-R2) levels among women with type 2 diabetes.
Perna et al. (2006) reported that “hyperhomocysteinemia is a confirmed independent risk factor for cardiovascular disease and has been epidemiologically and clinically implicated in a variety of other conditions. Hyperhomocysteinemia decreases the expression of the antioxidant enzyme glutathione peroxidase which suggests that tHCY could potentially enhance the cytotoxic effect of agents or conditions known to cause oxidative stress (Outinen et al., 1980). It is also known that oxidative stress may impair insulin action, leading to insulin resistance (Najib and Snachez-Margalet, 2001). The significant reduction in tHCY levels (-17.5%) in our study arising from the consumption of low-intermediate-GI foods could be important in reducing inflammation and cardiovascular diseases associated with diabetes.
The increased CHD risk observed in type 2 diabetes may be partially attributable to low HDL-C (Basa and Garber, 2001). High triglyceride levels have been associated with increased small dense and formation of greater atherogenic LDL particles, this may lead to increased incidence of carotid artery intima-media thickness (Aoki et al., 2015). However, we found a significant 26% increase in HDL-C levels and a 16% decrease of triglycerides, suggesting that low-intermediate GI foods could potentially lower the risk of atherosclerosis-related diseases by non-glycemic mechanisms. Our findings correlate with recent studies by Jenkins et al., (2008) which indicated similar improvements in CHD risk.
Recent research indicates that consumption of foods with high fiber contributes to a number of unexpected metabolic effects independent from changes in BMI, which include improvement of insulin sensitivity and effects on various metabolic and inflammatory markers that are associated with the type 2 diabetes (Pi-Sunyer, 2005; Weickert and Pfeiffer, 2008). Similarly, the beneficial effects and improvement in glycemia and other metabolic markers in our study could have been influenced by the high fiber “healthy” diet of the low-intermediate GI group vs. a potentially “unhealthy” diet rich in starchy foods with low fiber content, such as baked potatoes and roasted sweet potato consumed in the high-GI group. This is attributed to the combined effects of the soluble and insoluble fiber components of the respective diets. Soluble fibers have been shown to delay macro nutrient absorption, reduce GI and beneficially influence blood lipids much better than insoluble fiber (Weickert and Pfeiffer, 2008). However, the observed improvement in HOMA-IR is linked to the high insoluble fiber content of the low-intermediate GI diet. This correlates with data from large prospective cohort studies, which reveals that it is primarily insoluble DF and whole grains, and not soluble DF, which is consistently associated with improved insulin sensitivity and reduced diabetes risk (Schulze et al., 2007; de Munter et al., 2007). Also, recent studies show reductions of inflammatory markers in participantsconsuming high DF diets (Galisteo et al., 2008). King et al., (2007) reported that “Diets high in total DF and consumption of a soluble DF supplement significantly decreased levels of the inflammatory marker C-reactive protein”. Additionally, the group believes that “fermentation of soluble DF may also play a role due to potential anti-inflammatory properties of butyrate” (King et al., 2008). Despite this however, Ma et al., (2000) reported that “reductions in inflammatory markers are comparable with both insoluble DF and more readily fermentable soluble DF”.
A potential limitation of the present study is the high dropout rate during the treatment periods at 18% (12 out of 65 participants). However, these numbers are in keeping with previous nutritional studies (Brand-Miller et al., 2003; Jenkins eta l., 2008). Another limitation is the fact that we did not have a better measure of physical activity which was done through the use of questionnaires. Dietary assessment by questionnaire is unreliable but that effect should have been minimized by our intention to treat analysis. Also, the lack of a more neutral dietary control group is a potential limitation to the study. Furthermore, the study population has very high values of glycated haemoglobin which indicated that the pharmacological treatment in this population is less than adequate.
Many previous studies have already shown clear benefits of low GI-high fiber diets on metabolic parameters and improved cardiovascular risk factor profile. However, there are very limited studies that investigated the benefits of Caribbean foods. Therefore, this study will have significance to the West Indian population, wherein, the results suggest that a low-intermediate-GI meal plan of indigenous Caribbean starchy foods could considerably improve metabolic and atherogenic profile in persons with type 2 diabetes. As such, these Caribbean foods may prove to be more efficacious in the management of type 2 diabetes mellitus, inflammation and cardiovascular diseases.
Acknowledgements
The authors would like to express sincere gratitude and thanks to the volunteers for contributing their time and dedication to this study. Many thanks to Dr. Shereen Ramcharan, MBBS and Dr. Latanya Fisher, Ph.D. for technical assistance. Special thanks to Dr. Novie Younger at the Tropical Medicine Research Institute, University of the West Indies, Mona Campus. We are grateful to Mr. Pershard Williams for part funding. The project was funded in part by research grants from the School of Graduate Studies and the Biotechnology Center, University of the West Indies, Mona Campus.
Conflict of Interest Statement
The authors declare that they have no competing financial or non-financial interests. There are absolutely no conflicts of interest among the authors or any potential conflicts.
References
- American Diabetes Association. (2005). Position Statement: Diagnosis and Classification of Diabetes Mellitus. Diabetes Care 28:S37-S42.
CrossRef - Aoki T, Yagi H, Sumino H, Tsunekawa K, Araki O, Kimura T, Nara M, Ogiwara T, Nakajima K, Murakami M. (2015) Relationship between carotid artery intima-media thickness and small dense low-density lipoprotein cholesterol concentrations measured by homogenous assay in Japanese subjects. Clin Chim Acta. 442:110-114.
CrossRef - Bahado-Singh PS, Wheatley AO, Ahmad MH, Morrison EY St.A, Asemota HN. (2006). Food processing methods influence the glycemic indices of some commonly eaten West Indies carbohydrate-rich foods. Br J Nutr 96: 476-448.
- Borai A, Livingstone C., Ferns G. (2007). The biochemical assessment of insulin resistance. Annals of Clinical Biochemistry 44: 324-342.
CrossRef - Brand-Miller J, Hayne S, Petocz P, Colagiuri S. (2003). Low-glycemic index diets in the management of diabetes: A meta-analysis of randomized controlled trials. Diabetes Care 26: 2261-2267.
CrossRef - Chandalia M, Garg A, Lutjohann D, von Bergmann K, Grundy S, Brinkley L. (2000). Beneficial effects of high dietary fiber intake in patients with type 2 diabetes mellitus. N Eng J Med 342: 1292-1298.
CrossRef - Chryssanthopoulos, C., Varzakas, T., Tampaki, M., Maridaki, M. (2014). Glycemic index of two different fried potato varieties cultivated under organic fertilization conditions. 3rd International ISEKI Food Conference proceedings 150.
- de Munter JS, Hu FB, Spiegelman D, Franz M. (2007). Whole grain, bran, and germ intake and risk of type 2 diabetes: a prospective cohort study and systematic review. PLoS Med 4: e261.
CrossRef - Foster-Powell K, Holt SHA, Brand-Miller JC. International table of glycemic index and glycemic load values. (2002). Am. J Clin Nutr 76: 55-56.
- Galisteo M, Duarte J, Zarzuelo A. (2008). Effects of dietary fibers on disturbances clustered in the metabolic syndrome. J Nutr Biochem 19: 71-84.
CrossRef - Basa A., Garber A. (2001). Cardiovascular Disease and Diabetes: Modifying Risk Factors Other Than Glucose Control. Ochsner J. 3(3): 132–137.
- Jenkins DJ, Kendall CW, McKeown-Eyssen G, Josse RG. (2008). Effect of a low-glycemic index or a high-cereal fiber diet on type 2 diabetes: a randomized trial. JAMA 23: 2742-2753.
CrossRef - Jenkins DJA, Kendall CWC, Augustin LSA (2002). Glycemic index: Overview of implications in health and disease. Am J Clin Nutr. 76: 237-266.
- King DE, Egan BM, Woolson RF, Mainous AG. (2007). Effect of a high-fiber diet vs a fiber-supplemented diet on C-reactive protein level. Arch Intern Med. 167: 502-506.
CrossRef - Lindstrom J, Louheranta A, Mannelin M, Rastas M, Salminen V, Eriksson J, Uusitupa M, Tuomilehto J. (2003). The Finnish Diabetes Prevention Study (DPS): Lifestyle intervention and 3-year results on diet and physical activity. Diabetes Care 26: 3230–3236.
CrossRef - Ma Y, Griffith, JA, Chasan-Taber L, Olendzki BC. (2000). Association between dietary fiber and serum C-reactive protein. Am J Clin Nutr 83:760-776.
- Najib S, Sánchez-Margalet V. (2001). Homocysteine thiolactone inhibits insulin signaling, and glutathione has a protective effect. J Mol Endocrinol. 27: 85-91.
CrossRef - Outinen PA, Sood SK, Liaw PC, Sarge KD. (1980). Characterization of the stress-inducing effects of homocysteine. Biochem J. 332: 213-221.
CrossRef - Pearson TA, Mensah GA. Alexander RW, Anderson JL. (2003). Centers for Disease Control and Prevention; American Heart Association: Markers of inflammation and cardiovascular disease: application to clinical and public health practice: A statement for healthcare professionals from the Centers for Disease Control and Prevention and the American Heart Association. Circulation 107: 499-511.
CrossRef - Perna AF, Capasso R, Acanfora F, Satta E. (2006). Toxic effects of hyperhomocysteinemia in chronic renal failure and in uremia: cardiovascular and metabolic consequences. Semin Nephrol 26: 20-23.
CrossRef - Pi-Sunyer X. (2005). Do Glycemic Index, Glycemic Load, and Fiber play a role in Insulin Sensitivity, Disposition Index, and Type 2 Diabetes? Diabetes Care 28: 2978-2979.
CrossRef - Qi L, Van-Dam R, Liu S, Franz M, Mantzoros C. (2006). Whole-grain, bran, and cereal fiber intakes and markers of systemic inflammation in diabetic women. Diabetes Care 29: 207-211.
CrossRef - Ramdath DD, Isaacs RLC, Teelucksingh S, Wolever TMS. (2004). Glycemic index of selected staples commonly eaten in the Caribbean and the effects of boiling v. crushing. Br J Nutr. 91: 971-977.
CrossRef - Riley CK, Bahado-Singh PS, Wheatley AO, Ahmad MH, Asemota HN. (2008). Relationship between the physicochemical properties of starches and the glycemic index of some Jamaican yams (Dioscorea spp.). J Molecular Nutri and Food Sci. 52: 1372-1376.
- Salmeron J, Ascherio A, Rimm EB, Colditz GA. (1998). Dietary fiber, glycemic load and risk of NIDDM in men. Diabetes Care. 20: 545-550.
CrossRef - Samuda P, Cook RA, Cook CM, Henry F. (1998). Identifying foods commonly eaten by the Jamaican population: the focus group approach. Int. J Food Sci Nutr 49: 79-86.
CrossRef - Schulze MB, Schulz M, Heidemann C, Schienkiewitz A. (2007). Fiber and Magnesium Intake and Incidence of Type 2 Diabetes: A Prospective Study and Meta-analysis. Arch Intern Med. 167: 956-965.
CrossRef - UK Prospective Diabetes Study Group. (1998). Tight blood pressure control and risk of macrovascular and mircovascular complications in type 2 diabetes. (UKPDS 38). Bri Med J. 31: 705-713.
- Weickert MO, Pfeiffer AFH. (2008). Metabolic Effects of Dietary Fiber Consumption and Prevention of Diabetes. J. Nutr. 138: 439-442.
- Wolever TM, Vorster HH, Bjorck I, Brand-Miller J. (2003). Determination of the glycemic index of foods: inter-laboratory study. Eur J Clin Nutr. 57: 475-482.
CrossRef - Wolever TMS, Jenkins DJA, Jenkins AL, Josse RG. (1991). The glycemic index: methodology and clinical implications. Am J Clin Nutr. 54: 846-854.


Web of Science Coverage
Emerging Sources Citation Index (ESCI)
2024 Journal Impact Factor: 1.1
Scopus Journal Metrics
CiteScore 2025: 2.6
CiteScore Details
Sustainable Nutrition: Food Systems, Nutrient Retention, and Public Health Impact
![]()
This journal is a member of, and subscribes to the principles of, the Committee on Publication Ethics (COPE)


