Association of Parental Education and Illness with Obesity and Blood Pressure in 13-16 Year Old Girls
1Department of Food Science and Nutrition, Sir Vithaldas Thackersey College of Home Science (Autonomous), Mumbai, SNDT Women’s University, Juhu Tara Road, Juhu, Mumbai – 400049, India
2NutriCanvas, B101-102 Velentine Apartment B3, Off Film City Road, Gen. A. K. Vaidya Marg, Malad (East), Mumbai 400097, India.
DOI : http://dx.doi.org/10.12944/CRNFSJ.2.3.02
Download this article as:
![]()
The aim of the current study was to estimate the prevalence of hypertension and obesity and its associations with parental (or grandparental)history of illness and parental education.
A cross-sectional study was conducted among 299 girls aged 13-16 years from Mumbai city, India. Anthropometry (weight, height, waist (WC) and hip circumference, mid-upper arm circumference) and blood pressure (BP) was measured. History of chronic illness in parents and grandparents was recorded. Parental education was also recorded.
The mean WC of the girls was 68±10 cm. WC was between 85th and 95th percentile in 14 (4.7%) girls and more than 95th percentile in 22 (7.4%) girls. The mean systolic BP of the girls was 110±11 mmHg and mean diastolic BP was 69±8 mmHg. Twelve (4%) girls had systolic BP and 48 (16.1%) girls had diastolic BP between 90th and 95th percentile whereas 38 (12.7%) girls had systolic BP and 23 girls (7.7%) had diastolic BP more than 95th percentile. There was a significant association between systolic BP and obesity (χ2 = 5.79, df = 2) and diabetes (χ2 =9.76, df=2) in grandmother (p<0.05). There was also a significant association of diastolic BP with prevalence of cardio-vascular disease in both parents (χ2 = 11.26, df =2) especially with that in mothers (χ2 =11.27, df = 2) (p<0.05). Systolic BP showed an association with mother education (χ2 = 18.81, df = 8) (p<0.05
Central obesity and hypertension is prevalent in school going girls in Mumbai city and show a significant association with prevalence of diseases in parents and grandparents.
KEYWORDS:Blood pressure; Central Obesity; Parental association; Girls; India
Introduction
Childhood overweight and obesity has been linked with development of metabolic diseases such as diabetes and cardio-vascular diseases in early adult life. Childhood obesity is a pandemic affecting children in both the developed and developing nations. In India, the prevalence of childhood overweight has been reported to range from 6.57 to 27.5% and that of obesity from 1 – 14.6% (1-4).
Grandparental and parental weight and metabolic status has been associated with childhood obesity (5-6). Children having overweight or obese grandparents or parents are shown to be positively correlated with the risk of overweight and obesity in Korea,7 Greece5 and America.8 A study conducted in Pune, India demonstrated that the prevalence of obesity and metabolic syndrome increased in children with an increase in metabolic syndrome components in parents.6 Studies to evaluate the effect of grandparental and parental weight status on childhood obesity in India are scarce. Thus, a study to evaluate the effect of grandparental and parental weight and health status on childhood obesity is essential.
Monitoring of blood pressure (BP) for the early diagnosis of pre-hypertension and hypertension is gaining importance due to its increasing prevalence and long term effects on health.9 In children, systolic and/or B{ greater than or equal to the 90th percentile for sex, age and height is defined as pre-hypertension and that greater than or equal to the 95th percentile is defined as hypertension.10 There is evidence suggesting increasing prevalence of high BP in children. Studies in India have reported the prevalence ranging from 0.46% to 6.5%.11–13
The pathogenesis of hypertension during childhood seems to be multifactorial. Obesity, insulin resistance, activation of sympathetic nervous system, alterations in sodium homeostasis, rennin- angiotensin system changes, high serum uric acid levels, genetic factors and foetal programming have been reported to contribute to this disorder.9,14 Screening of school children for BP has identified obesity and family history of diabetes mellitus, ischemic heart disease and hypertension as significant risk factors.11,13,15 Amongst the adiposity indicators body mass index (BMI) and waist circumference seems (WC) to be positively associated with increasing BP.16-18 The risk for elevated BP in children is three times greater in obese children compared to non-obese children.19
Thus, the objective of the current study was i) to evaluate the prevalence of childhood obesity and hypertension in 13-16 year old girls from Mumbai city ii) to study the effect of grandparental and parental health and education on childhood obesity and hypertension.
Methods
A cross sectional study was conducted in 299 girls aged 13 to 16 years school going girls in Mumbai city, Western Maharashtra, India. Six schools were approached for collection of data of which 4 schools gave consent. Girls were selected randomly from these 4 schools to participate in the current study and an oral ascent was obtained from them to ascertain their willingness to participate in the study.
Exclusion Criteria
Girls known to have kidney disease, cardio-vascular disease, or any other major illness were excluded from the study. Girls on anti-hypertension drugs were also excluded from the study.
Outcome Measures
All measurements was done in the morning hours between 8 to 11 am by a trained dietician
Demographics
Using a questionnaire, data regarding age, family history of illness such as obesity, hypertension, cardio vascular disease and diabetes in parents and grandparents was collected. Information was also collected on parental education.
Anthropometry
Standing height was measured to nearest 1 mm using a using a non-elastic measuring tape. tape, fastened to a vertical wall, with the student standing on bare feet. Weight was measured on an electronic weight scale (Tanita HD 357). BMI was calculated by dividing weight in kilograms by square of height in meters.
Height, weight and BMI age for Z-scores were calculated using Indian reference data.20 Based on the height for age Z scores (HAZ), girls were classified as having normal growth (HAZ > -1), mild stunting (HAZ between -1 and -2) and stunting (HAZ > 2). Height percentiles were also calculated for girls. Based on BMI for age Z scores (BAZ), girls were classified as undernourished (BAZ <-2), normal (BAZ between -2 to +2), and overweight (BAZ >2).
Waist circumference (WC) was measured with a non-stretchable tape at the midpoint of the lowest rib cage and the iliac crest, to the nearest 0.1 cm, at the end of a gentle expiration. Hip circumference was measured with a non-stretchable tape around the widest portion of the buttocks, with the tape parallel to the floor. Mid upper arm circumference (MUAC) was measured with a non-stretchable tape on the upper left arm hallway between the acromion process and the olecranon process.
WC percentiles were calculated using Indian reference data by Kuriyan et al.,21 MUAC percentiles were also calculated.22 Based on WC and MUAC percentiles, girls were classified in 3 groups, normal nutrition (<85th percentile), mild over nutrition (between 85th – 95th percentile) and extreme over nutrition/ obesity (>95th percentile)
Waist to height ratio was calculated by dividing waist circumference in centimetres by height in centimetres. Girls having a waist to height ratio of more than 0.5 were considered to be obese.21,22
Blood Pressure
Blood pressure (BP) was measured using a mercury gravity sphygmomanometer (modelno- SM-360) by a trained nurse. Three consecutive readings were recorded and average of the 3 readings was taken. BP percentiles for both systolic and diastolic BP were calculated after classifying the children for the height percentiles according to standard Indian reference data.10,20
Statistical Analysis
Analyses were performed using SPSS software for Windows (version 16.0, 2007, SPSS Inc, Chicago, IL). Data are presented as Mean ± SD or percentage. Frequencies were used to assess the prevalence of illness in girls, parents or grandparents and level of education. One-way ANOVA with post-hoc Tukey’s test was used to test the significance of differences in anthropometric characteristics and BP according to age of girls. Correlation between anthropometric characteristics and BP was assessed using Pearson’s correlation. Association of prevalence of illness in parents or grandparents or parent’s education on BMI, MUAC, WC, systolic BP or Diastolic BP percentiles was assessed using chi-square test.
Results
Anthropometric characteristics of the study group are presented in Table 1. There was no significant increase in anthropometric characteristics with age (p>0.05) (Table 1). On comparison with Indian reference data (20), the mean height for age z-score (HAZ) was -0.11±1.03 and weight for age z-score (WAZ) was -0.54±1.04. Of the 299 girls, 242 (80.9%) girls had HAZ > -1 indicating normal growth, 46 (15.4%) girls had HAZ between -1 and -2 and 11 (3.7%) girls had HAZ < -2 indicating stunted growth. The mean BMI for age z-score (BAZ) was -0.6±1.11. BAZ was within normal range (between -2 to +2) in majority 267 (89.3%) girls, BAZ was <-2 in 26 (8.7%) girls indicating under nourishment whereas 6 (2%) girls were over nourished (BAZ >2).
Table 1: presents the anthropometric characteristics of the study group according to age group
| 13 years | 14 years | 15 years | 16 years | |
| N | 88 | 107 | 46 | 58 |
| Height (cm) | 153.9±5.8 | 154.2±7.9 | 153.4±5.4 | 154.2±5.8 |
| Height Z score | 0.28±0.86 | -0.08±1.19 | -0.47±0.83 | -0.50±0.92 |
| Weight (Kg) | 41.6±8.5 | 44±11.3 | 44±11.5 | 44.6±10.6 |
| Weight Z Score | -0.31±0.88 | -0.45±1.12 | -0.73±1.10 | -0.87±1.00 |
| Body Mass Index (kg/m2) | 17.6±3.4 | 18.5±4.3 | 18.7±4.7 | 18.8±4.2 |
| Body Mass Index Z score | -0.61±1.03 | -0.57±1.17 | -0.67±1.23 | -0.73±1.08 |
| Waist circumference (cm) | 66±9 | 69±10 | 70±11 | 69±10 |
| Hip Circumference (cm) | 82±9 | 87±12 | 83±18 | 84±13 |
| Mid Upper Arm Circumference (cm) | 22±3 | 23±3 | 23±3 | 23±3 |
| Waist to Height Ratio | 0.43±0.06 | 0.45±0.06 | 0.44±0.07 | 0.44±0.07 |
The mean waist circumference of the girls was 68±10 cm. In comparison with Indian reference data (21), WC was normal in majority 263 (88%) girls (WC <85th percentile), whereas it was between 85th and 95th percentile in 14 (4.7%) girls and more than 95th percentile in 22 (7.4%) girls indicating central obesity. The mean hip circumference was 84±13 cm, MUAC was 23±3 cm and waist to height ratio was 0.44±0.07. Majority girls [297 (99.3%] had MUAC less than 85th percentile whereas 2 (0.7%) girls had MUAC between 85th and 95th percentile.22 No girl had MUAC more than 95th percentile. Of the 299 girls, 48 girls (16.1%) had waist to height ratio > 0.5 indicating central obesity.21,22
A significant correlation of weight was seen with WC (r = 0.843), hip circumference (r = 0.736), MUAC (r = 0.877) (p<0.01). Similarly, a significant correlation of BMI was seen with WC (r = 0.805), hip circumference (r = 0.694), MUAC (r = 0.871) (p<0.01).
Blood pressure according to age is presented in Figure 1. There was no significant difference in systolic BP from 13 to 15 years of age (p>0.05) whereas systolic BP was significantly higher in 15 years girls as compared to 16 (p<0.05). There was no significant difference in diastolic BP with age groups (p>0.05). The mean systolic BP was 110±11 mm Hg and mean diastolic BP was 69±8 mm Hg. On comparison with standard reference,10 249 (83.3%) and 228 (76.2%) girls had systolic and diastolic BP < 90th percentile respectively. Twelve (4%) girls had systolic BP and 48 (16.1%) girls had diastolic BP between 90th and 95th percentile whereas 38 (12.7%) girls had systolic BP and 23 girls (7.7%) had diastolic BP more than 95th percentile indicating hypertension.
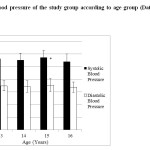 |
Figure 1: Blood pressure of the study group according to age group (Data presented at Mean±SD) Click here to View figure |
Correlation (r value) of systolic and diastolic BP with anthropometric characteristics is shown in Table 2. As seen in table 2, there was a significant correlation of both systolic and diastolic BP with all anthropometric characteristics in girls (p<0.01).
Table 2: Correlation between anthropometric measurements and blood pressure (Data presented as correlation r value)
| Systolic BP | Diastolic BP | |
| Weight | 0.506* | 0.266* |
| Body mass index | 0.535* | 0.262* |
| Waist circumference | 0.443* | 0.324* |
| Hip Circumference | 0.415* | 0.271* |
| MUAC | 0.517* | 0.297* |
*P<0.01 for all the correlations.
Figure 2.1 and 2.2 represents the prevalence of illness together for both parents and both grandparents respectively of the girls. When classified according to gender, prevalence of obesity (42.8%), hypertension (21.7%) and cardio vascular disease (4.7%) was higher in mothers than in fathers [obesity (24.7%), hypertension (16.1%) and cardio vascular disease (4.3%), whereas prevalence of diabetes was higher in fathers (11%) than in mothers (9.7%). On the other hand, prevalence of obesity (16.4%), hypertension (23.7%) and cardio vascular disease (16.1%) was higher in grandfathers than in grandmothers [obesity (13.4%), hypertension (19.4%) and cardio vascular disease (12.7%)], whereas prevalence of diabetes was higher in grandmothers (9.7%) than grandfathers (9.7%).
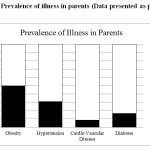 |
Figure 2.1: Prevalence of illness in parents (Data presented as percentage) Click here to View figure |
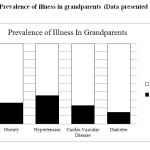 |
Figure 2.2: Prevalence of illness in grandparents (Data presented as percentage) Click here to View figure |
Effect of prevalence of illness either in both or one parent or grandparent on girl’s obesity or hypertension were assessed using chi-square test. There was a significant association between systolic BP percentile categories in girls and prevalence of obesity (χ2 = 5.79, df = 2) and diabetes (χ2 =9.76, df=2) in grandmother (p<0.05). There was also a significant association of diastolic BP percentile categories in girls with prevalence of cardio-vascular disease in both parents (χ2 = 11.26, df =2) especially with that in mothers (χ2 =11.27, df = 2) (p<0.05). No other association was seen in systolic BP, diastolic BP, WC, BMI or MUAC percentile categories with either prevalence of illness in either both or one parents or grandparents (p>0.05) (data not shown). 
Figure 3 demonstrates the level of education of parents of the girls. As seen in the figure, father of the girls were more educated than the mother with 36.1% fathers having completed graduation or higher studies in comparison to 28.8% mother. Effect of education was also assessed on anthropometric characteristics and BP. Systolic BP showed as association with mother education (χ2 = 18.81, df = 8) (p<0.05). No other association of education with either BP or anthropometric characteristics was seen (p>0.05) (data not shown).
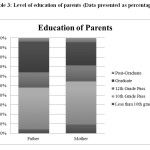 |
Table 3: Level of education of parents (Data presented as percentage) Click here to View table |
Discussion
Obesity, prehypertension and hypertension in school going 13-16 year old girls from Mumbai city was evaluated in the current study. On studying the association of grandparental and parental health with childhood obesity and hypertension, a significant association of grandmother’s obesity and diabetes was found with systolic BP in children. Parental cardio-vascular health was also associated with diastolic BP in children.
Prevalence of childhood overweight and obesity in girls varies in different cities in India. In southern city of Kochi, prevalence of overweight has been reported to be 12.1% and that of obesity to be 5.3%.23 In another survey in Bhilai Nagar in Chattisgarh, the prevalence of overweight in girls is reported to be 24.22% and that of obesity to be 8.81%.24 In the current study, even though only 2% girls had BMI for age Z score above 2, WC was between 85th and 95th percentile in 14 (4.7%) girls and WC was more than 95th percentile in 22 (7.4%) girls indicating a high prevalence of central obesity in girls in Mumbai city.
The overall prevalence of hypertension and pre-hypertension has been reported to be 19.4% and 13.9% respectively among 14-17 yrs old adolescent girls in Iran.25 In Delhi, the prevalence of hypertension has been reported to be 11.7% in 5-14 year old girls while that in Amritsar has been reported to be 6.5% in girls (26, 27). In the current study the prevalence of prehypertension was 5.3 % and that of hypertension was 10%. This wide difference may be due to different standards used for diagnosis of hypertension and also, due to regional variation. Some studies have opted fourth phase korotkoff sounds to define diastolic BP and some have not include height for grading BP.
Waist circumference is a better index for investigating metabolic abnormalities such as hypertension and impaired fasting glucose.28 Among pre-pubertal children, WC per se may be a useful parameter to predict elevated BP independently of BMI.29 In a study conducted in 10-14 year old children in Chipre, Savva et aldemonstrated that increase in WC had significantly increased chances of developing hypertension in relation to those with adequate WC.28 In Italy, obese children with WC > 90th percentile had a higher risk for metabolic syndrome (OR = 13.1).31 Similar results were seen in the current study, wherein 12.1% girls had WC above 85th percentile and were significantly correlated with weight and both systolic and diastolic BP. Thus, indicating that WC measurement may help identify children at risk for metabolic syndrome.
Parental and grandparental health has an influence on child health. Children of overweight and hypertensive parents and grandparents are not only more likely to develop hypertension, but also have their BP tracking along the upper percentiles.5,6 Other health conditions like diabetes and cardio-vascular diseases has also shown to be associated with childhood overweight and obesity. Hence, it is imperative to screen these children to identify markers to assist in prediction of development of essential hypertension in adulthood. In the current study too, a significant association of BP was found with prevalence of obesity and diabetes in grandmother and prevalence of cardio-vascular disease in parents.
BP is also influenced by various other factors such as ambience, fasting vs. non fasting state, psychological stress, which could not be controlled in present study. Data on family history of disease like hypertension, diabetes, cardio vascular disease were self-reported by students both accuracy and validity of this information are limited, and this is likely to weaken the association with high BP among their children. Thus, findings of the present study need to be further examined in larger population based study to accurately estimate the prevalence hypertension among children in our country.
In conclusion, central obesity and hypertension is prevalent in school going girls in Mumbai city and show a significant association with prevalence of diseases in parents and grandparents. Early intervention may help prevent the development of essential hypertension as they age. An initial attempt should be made to lower their BP by non-pharmacologic measures, such as weight reduction, aerobic physical exercise, and lowered sodium intake.
Acknowledgements
We would like to thank the principals and staff of the participating schools for giving us permission to conduct our study. We would also like to thank all the participating girls for helping us collect information for this study.
References
- Kajale NA, Khadilkar AV, Chiplonkar SA, Khadilkar VV. Body fat indices for identifying risk of hypertension in Indian children. Indian Pediatr. 2014 Jul;51(7):555-60.
CrossRef - Parekh A, Parekh M, Vadasmiya D. Prevalence Of Overweight And Obesity In Adolescents Of Urban & Rural Area Of Surat, Gujarat. Nat J Med Res. 2012; 2(3): 325-329
- Khadilkar AV, Sanwalka NJ, Chiplonkar SA, Khadilkar VV, Pandit D. Body fat reference percentiles on healthy affluent Indian children and adolescents to screen for adiposity. Int J Obes (Lond). 2013 Jul;37(7):947-53
CrossRef - Davis MM, McGonagle K, Schoeni RF, Stafford F. Grandparental and parental obesity influences on childhood overweight: implications for primary care practice. J Am Board Fam Med. 2008 Nov-Dec;21(6):549-54.
CrossRef - Khadilkar AV, Chiplonkar SA, Pandit DS, Kinare AS, Khadilkar VV. Metabolic risk factors and arterial stiffness in Indian children of parents with metabolic syndrome. J Am Coll Nutr. 2012 Feb;31(1):54-62.
CrossRef - Lee HS, Duffey KJ, Kim CI, Popkin BM. The relationship between family and child weight status by household structure in South Korea: 2007-2010. Nutr Diabetes. 2013 Jun 10;3:e73.
CrossRef - Manios Y, Moschonis G, Grammatikaki E, Anastasiadou A, Liarigkovinos T. Determinants of childhood obesity and association with maternal perceptions of their children’s weight status: the “GENESIS” study. J Am Diet Assoc. 2010 Oct;110(10):1527-31
CrossRef - Feber J, Ahmed M. Hypertension in children: new trends and challenges. Clin Sci (Lond). 2010 May 14;119(4):151-61.
CrossRef - National High Blood Pressure Education Program Working Group on High Blood Pressure in Children and Adolescents. The fourth report on the diagnosis, evaluation, and treatment of high blood pressure in children and adolescents. Pediatrics. 2004 Aug;114(2 Suppl 4th Report):555-76.
- Anand NK, Tandon L Prevelence of hypertension in school going children Indian Pediatrics 1996;33:377-81
- Narayanappa D1, Rajani HS, Mahendrappa KB, Ravikumar VG. Prevalence of prehypertension and hypertension among urban and rural school going children. Indian Pediatr. 2012 Sep;49(9):755-6.
CrossRef - Buch N1, Goyal JP, Kumar N, Parmar I, Shah VB, Charan J. Prevalence of hypertension in school going children of Surat city, Western India. J Cardiovasc Dis Res. 2011 Oct;2(4):228-32.
CrossRef - Raj M and Krishnakumar R. Hypertension in children and adolescents: epidemiology and pathogenesis. Indian J Pediatr. 2-13; 80 supp 1:S71-
- Basiratnia M1, Derakhshan D, Ajdari S, Saki F. Prevalence of childhood obesity and hypertension in south of Iran. Iran J Kidney Dis. 2013 Jul;7(4):282-9.
- Sreeramreddy CT,Chew WF,Poulsaeman V, Boo NY, Choo KB, Yap SF. Blood pressure and its associated factors among a school children in suburban Selangor, Malaysia : A cross sectional survey. J Family Community Med. 2013; 20(2):90-7
CrossRef - Lu X,Shi P, Luo CY, Zhou YF, Yu HT,Guo CY, Wu F. Prevalence of hypertension in overweight and obese children from a large school based population in Shanghai, China. BMC Public health. 2013; 13:24
CrossRef - Sharma A, Grover N, Kaushik S, Bhardwaj R, Saukhyan N. Prevalence of hypertension among school children in Shimla, Indian Pediatrics. 2010; 47(10):873-876
CrossRef - Samour PQ and King K(eds). Pediatric Nutrition. 4th ed. Jones & Bartlett Learning. 2012.
- hadilkar VV, Khadilkar AV, Cole TJ, Sayyad MG. Crosssectional growth curves for height, weight and body mass index for affluent Indian children, 2007. Indian Pediatr. 2009 Jun;46(6):477-89.
- Kuriyan R, Thomas T, Lokesh DP, Sheth NR, Mahendra A, Joy R, Sumithra S, Bhat S, Kurpad AV. Waist circumference and waist for height percentiles in urban South Indian children aged 3-16 years. Reference: Indian Pediatr. 2011 Oct;48(10):765-71. Epub 2011 Mar 15.
CrossRef - McDowell MA, Fryar CD, Ogden CL. Anthropometric reference data for children and adults: United States, 1988-1994. Vital Health Stat 11. 2009 Apr;(249):1-68.
- Cherian AT, Cherian SS, Subbiah S. Prevalence of obesity and overweight in urban school children in Kerala, India. Indian Pediatr. 2012 Jun;49(6):475-7.
CrossRef - Jain G, Bharadwaj SK, Joglekar AR. To study the prevalence of overweight and obesity among school children (13-17yrs) in relation to their socioeconomic status and Eating habits International Journal of Scientific and Research Publications. 2012; 2(6)
- Rafraf M, Gargari BP, Safaiyan A. Prevalence of prehypertension and hypertension among adolescent high school girls in Tabriz, Iran. Food Nutr Bull. 2010 Sep;31(3):461
CrossRef - Chadha SL, Tandon R, Shekhawat S, Gopinath N. An epidemiological study of blood pressure in school children (5-14 years) in Delhi. Indian Heart J. 1999 Mar-Apr;51(2):178-82.
- Anjana, Prabhjot, Kaur N, Kumari K and Sidhu S. Variation in blood pressure among school children of Amritsar (Punjab). Anthropologist. 2005;7(3): 201-204
CrossRef - Moreno LA, Pineda I, Rodríguez G, Fleta J, Sarría A, Bueno M. Waist circumference for the screening of the metabolic syndrome in children. Acta Paediatr. 2002;91(12):1307-12.
CrossRef - Hirschler V, Aranda C, Calcagno Mde L, Maccalini G, Jadzinsky M. Can waist circumference identify children with the metabolic syndrome? Arch Pediatr Adolesc Med. 2005 Aug;159(8):740-4.
CrossRef - Savva SC, Tornaritis M, Savva ME, Kourides Y, Panagi A, Silikiotou N, Georgiou C, Kafatos A. Waist circumference and waist-to-height ratio are better predictors of cardiovascular disease risk factors in children than body mass index. Int J Obes Relat Metab Disord. 2000 Nov;24(11):1453-8.
CrossRef - Raj M, Kumar RK. Obesity in children & adolescents. Indian J Med Res. 2010 Nov;132:598-607.
- Maffeis C, Pietrobelli A, Grezzani A, Provera S, Tatò L. Waist circumference and cardiovascular risk factors in prepubertal children. Obes Res. 2001 Mar;9(3):179-87.
CrossRef


Web of Science Coverage
Emerging Sources Citation Index (ESCI)
2024 Journal Impact Factor: 1.1
Scopus Journal Metrics
CiteScore 2025: 2.6
CiteScore Details
Sustainable Nutrition: Food Systems, Nutrient Retention, and Public Health Impact
![]()
This journal is a member of, and subscribes to the principles of, the Committee on Publication Ethics (COPE)


