
Sensory Acceptability and Microbiological Quality Improvement of Turmeric Rhizome via Pickling Using Dried Garcinia atroviridis
 , Sunisa Siripongvutikorn, Worrapanit Chansuwan* and Worapong Usawakesmanee
Department of Food Technology, Faculty of Agro-Industry, Prince of Songkla University, Hat Yai, Thailand
Corresponding Author Email: worapanit.c@psu.ac.th
Download this article as:
ABSTRACT:Direct dietary consumption of turmeric (Curcuma longa L.) remains fundamentally restricted by its pungent organoleptic profile, which creates a critical barrier to utilizing its therapeutic curcuminoids and high antioxidant capacities. This study presents a novel, clean-label mitigation strategy that enhances turmeric palatability through the engineering of a pickled functional food matrix, substituting commercial synthetic vinegar with an aqueous extract of dried Garcinia atroviridis as a biocompatible organic acidulant. Fresh turmeric rhizomes were subjected to a texturizing and stabilizing blanching pre-treatment (2% NaCl, 0.5% CaCl₂) prior to a 28-day pickling period under three distinct acidic matrices: a conventional control (1:1 v/v commercial vinegar) and two experimental G. atroviridis aqueous systems at weight-to-volume ratios of 1:4 (T1) and 1:6 (T2). Physicochemical dynamics, bioactive compound retention rates, and radical scavenging capacities (DPPH and ABTS) were systematically mapped throughout the process. Over the 28-day cycle, the T1 matrix achieved the most robust acidification kinetics, yielding a highly stable terminal pH of 2.04– 2.07 and the peak total titratable acidity (0.4855% as acetic acid). Although the pickling process induced a statistically significant down-regulation in total curcuminoids and antioxidant activity across all experimental cohorts, the T1 formulation demonstrated superior phytochemical preservation mechanics—retaining 47.45 and 22.06 mg BHT/g db for DPPH and ABTS, respectively—and significantly outperforming both T2 and the conventional vinegar control. Crucially, consumer hedonic optimization modeling indicated that T1 achieved the highest scores across all evaluated sensory dimensions, culminating in an overall acceptability score of 6.96. These outcomes collectively demonstrate that a 1:4 G. atroviridis extract ratio successfully bridges the historical gap between functional compound preservation and sensory optimization, offering a highly scalable biorefinery approach for the clean-label manufacturing of antioxidant-rich functional foods.
KEYWORDS:Antioxidant Activity; Bioactive Compounds; Curcumin; Food Preservation; Functional Food; Organic Acids.
Introduction
Accelerated food spoilage is often driven by high relative humidity and elevated temperatures, leading to a constant demand for effective preservation and shelf-life extension techniques. Among these methods, pickling stands as a long-standing tradition practiced across various global cultures. This technique is especially prevalent in regions with hot and humid climates, such as Thailand, Indonesia, and India.1,2 Beyond its popularity as a straightforward way to prevent decay, pickling is widely favored for its ability to diversify flavors and develop distinct taste profiles. Although modern food preservation technologies such as freezing, vacuum packaging, and irradiation are now widely available, pickling remains popular at household, restaurant, and industrial levels.
Based on COVID-19 pandemic, the trend toward health-conscious food consumption has significantly increased.2 Consumers have become more concerned about nutritional value, food safety, and immune-boosting properties. As a result, traditional medicinal plants have gained considerable attention. One such herb is turmeric, which contains curcumin, a bioactive compound widely recognized for its potential to enhance the immune system. Turmeric (Curcuma longa L.), a native Indian plant characterized by its underground rhizome and being a member of the Zingiberaceae family. It has been widely used as both a spice and a medicinal herb in many countries, including India, China, Indonesia, and Thailand. Holistic medicine such as Ayurveda, turmeric has been used to reduce mucus, relieve asthma symptoms, stimulate the immune system, and provide anti-cancer, anti-fungal, antiviral, and anti-inflammatory effects.3,4 It also plays some role in injury recovery, glucose homeostasis, indigestion improvement, cognitive optimization, dental caries management, joint function improvement, and lowering the risk of cardiovascular diseases, as well as treating skin infections.4-6 The primary active compounds in turmeric belong to the curcuminoid group with yellow-orange pigments including curcumin, demethoxycurcumin, and bis-demethoxycurcumin.7,8 However, fresh turmeric consumption is relatively limited, commonly found in powder, capsules, or as minor ingredients in beverages, due to its distinctive aroma and taste, which may not be acceptable to some consumers. To widen consumption options, some research has explored turmeric processing through pickling techniques. And India is reported to be the first country to apply this method while other countries have not reported yet.2,9-10
This study aims to focus on nutritional value, bioactive compounds, and pickling technique for increasing turmeric consumption and utilization. The application of a pickling solution derived from dried Garcinia (Garcinia atroviridis), a fruit native to Southern Thailand locally known as Som-Kek, serves as an innovative substitute for synthetic vinegar. Rich in natural organic acids, Garcinia provides a distinctively sour profile that is characteristic of the southern regions. Compared to the sharp odor of vinegar, it offers a milder aroma, which tends to improve consumer acceptability in terms of both flavor and nutritional benefits.9-10 A key component of Garcinia is hydroxycitric acid (HCA), a compound reported to assist in appetite control, inhibit fat accumulation, and provide antioxidant benefits.11-12 While vinegar remains a staple for food preservation due to its antimicrobial properties, its tendency to cause gastrointestinal discomfort or stomach irritation in some individuals can limit its widespread acceptance. Consequently, dried Garcinia emerges as a compelling alternative. Available year-round in its dried form, this fruit is easy to store while maintaining high quality, making it an ideal base for health-oriented products. Utilizing dried Garcinia also promotes the valuation of local agricultural outputs and reduces dependence on imported ingredients. Developing pickled turmeric with a Garcinia-based extract aligns with modern trends in healthy consumption and supports community-based economies. Such an approach not only preserves local wisdom but also has the potential to transform traditional herbal resources into sustainable, high-value functional foods with significant commercial viability.
Materials and Methods
All chemicals and reagents used in this study were of analytical or food grade, selected based on specific experimental requirements and sourced from commercial suppliers. The primary raw materials included fresh turmeric (Curcuma longa L.) rhizomes harvested from Si Banphot District, Phatthalung Province, Thailand. Additionally, Dried Garcinia atroviridis slices were purchased from a local supplier in the Sankalakhiri area, Sai Khao Subdistrict, Khok Pho District, Pattani Province, Thailand. The dried slices were used as received for the pickling process. For the control treatment, 150 mL of commercial distilled vinegar (5% acetic acid; Golden Mountain brand) was used with 150 mL of water, 100 g of turmeric rhizomes, and 10 g of black pepper. The vinegar was purchased from a local retail outlet. Analytical chemicals used for microbiological and physicochemical analyses were obtained from Sigma-Aldrich (USA) and Merck (Germany). Additional photographs of the raw materials and preparation steps are provided in Figure 1.
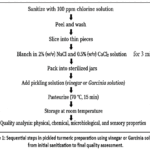 |
Figure 1: Sequential steps in pickled turmeric preparation using vinegar or Garcinia solution, from initial sanitization to final quality assessment. |
Preparation for pickled turmeric
Three formulations were prepared, as shown in Table 1. For the control treatment, 100 g of turmeric rhizomes was combined with 150 mL of distilled water, 150 mL of commercial distilled vinegar (5% acetic acid), and 10 g of black pepper. For treatment T1, 75 g of dried Garcinia atroviridis was combined with 300 mL of water, 100 g of turmeric rhizomes, and 10 g of black pepper. For treatment T2, 50 g of dried Garcinia atroviridis was combined with 300 mL of water, 100 g of turmeric rhizomes, and 10 g of black pepper. The dried Garcinia atroviridis was used to prepare the pickling medium at ratios of 1:4 (w/v) for T1 and 1:6 (w/v) for T2. All formulations contained the same amount of turmeric and black pepper. The samples were stored at ambient temperature (27–30 °C) for 28 days.
Table 1: Formulations of Pickled Turmeric.
|
Treatment |
Turmeric (g) | Water (mL) | Vinegar (mL) | Dried Garcinia atroviridis (g) |
Black Pepper (g) |
| Control | 100 | 150 | 150 | 0 |
10 |
|
T1 (Garcinia extract 1:4) |
100 | 300 | 0 | 75 | 10 |
| T2 (Garcinia extract 1:6) | 100 | 300 | 0 | 50 |
10 |
Note: The control sample consisted of turmeric pickled in a vinegar solution at a 1:1 ratio. T1 and T2 refer to pickled turmeric using dried Garcinia atroviridis extract at Garcinia-to-pickling solution ratios of 1:4 and 1:6, respectively (w/v). All treatments were prepared using a fixed total volume of pickling medium. Black pepper was incorporated into each formulation to provide piperine, aiming to enhance curcumin bioavailability.
Water Activity (aw)
Varying from 0 to 1, water activity (aw) represents the ratio of the vapor pressure of the food to pure water, serving as an index for available free water. The water activity (aw) level represents the level of free water available for chemical processes and microbial proliferation. This study monitored aw values across different stages, including fresh turmeric, balanced turmeric treated with a 2% sodium chloride (NaCl) and 0.5% calcium chloride (CaCl2) solution, and pickled turmeric. To assess shifts in free water content over time, measurements were recorded during storage at intervals of 1, 4, 7, 14, and 28 days.
pH Measurement
The pH level of a sample serves as a critical indicator of its acidic or alkaline nature, directly influencing its stability and microbial resistance. While neutral conditions are represented by a pH of 7, values below this threshold signify acidity—a key factor in suppressing bacterial growth, though certain molds and yeasts may still persist. Within this study, pH was monitored as a vital parameter for ensuring food quality and environmental suitability for storage. Measurements were systematically recorded for fresh turmeric, balanced turmeric in a 2% NaCl and 0.5% CaCl2 solution, and the resulting pickled turmeric. To track any shifts in acidity throughout the storage duration, pH values were assessed at intervals of 1, 4, 7, 14, and 28 days.
Proximate Analysis
Proximate analysis (moisture, ash, fat, and protein) was performed following AOAC standard guidelines.13 Analyses were conducted on fresh turmeric, blanched turmeric treated in a solution containing 2% sodium chloride (NaCl) and 0.5% calcium chloride (CaCl₂), and pickled turmeric after 28 days of storage.
Ascorbic Acid Analysis
Based on AOAC standard guidelines,14 the quantification of total ascorbic acid was performed using a titrimetric approach, utilizing a standard titrant to reach the definitive endpoint. using a titrimetric method with a standard solution until the endpoint was reached. Measurements were conducted on fresh turmeric, blanched turmeric treated in a solution containing 2% sodium chloride (NaCl) and 0.5% calcium chloride (CaCl₂), and pickled turmeric during storage at 1, 4, 7, 14, and 28 days.
Titratable Acidity (TA) Analysis
A standardized sodium hydroxide (NaOH) solution was used to determine titratable acidity (TA) based on the AOAC protocol,13 using a titrimetric method with standardized sodium hydroxide (NaOH) solution. Phenolphthalein was used as an indicator to determine the endpoint of the reaction. Measurements of titratable acidity were conducted on fresh turmeric, blanched turmeric treated in a solution containing 2% sodium chloride (NaCl) and 0.5% calcium chloride (CaCl₂), and pickled turmeric during storage at 1, 4, 7, 14, and 28 days.
Sample Preparation and Extraction
Samples of fresh turmeric, blanched turmeric treated in a solution containing 2% sodium chloride (NaCl) and 0.5% calcium chloride (CaCl₂), and pickled turmeric during storage at 1, 4, 7, 14, and 28 days were finely ground using a mortar and pestle. A 20-g aliquot of each homogenate was weighed and placed into a 600-mL breaker followed by the addition of 200 mL of 95% ethanol. Each beaker was covered with aluminum foil as a protective measure against solvent evaporation and light degradation, followed by a 24-h extraction process under continuous magnetic stirring at room temperature. Thereafter, the crude extracts were obtained by filtering the mixtures through Whatman No. 1 filter paper and were subsequently stored in amber glass bottles. The extracts were kept at 4 °C to induce impurity precipitation and then centrifuged in a refrigerated unit at 4 °C to clear leftover residues. The resulting supernatants underwent concentration via a rotary evaporator, with the water bath maintained at 50–55°C to ensure total ethanol removal. The resulting concentrated extracts were placed in amber bottles, shielded from light using aluminum foil, and maintained at -20 °C until further determination.15
Determination of Curcumin Content
UV-Visible spectrophotometric analysis was conducted on each sample at 421 nm to evaluate the curcumin concentration. To determine the final content, the resulting values were calculated against a standard calibration curve (R2 = 0.9985) generated from curcumin solutions ranging between 0 and 10 µg/ml. This analytical procedure followed the established methodology of Kumar and Bhat.16 All sample solutions were measured at the identical wavelength to maintain consistency during quantification against the standard curve. Results were reported as milligrams per gram (mg/g) of sample.
Determination of Total Carotene Content (TCC)
Following a previously described method,17 total carotene content was determined via microplate spectrophotometry at 446 nm against a solvent blank. Absorbance data were converted to carotene levels applying an extinction coefficient of 383, with the final values expressed in mg/g of sample.
Determination of Total Flavonoid Content (TFC)
The aluminum chloride colorimetric method was employed to quantify the total flavonoid content (TFC). In brief, 100 μL of the extract was reacted with an equal volume of 2% (w/v) AlCl₃·6H₂O, and the mixture was subsequently incubated at 30 °C for 60 min under dark conditions. In accordance with a previously described method,17 the TFC was expressed as milligrams of quercetin equivalents per gram of sample (mg QE/g) after calculating values from a quercetin calibration curve (0–20 µg/mL; R2= 0.9985). The necessary absorbance data were gathered at 420 nm utilizing a microplate reader.
Determination of Total Phenolic Content (TPC)
The determination of total phenolic content (TPC) was performed in a 96-well microplate using the Folin–Ciocalteu colorimetric approach. The assay involved mixing 20 μL of extract with 100 μL of 10% (v/v) Folin–Ciocalteu reagent, incubating in the dark at 30 °C for 6 min, and subsequently adding 80 μL of 7.5% (w/v) (Na2CO3) solution with a final 30-min holding period for color development. Absorbance readings were taken at 765 nm via a microplate reader, and a calibration curve of gallic acid (0–80 μg/mL; R2 = 0.9985) was employed for quantification. Following a previously described method,17 the TPC was computed and reported in milligrams of gallic acid equivalents per gram of sample (mg GAE/g).
DPPH Assay
The antioxidant activity was determined via the DPPH assay, based on the reduction of the 2,2-diphenyl-1-picrylhydrazyl radical, which is accompanied by a color change from deep purple to yellow. Briefly, 100 μL of the extract was reacted with 100 μL of 0.2 mM DPPH solution in 95% ethanol. The reaction mixture was subsequently maintained in the dark at 30 °C for 30 min, and the absorbance was recorded at 517 nm via a microplate reader. To quantify the antioxidant capacity, calibration curves were established using BHT (0–60 µg/mL; R2 = 0.9969), ascorbic acid (0–25 µg/mL; R2 = 0.9968), and Trolox (0–12 µg/mL; R 2) = 0.9967) as standard compounds. Following a previously described method,17 these curves were utilized to determine the antioxidant properties of the samples.
ABTS Assay
The ABTS assay was employed to evaluate radical scavenging potential. For reagent preparation, 7.4 mM ABTS and 2.5 mM K2S2O8were reacted in the dark at 30 °C for 12 h, and the mixture was diluted to reach an absorbance value of 1.1 ± 0.02 at 734 nm. For the analytical procedure, a 20-µL volume of extract was treated with 280 µL of the prepared ABTS radical solution and allowed to stand in the dark at 30 °C for 2 h. After incubation, the absorbance of the reaction mixture was measured at 734 nm using a microplate reader. The antioxidant capacity was calculated against standard calibration curves of BHT (0–60 μg/mL; R 2 = 0.9969), ascorbic acid (0–25 μg/mL; R 2 = 0.9968), and Trolox (0–12 μg/mL; R 2 = 0.9967), in accordance with a previously described method,17
Microbiological Analysis
The microbiological quality of the processed food products was evaluated according to the microbiological standards for cooked or processed foods. In this study, analyses were carried out on both raw materials, including fresh turmeric, dried Garcinia atroviridis, and black pepper, as well as pickled turmeric products throughout 28 days of storage. To ensure safety and quality, the microbiological profile was assessed by examining several key parameters, including lactic acid bacteria, Salmonella spp., Staphylococcus aureus, Escherichia coli, yeasts and molds, and total viable counts. These examinations were performed according to the standard protocols detailed in BAM18-22 and previously described methodologies.23
The microbiological quality criteria applied in this study were based on the standards for cooked or processed foods, particularly pickled, preserved, candied, or dried fruits and vegetables, as established by the Department of Medical Sciences (2017).24 The acceptable microbiological limits included a total viable count of less than 1 × 10⁵ CFU/g, yeasts and molds of less than 1,000 CFU/g, Escherichia coli of less than 3 MPN/g, and Staphylococcus aureus of less than 100 CFU/g. In addition, Salmonella spp. must not be detected in 25 g of the sample. These criteria were used as reference standards to evaluate the microbiological safety and quality of both the raw materials and the pickled turmeric products throughout storage.
Sensory Evaluation
A panel of 50 untrained participants was recruited to determine the consumer acceptability of the pickled turmeric. To achieve a comprehensive quality profile, sensory attributes including appearance, color, aroma, taste, texture, and overall acceptability were rated by panelists. The assessment utilized a 9-point hedonic scale, where 1 and 9 represented ‘dislike extremely’ and ‘like extremely,’ respectively. Product samples were coded and served to each panelist for tasting, with instructions to rate each attribute based on individual preference levels. The collected scores were subjected to statistical analysis, with data expressed as mean ± standard deviation (SD). One-way analysis of variance (ANOVA) was applied to evaluate overall consumer acceptance. The results were further used as a guideline for product development and improvement to better meet consumer preferences. All participants voluntarily took part in the sensory evaluation and provided informed consent before the study. The sensory evaluation involved commercially available food ingredients and posed minimal risk to participants; therefore, ethical approval was not required.
Experimental Design and Statistical Analysis
Triplicate experiments were carried out according to a completely randomized design (CRD). All analyses including proximate composition, antioxidant activity, pH, aw and curcuminoids were performed under CRD except sensory evaluation was conducted by randomized completely block design (RCBD) with consented 50 panelists. All data obtained from the quality evaluation of the products were statistically analyzed using SPSS software to ensure systematic interpretation of the experimental results. To identify differences among sample groups, one-way analysis of variance (ANOVA) followed by Duncan’s Multiple Range Test (DMRT) was utilized, with significance set at p < 0.05. All experimental outcomes were expressed as mean ± standard deviation (SD).
Results
Water Activity (aw)
Changes in water activity (aw) of turmeric samples during the pickling process are presented in Table 2A. Fresh turmeric exhibited the highest aw value (0.993), which slightly decreased to 0.989 after blanching. After pickling, all treatments showed a further reduction in aw values. On day 1, aw values of turmeric samples in the control, T1, and T2 were 0.984, 0.984, and 0.987, respectively. During storage, aw values of turmeric samples showed minor fluctuations and gradually stabilized over 28 days. In general, T2 maintained slightly higher aw than those of the other treatments throughout the storage period. The aw values of the pickling solutions increased after day 1 (from 0.992, 0.983, and 0.986 to 0.993, 0.990, and 0.991 for control, T1, and T2, respectively), indicating moisture migration from turmeric tissue into the surrounding medium.
pH
The changes in pH of turmeric samples and pickling solutions during storage are presented in Table 2B and Figure 2. Fresh turmeric exhibited an initial pH of 5.63, which slightly increased to 5.68 after blanching in a solution containing 2% NaCl and 0.5% CaCl₂. After 1 day of pickling, a marked decrease in pH was observed across all treatments, with values of 3.18 (control), 2.04 (T1), and 2.13 (T2). Throughout storage, the pH of turmeric samples and pickling solutions gradually increased and then stabilized from day 4 to day 28. The pH of the pickling solutions increased over time, rising from 2.49 to 3.21 in control, from 1.47 to 1.81 in T1, and from 1.63 to 1.93 in T2.
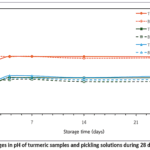 |
Figure 2: Changes in pH of turmeric samples and pickling solutions during 28 days of storage |
Table 2: Water activity (aw) and pH values of turmeric samples and pickling solutions during 28 days of storage.
|
A. Water activity (aw) |
||||||
| Sample | 0 | 1 | 4 | 7 | 14 |
28 |
|
Turmeric samples |
||||||
| Fresh turmeric | 0.993 ± 0.00* | ND | ND | ND | ND |
ND |
|
Blanched turmeric |
0.989 ± 0.00* | ND | ND | ND | ND | ND |
| Control | ND | 0.984 ± 0.00ᵇ | 0.987 ± 0.00ᵃ | 0.986 ± 0.00ᵃ | 0.986 ± 0.00ᵇ |
0.985 ± 0.00ᵇ |
|
T1 (Garcinia extract 1:4) |
ND | 0.984 ± 0.01ᵇ | 0.985 ± 0.00ᵇ | 0.986 ± 0.00ᵃ | 0.986 ± 0.00ᵇ | 0.987 ± 0.00ᵇ |
| T2 (Garcinia extract 1:6) | ND | 0.987 ± 0.00ᵃ | 0.988 ± 0.00ᵃ | 0.987 ± 0.00ᵃ | 0.987 ± 0.00ᵃ |
0.988 ± 0.00ᵃ |
|
Pickling solutions |
||||||
|
Blanching solution |
0.983 ± 0.01ᶜ | ND | ND | ND | ND |
ND |
| Control | 0.992 ± 0.00ᵃ | 0.994 ± 0.00ᵃ | 0.993 ± 0.00ᵃ | 0.993 ± 0.00ᵃ | 0.994 ± 0.00ᵃ |
0.993 ± 0.00ᵃ |
|
T1 (Garcinia extract 1:4) |
0.983 ± 0.00ᶜ | 0.990 ± 0.00ᶜ | 0.990 ± 0.00ᵇ | 0.991 ± 0.00ᵃ | 0.992 ± 0.00ᵇ | 0.992 ± 0.00ᵃ |
| T2 (Garcinia extract 1:6) | 0.986 ± 0.00ᵇ | 0.991 ± 0.00ᵇ | 0.991 ± 0.00ᵃ | 0.994 ± 0.00ᵃ | 0.994 ± 0.00ᵇ |
0.992 ± 0.00ᵃ |
|
B. pH values |
||||||
|
Sample |
0 | 1 | 4 | 7 | 14 | 28 |
| Turmeric samples |
|
|||||
|
Fresh turmeric |
5.63 ± 0.01 | ND | ND | ND | ND | ND |
| Blanched turmeric | 5.68 ± 0.02 | ND | ND | ND | ND |
ND |
|
Control |
ND | 3.18 ± 0.03ᵃ | 3.28 ± 0.01ᵃ | 3.27 ± 0.01ᵃ | 3.27 ± 0.04ᵃ | 3.26 ± 0.02ᵃ |
| T1 (Garcinia extract 1:4) | ND | 2.04 ± 0.01ᶜ | 2.07 ± 0.02ᶜ | 2.06 ± 0.03ᶜ | 2.05 ± 0.01ᶜ |
2.06 ± 0.04ᶜ |
|
T2 (Garcinia extract 1:6) |
ND | 2.13 ± 0.01ᵇ | 2.18 ± 0.02ᵇ | 2.17 ± 0.03ᵇ | 2.17 ± 0.02ᵇ | 2.18 ± 0.01ᵇ |
| Pickling solutions |
|
|||||
|
Blanching solution |
6.08 ± 0.04ᵃ | ND | ND | ND | ND | ND |
| Control | 2.33 ± 0.01ᶜ | ND | ND | ND | ND |
ND |
|
T1 (Garcinia extract 1:4) |
2.49 ± 0.03ᵇ | 3.21 ± 0.01ᵃ | 3.28 ± 0.05ᵃ | 3.26 ± 0.01ᵃ | 3.17 ± 0.01ᵃ | 3.21 ± 0.02ᵃ |
| T2 (Garcinia extract 1:6) | 1.47 ± 0.01ᵉ | 1.81 ± 0.04ᶜ | 1.97 ± 0.01ᶜ | 1.95 ± 0.01ᶜ | 1.84 ± 0.03ᶜ |
1.85 ± 0.01ᶜ |
Note: Control = turmeric pickled in a vinegar solution (1:1); T1 and T2 = turmeric pickled in dried Garcinia atroviridis extract at ratios of 1:4 and 1:6, respectively. The blanching solution contained 2% NaCl and 0.5% CaCl₂. Results are presented as mean ± SD. Within each column, values with different superscript letters are significantly different (p ≤ 0.05). Values marked with an asterisk (*) differ significantly among the initial samples (p ≤ 0.05). ND indicates that the parameter was not determined.
Color
Table 3 present the CIE color parameters (L*, a*, and b*) of turmeric samples after blanching and during pickling. Significant effects of both treatment and storage period on color characteristics were observed (p ≤ 0.05). The L* value decreased following blanching and continued to decline throughout storage across all treatments, indicating progressive darkening of the turmeric samples.
The a* value increased after blanching, suggesting an enhancement of red–orange coloration in the turmeric tissue. Similarly, the b* value showed an increase after processing, reflecting a higher intensity of yellow pigmentation.
Table 3. Changes in color parameters (CIE L*, a*, and b*) of turmeric samples under different pickling conditions during 28 days of storage.
|
Parameter |
Sample | Initial | 1 | 4 | 7 | 14 |
28 |
| L* |
Fresh |
48.28 ± 3.27 | ND | ND | ND | ND | ND |
| Blanched turmeric |
46.95 ± 2.36 | ND | ND | ND | ND |
ND |
|
|
Control |
ND | 44.42 ± 4.75ᵇ | 45.47 ± 1.25ᵃ | 44.88 ± 1.93ᵃ | 42.36 ± 3.26ᵃ | 41.02 ± 3.39ᵇ | |
| T1 (Garcinia extract 1:4) |
ND | 44.03 ± 1.03ᵇ | 46.15 ± 4.53ᵃ | 47.23 ± 2.15ᵃ | 44.04 ± 0.53ᵃ |
49.24 ± 3.86ᵃ |
|
|
T2 (Garcinia |
ND | 50.22 ± 1.68ᵃ | 48.18 ± 4.39ᵃ | 46.31 ± 3.51ᵃ | 46.12 ± 3.44ᵃ | 47.36 ± 1.79ᵃ | |
| a* | Fresh turmeric |
29.28 ± 5.13 | ND | ND | ND | ND |
ND |
|
Blanched |
30.64 ± 3.61 | ND | ND | ND | ND | ND | |
| Control | ND | 24.86 ± 2.75ᵇ | 23.25 ± 3.55ᵇ | 24.24 ± 2.78ᵃ | 23.22 ± 2.80ᵃ |
21.63 ± 3.99ᵃ |
|
|
T1 (Garcinia |
ND | 29.87 ± 3.23ᵃ | 27.39 ± 1.62ᵃ | 25.92 ± 1.68ᵃ | 27.03 ± 2.97ᵃ | 23.97 ± 2.78ᵃ | |
| T2 (Garcinia extract 1:6) |
ND | 28.79 ± 2.76ᵃ | 28.74 ± 2.76ᵃ | 25.17 ± 1.00ᵃ | 24.04 ± 2.93ᵃ |
25.62 ± 3.80ᵃ |
|
|
b* |
Fresh |
52.17 ± 4.06 | ND | ND | ND | ND | ND |
| Blanched turmeric |
54.99 ± 7.14 | ND | ND | ND | ND |
ND |
|
|
Control |
ND | 38.56 ± 5.86ᶜ | 44.76 ± 1.84ᵃ | 42.39 ± 4.93ᵃ | 36.85 ± 6.17ᵇ | 39.70 ± 19.40ᵇ | |
| T1 (Garcinia extract 1:4) |
ND | 45.16 ± 2.34ᵇ | 47.90 ± 6.79ᵃ | 47.93 ± 3.63ᵃ | 44.76 ± 3.18ᵃ |
53.54 ± 3.77ᵃ |
|
|
T2 (Garcinia |
ND | 51.54 ± 3.13ᵃ | 50.84 ± 5.98ᵃ | 47.06 ± 5.65ᵃ | 47.36 ± 5.79ᵃ |
48.88 ± 2.39ᵃ |
Note: Blanched turmeric was carried out in a solution containing 2% NaCl and 0.5% CaCl₂. Control = turmeric pickled in a vinegar solution (1:1), whereas T1 and T2 were pickled using dried Garcinia atroviridis extract at ratios of 1:4 and 1:6, respectively Results are reported as mean ± SD. Different superscript letters (a–c) within a column denote significant differences (p ≤ 0.05) among treatments for each color parameter (L*, a*, b*). ** ND = not determined.
Proximate Analysis
Table 4 presents the proximate composition of fresh, blanched, and pickled turmeric samples.The moisture content of blanched turmeric (90.83% wb) was higher than that of fresh turmeric (90.14% wb). After 28 days of pickling, moisture content decreased significantly in all treatments. The control sample showed the highest moisture content (88.23% wb), followed by T2 (86.94% wb) and T1 (86.03% wb) (p ≤ 0.05). Ash content increased markedly after blanching (14.54% db) compared to fresh turmeric (2.09% db) and remained higher in all pickled samples. Protein content was also higher in blanched and pickled samples (6.41–10.00% db) compared to fresh turmeric (3.55% db). Fat content decreased after processing, with fresh turmeric showing the highest value (7.28% db), while pickled samples ranged from 4.54 to 5.77% db. Carbohydrate content decreased in processed samples and was inversely related to changes in other proximate components.
Table 4: Proximate composition of turmeric samples (g/100 g db) except moisture content.
|
Parameter |
Fresh turmeric | Blanched turmeric | Control
(28 days) |
T1
(28 days) |
T2
(28 days) |
| Moisture (% wb) | 90.14 ± 0.28ᵃ | 90.83 ± 0.28ᵃ | 88.23 ± 0.86ᵇ | 86.03 ± 0.42ᵈ |
86.94 ± 0.45ᶜ |
|
Ash |
2.09 ± 0.04ᵈ | 14.54 ± 0.24ᵃ | 4.60 ± 0.47ᵇ | 4.24 ± 0.07ᵇᶜ | 3.90 ± 0.25ᶜ |
| Protein | 3.55 ± 0.10ᵈ | 9.99 ± 0.32ᵃ | 6.87 ± 0.32ᵇ | 6.59 ± 0.22ᵇᶜ |
6.41 ± 0.10ᶜ |
|
Fat |
7.28 ± 0.19ᵃ | 6.87 ± 0.32ᵇ | 5.77 ± 0.58ᶜ | 4.54 ± 0.15ᵉ | 5.41 ± 0.29ᵈ |
| Total carbohydrate* | 87.06 ± 0.29ᵃ | 68.58 ± 0.62ᵈ | 82.75 ± 0.33ᶜ | 84.61 ± 0.31ᵇ |
84.26 ± 0.60ᵇ |
Note: Blanching was carried out in a solution containing 2% NaCl and 0.5% CaCl₂. Control = turmeric pickled in a vinegar solution (1:1), whereas T1 and T2 were pickled using dried Garcinia atroviridis extract at ratios of 1:4 and 1:6, respectively. Results are reported as mean ± SD. Within each row, values assigned different superscript letters (a–e) are significantly different (p ≤ 0.05). Total carbohydrate content was estimated by difference. Ascorbic Acid Content
Ascorbic Acid Content
Table 5 summarizes the changes in ascorbic acid content in the turmeric samples during pickling. Fresh turmeric contained 10.48 mg/100 g db, which decreased slightly after blanching (9.68 mg/100 g db). During pickling, ascorbic acid content increased significantly (p ≤ 0.05) in all treatments over storage time. On day 28, T1 showed the highest value (15.68 mg/100 g db), followed by T2 (14.27 mg/100 g db) and the control (13.08 mg/100 g db).
Table 5: Ascorbic acid content of turmeric samples during pickling (mg/100 g db).
|
Sample |
Treatment | Day | Ascorbic acid (mg/100 g db) |
| Commercial vinegar | ND | NA |
0.07 ± 0.01ʳ* |
|
Fresh turmeric |
ND | 0 | 10.48 ± 0.05ᵖ |
| Blanched turmeric | ND | 0 |
9.68 ± 0.05q |
|
Control |
1:1 vinegar | 1 | 12.37 ± 0.08ⁿ |
| 4 |
12.29 ± 0.04ᵒ |
||
| 7 | 12.71 ± 0.03ᵐ | ||
| 14 |
12.83 ± 0.06ˡ |
||
| 28 | 13.08 ± 0.01ᵏ | ||
| T1 | 1:4 Garcinia extract | 1 |
15.28 ± 0.03ᵈ |
| 4 | 15.01 ± 0.04ᵉ | ||
| 7 |
15.55 ± 0.06ᵇ |
||
| 14 | 15.41 ± 0.03ᶜ | ||
| 28 |
15.68 ± 0.05ᵃ |
||
|
T2 |
1:6 Garcinia extract | 1 | 13.95 ± 0.03ʲ |
| 4 |
14.32 ± 0.02ᵍ |
||
| 7 | 14.02 ± 0.03ⁱ | ||
| 14 |
14.36 ± 0.06ᶠ |
||
| 28 |
14.27 ± 0.03ʰ |
Note: Commercial vinegar is expressed as mg/100 mL. Blanching was carried out in a solution containing 2% NaCl and 0.5% CaCl₂. Control = turmeric pickled in a vinegar solution (1:1), whereas T1 and T2 were pickled using dried Garcinia atroviridis extract at ratios of 1:4 and 1:6, respectively. Results are reported as mean ± SD. Means assigned different superscript letters (a–r) within a column are significantly different (p ≤ 0.05) for each sample group. ND indicates not determined, whereas NA indicates not applicable. Day 0 corresponds to the initial measurement.
Titratable Acidity (TA)
Table 6 shows the changes in titratable acidity (TA) of turmeric samples during pickling. Fresh and blanched turmeric showed very low initial TA values (0.006–0.013% as acetic acid) with no significant difference between them. After pickling, TA increased significantly (p ≤ 0.05) in all treatments. On day 28, T1 showed the highest TA (0.486%), followed by the control (0.435%) and T2 (0.413%).
Table 6: Combined total titratable acidity (TA) of turmeric samples and pickling solutions during pickling and storage.
|
Sample |
Day | TA of turmeric
(% w/w as acetic acid) |
TA of turmeric
(% w/w as citric acid) |
TA of solution
(% w/v as acetic acid) |
TA of solution (% w/v as citric acid) |
|
Fresh turmeric |
0 | 0.013 ± 0.01ⁱ | 0.015 ± 0.16ⁱ | ND | ND |
| Blanched turmeric | 0 | 0.006 ± 0.02ⁱ | 0.006 ± 0.03ⁱ | ND |
ND |
|
Commercial vinegar |
NA | ND | ND | 5.321 ± 0.01ᵇ | 5.675 ± 0.01ᵇ |
| Control | NA | ND | ND | 2.519 ± 0.02ᵍ |
2.687 ± 0.01ᵍ |
|
1 |
0.366 ± 0.01f | 0.390 ± 0.03f | 2.200 ± 0.01ⁱ | 2.346 ± 0.02ⁱ | |
| 4 | 0.370 ± 0.02ef | 0.395 ± 0.02ef | 2.167 ± 0.04ᵏ |
2.311 ± 0.04ʲ |
|
|
7 |
0.378 ± 0.01de | 0.403 ± 0.01de | 2.142 ± 0.03ˡ | 2.285 ± 0.02ᵏ | |
| 14 | 0.383 ± 0.01d | 0.408 ± 0.02d | 1.847 ± 0.01ᵒ |
1.970 ± 0.01ᵒ |
|
|
28 |
0.435 ± 0.01b | 0.464 ± 0.03b | 1.881 ± 0.01ⁿ | 2.006 ± 0.01ⁿ | |
| T1 | 1 | 0.394 ± 0.01ᶜ | 0.420 ± 0.01ᶜ | 2.725 ± 0.02ᵈ |
2.906 ± 0.01ᵈ |
|
4 |
0.426 ± 0.02ᵇ | 0.455 ± 0.04ᵇ | 2.679 ± 0.01ᵉ | 2.857 ± 0.01ᵉ | |
| 7 | 0.429 ± 0.02ᵇ | 0.458 ± 0.01ᵇ | 2.662 ± 0.01ᶠ |
2.838 ± 0.02ᶠ |
|
|
14 |
0.480 ± 0.01ᵃ | 0.512 ± 0.03ᵃ | 2.184 ± 0.02ʲ | 2.223 ± 0.04ˡ | |
| 28 | 0.486 ± 0.01ᵃ | 0.518 ± 0.01ᵃ | 2.251 ± 0.03ʰ |
2.401 ± 0.01ʰ |
|
| T2 |
1 |
0.284 ± 0.01ʰ | 0.303 ± 0.03ʰ | 2.154 ± 0.01ᵏˡ | 2.297 ± 0.01ʲᵏ |
| 4 | 0.295 ± 0.01ᵍ | 0.315 ± 0.01ᵍ | 2.142 ± 0.01ˡ |
2.285 ± 0.01ᵏ |
|
|
7 |
0.303 ± 0.01ᵍ | 0.323 ± 0.01ᵍ | 2.140 ± 0.01ˡ | 2.283 ± 0.02ᵏ | |
| 14 | 0.361 ± 0.01ᶠ | 0.385 ± 0.01ᶠ | 1.859 ± 0.01ᵒ |
1.983 ± 0.01ᵒ |
|
|
28 |
0.413 ± 0.01ᵇ | 0.460 ± 0.02ᵇ | 1.903 ± 0.02ᵐ |
2.029 ± 0.02ᵐ |
Note: Blanching was carried out in a solution containing 2% NaCl and 0.5% CaCl₂. Control samples were pickled in a vinegar solution (1:1), whereas T1 and T2 were pickled using dried Garcinia atroviridis extract at ratios of 1:4 and 1:6, respectively. Results are reported as mean ± SD. Means assigned different superscript letters (a–o) within a column are significantly different (p ≤ 0.05) for each sample group (turmeric samples or pickling solutions). ND indicates not determined, whereas NA indicates not applicable.
Total Curcumin Content
Table 7 shows the changes in total curcumin content of turmeric samples during blanching and pickling. Fresh turmeric contained 14.55 mg/g db, which decreased significantly to 10.72 mg/g db after blanching (26.35% reduction). During pickling, curcumin content further decreased in all treatments. After 28 days, values were 7.91 mg/g db (control), 7.26 mg/g db (T1), and 9.51 mg/g db (T2). These corresponded to reductions of 45.61%, 50.09%, and 34.67%, respectively, compared with fresh turmeric.
Total Carotene, Flavonoid, and Phenolic Contents
Table 7 shows the changes in total carotene, flavonoid, and phenolic contents of turmeric samples during blanching and pickling. Fresh turmeric contained 2.98 mg/g db carotene, 2.27 mg QE/g db flavonoids, and 19.37 mg GAE/g db phenolics. After blanching, these values decreased to 1.51 mg/g db, 1.75 mg QE/g db, and 11.84 mg GAE/g db, respectively. During pickling, all antioxidant compounds further decreased at the early stage (days 1–4). On day 28, the highest carotene content was observed in T1 (2.85 mg/g db), while T2 showed the highest flavonoid (1.48 mg QE/g db) and phenolic content (4.84 mg GAE/g db).
Table 7: Total curcumin, carotene, flavonoid, and phenolic contents of turmeric samples during processing and pickling.
|
Sample type |
Treatment | Pickling time
(day) |
Total curcumin content
(mg/g db) |
Total carotene
content (mg/g db) |
Total flavonoid
content (mg QE/g db) |
Total phenolic content
(mg GAE/g db) |
| Fresh turmeric |
ND | 0 | 14.55 ± 0.03ᵃ | 2.98 ± 0.13a | 2.27 ± 0.02a |
19.37 ± 0.64a |
|
Blanched |
ND | 0 | 10.72 ± 0.04ᵇ | 1.51 ± 0.08g | 1.75 ± 0.02b | 11.84 ± 0.23b |
| Control | 1 | 5.86 ± 0.03ᵏ | 1.61 ± 0.02fg | 0.90 ± 0.02i |
2.65 ± 0.12hi |
|
| Pickled turmeric |
4 |
5.97 ± 0.07ʲ | 1.72 ± 0.22f | 1.14 ± 0.03f | 3.16 ± 0.09g | |
| 7 | 7.37 ± 0.03ᶠ | 2.04 ± 0.06cd | 1.26 ± 0.00d |
4.12 ± 0.15e |
||
|
14 |
4.85 ± 0.01ⁿ | 0.61 ± 0.00i | 0.96 ± 0.02h | 2.53 ± 0.25hi | ||
| 28 | 7.91 ± 0.04ᵉ | 2.46 ± 0.12b | 1.15 ± 0.01f |
5.50 ± 0.07c |
||
| T1 |
1 |
3.65 ± 0.03ᵖ | 1.97 ± 0.06de | 0.75 ± 0.02k | 2.68 ± 0.27hi | |
| 4 | 5.81 ± 0.03ˡ | 2.05 ± 0.09cd | 0.77 ± 0.03k |
3.58 ± 0.18f |
||
|
7 |
6.54 ± 0.03ʰ | 2.13 ± 0.11c | 1.07 ± 0.02g | 4.21 ± 0.22e | ||
| 14 | 4.40 ± 0.00ᵒ | 0.89 ± 0.02h | 0.81 ± 0.03j |
3.17 ± 0.28g |
||
|
28 |
7.26 ± 0.01ᵍ | 2.85 ± 0.16a | 1.18 ± 0.01e | 4.21 ± 0.10e | ||
| T2 | 1 | 5.85 ± 0.03ᵏˡ | 1.88 ± 0.06e | 0.97 ± 0.03h |
2.36 ± 0.28i |
|
|
4 |
6.20 ± 0.05ⁱ | 1.99 ± 0.05cde | 1.08 ± 0.02g | 2.91 ± 0.19gh | ||
| 7 | 9.43 ± 0.03ᵈ | 2.04 ± 0.07cd | 1.13 ± 0.02f |
4.19 ± 0.35e |
||
|
14 |
5.70 ± 0.04ᵐ | 0.95 ± 0.07h | 1.14 ± 0.02f | 3.63 ± 0.21f | ||
| 28 | 9.51 ± 0.03ᶜ | 2.41 ± 0.07b | 1.48 ± 0.02c |
4.84 ± 0.26d |
Note: Blanching was carried out in a solution containing 2% NaCl and 0.5% CaCl₂. Control = turmeric pickled in a vinegar solution (1:1), whereas T1 and T2 were pickled using dried Garcinia atroviridis extract at ratios of 1:4 and 1:6, respectively. Data are presented as mean ± standard deviation (SD; n = 3). Means with different superscript letters within the same column differ significantly (p ≤ 0.05) within each sample group. NA denotes not applicable.
DPPH and ABTS Assays
Table 8A and 8B present the antioxidant activities of turmeric samples determined by DPPH and ABTS assays, respectively. Significant differences (p ≤ 0.05) were observed among treatments during blanching and pickling.Fresh turmeric showed the highest antioxidant activity (63.93 mg BHT/g db, 26.08 mg TE/g db, and 15.70 mg AA/g db), which significantly decreased after blanching. During pickling, DPPH radical scavenging activity decreased during the early storage period (days 1–14) and increased again at day 28. At day 28, the control sample exhibited higher DPPH activity than T1 and T2. In contrast, ABTS activity showed an overall increasing trend during storage, with the highest values observed on day 28 in the control, followed by T1 and T2.
Table 8: Antioxidant activity of pickled turmeric determined by DPPH and ABTS assays.
|
A. DPPH assay |
||||||
|
Sample Type |
Treatment | Pickling Time
(Day) |
DPPH assays | |||
| mg BHT/ g db | mg TE/ g db |
mg AA/ g db |
||||
|
Fresh |
ND | 0 | 63.93 ± 0.59a | 26.06 ± 0.23a | 15.70 ± 0.14a | |
| Blanched turmeric |
ND | 0 | 58.68 ± 0.45b | 24.13 ± 0.18b |
14.51 ± 0.11b |
|
|
Control |
1 | 48.49 ± 0.28f | 19.88 ± 0.11f | 11.96 ± 0.07f | ||
| Pickled turmeric |
4 | 50.47 ± 0.31e | 20.65 ± 0.12e |
12.43 ± 0.07e |
||
| 7 | 51.67 ± 0.15d | 21.12 ± 0.06d | 12.71 ± 0.03d | |||
| 14 | 44.86 ± 0.21h | 18.47 ± 0.08h |
11.11 ± 0.05h |
|||
| 28 | 53.60 ± 0.49c | 21.87 ± 0.19c | 13.17 ± 0.12c | |||
| T1 | 1 | 42.18 ± 0.27k | 17.26 ± 0.10k |
10.39 ± 0.06k |
||
| 4 | 44.17 ± 0.23i | 18.03 ± 0.09i | 10.86 ± 0.06i | |||
| 7 | 47.17 ± 0.38g | 19.20 ± 0.15g |
11.56 ± 0.09g |
|||
| 14 | 39.26 ± 0.23m | 16.12 ± 0.09m | 9.70 ± 0.05m | |||
| 28 | 47.45 ± 0.24g | 19.31 ± 0.09g |
11.63 ± 0.06g |
|||
|
T2 |
1 | 41.05 ± 0.30l | 16.97 ± 0.16l | 10.21 ± 0.10l | ||
| 4 | 41.99 ± 0.30k | 17.25 ± 0.12k |
10.38 ± 0.07k |
|||
| 7 | 42.74 ± 0.14j | 17.54 ± 0.05j | 10.55 ± 0.03j | |||
| 14 | 39.11 ± 0.17m | 16.12 ± 0.07m |
9.70 ± 0.04m |
|||
| 28 | 44.28 ± 0.14i | 18.14 ± 0.06i |
10.92 ± 0.03i |
|||
|
B. ABTS assay |
||||||
|
Sample Type |
Treatment |
Pickling Time
(Day) |
ABTS assays |
|||
| mg BHT/ g db | mg TE/ g db |
mg AA/ g db |
||||
|
Fresh |
ND | 0 | 4.91 ± 0.07l | 3.47 ± 0.06m | 3.95 ± 0.06m | |
| Blanched turmeric |
ND | 0 | 16.32 ± 0.24k | 12.71 ± 0.20l |
13.77 ± 0.21l |
|
|
|
Control | 1 | 22.12 ± 0.14d | 17.55 ± 0.05d | 18.83 ± 0.06d | |
| Pickled turmeric |
4 | 23.70 ± 0.32c | 18.83 ± 0.11c |
20.19 ± 0.12c |
||
|
|
7 | 24.28 ± 0.15b | 19.30 ± 0.26b | 20.69 ± 0.28b | ||
| 14 | 22.06 ± 0.10d | 15.51 ± 0.17h |
16.67 ± 0.18h |
|||
|
|
28 | 25.79 ± 0.10a | 20.53 ± 0.08a | 21.99 ± 0.09a | ||
| T1 | 1 | 19.21 ± 0.07h | 15.25 ± 0.06i |
16.36 ± 0.06i |
||
|
|
4 | 19.95 ± 0.10g | 15.85 ± 0.08g | 17.00 ± 0.09g | ||
| 7 | 20.99 ± 0.10e | 16.70 ± 0.08e |
17.89 ± 0.09e |
|||
|
|
14 | 18.57 ± 0.21i | 14.73 ± 0.17j | 15.81 ± 0.18j | ||
| 28 | 22.06 ± 0.15d | 17.56 ± 0.12d |
18.81 ± 0.13d |
|||
|
|
T2 | 1 | 19.20 ± 0.09h | 15.21 ± 0.07i | 16.33 ± 0.08i | |
| 4 | 20.52 ± 0.18f | 16.29 ± 0.15f |
17.47 ± 0.15f |
|||
|
|
– | 7 | 21.04 ± 0.10e | 16.71 ± 0.08e | 17.92 ± 0.09e | |
| – | 14 | 16.73 ± 0.07j | 13.21 ± 0.06k |
14.21 ± 0.06k |
||
|
|
28 | 21.20 ± 0.12e | 16.84 ± 0.09e |
18.06 ± 0.10e |
||
Note: Blanching was carried out in a solution containing 2% NaCl and 0.5% CaCl₂. Control = turmeric pickled in a vinegar solution (1:1), whereas T1 and T2 were pickled using dried Garcinia atroviridis extract at ratios of 1:4 and 1:6, respectively. Data are presented as mean ± standard deviation (SD; n = 3). Means with different superscript letters within the same column differ significantly (p ≤ 0.05). ND denotes not determined.
Microbiological Analysis
Table 9 presents the microbiological quality of raw materials and pickled turmeric products. Among the raw materials, black pepper showed the highest total microbial count and yeast–mold count (1.29 × 10⁶ CFU/g). After blanching and pickling, all turmeric samples showed a significant reduction in microbial loads, and all values were within acceptable safety limits.
Table 9. Microbiological analysis of raw materials and pickled turmeric products.
| Parameters | Turmeric | Garcinia atroviridis | Black pepper | Control | T1 | T2 |
| Total plate count (CFU/g) | 5.3 × 10³ | 2.8 × 10¹ | 1.29 × 10⁶ | 2.0 × 10² | <25 | <25 |
| Yeast and mold (CFU/g) | 6.9 × 10⁴ | ND (<10) | 9.83 × 10⁶ | <10 | <10 | <10 |
| Escherichia coli (MPN/g) | ND (<3) | ND (<3) | ND (<3) | ND (<3) | ND (<3) | ND (<3) |
| Staphylococcus aureus (CFU/g) | ND (<10) | ND (<10) | ND (<10) | ND (<10) | ND (<10) | ND (<10) |
| Salmonella spp.
(/25 g) |
Not
detected |
Not
detected |
Not
detected |
Not
detected |
Not
detected |
Not detected |
| Lactic acid bacteria (CFU/g) | ND (<10) | ND (<10) | ND (<10) | ND (<10) | ND (<10) | ND (<10) |
Note: ND = not detected. Control = turmeric pickled in a vinegar solution (1:1), whereas T1 and T2 were pickled using dried Garcinia atroviridis extract at ratios of 1:4 and 1:6, respectively.
Sensory Evaluation
Fifty panelists evaluated the pickled turmeric products for color, aroma, taste, texture, and overall liking using a 9-point hedonic scale (Table 10). Significant differences (p ≤ 0.05) were observed among treatments and storage times, as indicated by different superscript letters. Overall, sensory scores were generally higher in pickled samples compared with fresh turmeric. Among treatments, T1 (1:4 Garcinia extract) consistently showed the highest acceptability at both day 4 and day 28, with more than 80% of panelists scoring ≥6 (like slightly to like very much). In contrast, the control and T2 treatments showed moderate acceptance levels.
Table 10: Sensory evaluation of fresh turmeric and pickled turmeric products on day 4 and day 28.
| Sensory attributes | Fresh turmeric | Day4 | Day28 | |||||
| Control | T1 | T2 | Control | T1 | T2 | |||
| Color | 7.20 ± 1.15abc | 6.08 ± 1.65d | 7.38 ± 1.25ab | 7.14 ± 1.06bc | 6.78 ± 1.32c | 7.74 ± 1.20a | 6.9 ± 1.40bc | |
| Aroma | 6.36 ± 1.52ab | 5.62 ± 1.77c | 6.78 ± 1.35a | 6.52 ± 1.43ab | 6.10 ± 1.82abc | 6.42 ± 1.81ab | 5.92 ± 1.89bc | |
| Taste | 4.90 ± 1.84b | 5.12 ± 1.80b | 5.70 ± 1.90ab | 5.32 ± 1.90b | 5.74 ± 1.96ab | 6.22 ± 2.10a | 5.42 ± 2.21ab | |
| Texture | 6.12 ± 1.45a | 5.92 ± 1.48a | 6.52 ± 1.40a | 6.12 ± 1.41a | 6.40 ± 1.47a | 6.58 ± 1.58a | 6.28 ± 1.51a | |
| Overall | 5.84 ± 1.24bc | 5.68 ± 1.33c | 6.60 ± 1.66a | 5.96 ± 1.60bc | 6.40 ± 1.20ab | 6.96 ± 1.48a | 5.84 ± 1.68bc | |
Note: Fifty panelists assessed the sensory attributes using a 9-point hedonic scale, where 1 represented “dislike extremely” and 9 represented “like extremely.” Results are reported as mean ± SD. Means assigned different superscript letters (a–d) within the same sensory attribute are significantly different (p ≤ 0.05).
Discussion
Water Activity (aw)
The changes in water activity (aw) of the turmeric samples and pickling solutions during 28 days of storage are presented in Table 2A. This reduction can be attributed to osmotic dehydration during blanching in a solution containing 2% NaCl and 0.5% CaCl₂, where water diffused out of the tissue while solutes penetrated the turmeric matrix.25-26 The higher aw observed in T2 may be due to the lower concentration of solutes (1:6 ratio of dried Garcinia atroviridis to water), particularly weak acids resulting in a reduced osmotic driving force compared to other treatments. In contrast, the aw of the pickling solutions exhibited a different trend. which showed an increase after the first day (rising from 0.992, 0.983, and 0.986 to 0.993, 0.990, and 0.991 for the control, T1, and T2, respectively). This shift suggests a migration of moisture from the turmeric tissues into the liquid medium. Such a movement is driven by osmotic pressure, where water naturally diffuses from the higher water potential within the turmeric cells toward the lower potential of the surrounding pickling solution.25-27 During storage up to 28 days, the aw values of the turmeric samples underwent minor fluctuations before reaching a steady state. This trend indicates that the turmeric tissue and the pickling solution eventually reached an equilibrium. Notably, the T2 group maintained higher aw levels compared to other treatments across the entire observation period, a finding likely linked to its reduced solute concentration and a subsequently less intense osmotic pull. These observations underscore the significant impact of blanching and pickling on the water activity of turmeric. It is evident that osmotic mass transfer serves as a primary mechanism for moisture redistribution, ensuring the system stabilizes during prolonged storage.
pH
The pH changes in the turmeric samples and pickling solutions during 28 days of storage are presented in Table 2B and Fig. 2. Using mentioned blanched media did not make a huge different pH in blanched turmeric. As is known, salts derived from strong acids and strong bases generally do not undergo hydrolysis, keeping pH solution constant. Generally, pH of brining solution can be slightly lower than 7 and in this experiment was about 6.08 because of dissolution of carbon dioxide in water, forming weak carbonic acid, in addition to the effect of ionic strength on hydrogen ion activity.26,28 A slightly increased pH found in turmeric rhizome is likely due to the diffusion and leaching of organic acids from the plant tissue into the blanching solution. A rapid decrease can be explained by the diffusion of organic acids from the pickling solution into the turmeric tissue, driven by concentration gradients according to mass transfer principles.25-27 Notably, samples treated with dried Garcinia atroviridis extract exhibited lower pH values than the control. This may be attributed to the presence of hydroxycitric acid (HCA), the major organic acid in Garcinia, which has a lower pKa than acetic acid and can release more hydrogen ions into the system during pickling. In addition, acetic acid is volatile acid which easily evaporates or degrades faster compared with HCA particularly in salt treated. The pH of the pickling solutions exhibited an upward trend over the storage period. This elevation is likely a result of water migration from the turmeric tissue into the solution through osmosis, effectively diluting the acid concentration and lowering the total acidity.26 From day 4 through day 28, the pH levels in both the turmeric flesh and the solutions reached a plateau, suggesting the system had achieved a state of dynamic equilibrium where the acid mass transfer rate reaches its peak.25-26 The stability of acidity in Garcinia-based treatments can be explained by the low volatility of hydroxycitric acid (HCA) relative to acetic acid. Unlike acetic acid, which is prone to partial volatilization during storage, HCA possesses a larger molecular structure that contributes to its stability within the food matrix. This buffering capacity enabled the Garcinia atroviridis formulations, particularly T1, to maintain consistently lower pH values throughout the 28-day storage period. These results indicate that both the type and concentration of the acidifying agent are key factors influencing the final pH of pickled turmeric. Utilizing dried Garcinia extract at a 1:4 ratio (T1) proved to be a highly effective strategy for maintaining a low pH environment, a critical factor for enhancing microbial safety and ensuring the stability of the product during long-term storage.
Color
Changes in the color parameters (CIE L*, a*, and b*) of turmeric samples under different pickling conditions during storage are presented in Table 3. The L* value showed decreasing after blanching and during pickling, indicating a darker appearance of the turmeric. This change was primarily caused by moisture loss, which concentrated the curcuminoid pigments within each unit of volume.29 The constant decrease in L* this may be attributed to continued moisture loss and tissue shrinkage during the dehydration process. Additionally, T1 and T2, the use of dried garcinia which possesses natural contains brown-colored compounds likely contributed to the diffusion of these pigments into the turmeric matrix. The a* increased following the blanching process, indicating an enhancement of red–orange tones. Because of the softening of cell structures, which facilitates a broader distribution of curcuminoids, leading to higher pigment intensity per unit area. Similarly, the post-blanching increase in the b* value reflects an enhanced intensity of yellow tones. However, while the addition of 0.5% CaCl₂ can enhance cell wall integrity through pectin cross-linking,28 it cannot entirely counteract the effects of heat and osmotic pressure. Therefore, the observed changes in color parameters are the result of combined effects between moisture loss, thermal processing, acidic conditions, and mass transfer between the turmeric tissue and the pickling solution. These factors collectively lead to significant shifts in L*, a*, and b* values throughout both production and storage. Furthermore, these results may be influenced by the natural variability of the raw material itself. Because curcuminoid content and distribution vary across different sections of turmeric, the baseline color of the samples is inherently inconsistent. This natural variation means that random sampling for analysis can introduce further fluctuations in the recorded color measurements.
Proximate Analysis
The proximate composition of the turmeric samples following processing is summarized in Table 4. This increase may be attributed to the softened internal cellular structure, allowing for increased water absorption with 2% NaCl and 0.5% CaCl2. However, despite this increase in moisture content, the aw of blanched turmeric decreased. This phenomenon occurs because the salt ions within the system bind with water molecules, increasing the proportion of bound water while simultaneously reducing the amount of free water. This reduction is a result of osmosis, which drives water out of the cells, and the diffusion of the pickling solution into the turmeric. This is attributed to the concentration of the pickling solution, which directly influences water loss. 25-26 The ash content increase is due to the blanching process in 2% NaCl and 0.5% CaCl2 solutions, which allowed the solutes to diffuse into the turmeric tissue, thereby increasing the total mineral content. Although the ash content of pickled turmeric decreased compared to blanched turmeric but remained higher than the fresh turmeric, due to continuous diffusion of the solution throughout the pickling process. This apparent increase in protein content does not signify a true rise in protein quantity. It may be due to a concentration effect. During the blanching and pickling processes, the loss of other water-soluble constituents such as carbohydrates and small molecular compounds leads to a relative increase in the protein proportion per unit of dry matter. Furthermore, thermal processing may cause protein denaturation as this is merely a molecular structural change that does not result in a higher overall protein yield.28 Turmeric contains essential oils, typically ranging from 2–7% of its dry weight. Due to their volatility, these compounds are easily lost through evaporation when exposed to heat and steam during blanching. This resulted in a decrease in total fat content.28,30 The lower fat content may be attributed to the higher organic acid concentration and osmotic pressure of the pickling solution, which facilitated the extraction of lipid components from the turmeric tissue, which enhances cell shrinkage and membrane permeability, promoting the leaching of lipids and volatile compounds into the pickling solution. Carbohydrate content was calculated by difference as 100% minus the sum of protein, fat, and ash contents. Any increase or decrease in these components proportionally affects carbohydrate values rather than reflecting absolute changes in carbohydrate mass. Therefore, some researchers may prefer to do direct carbohydrate content assay such as high-performance liquid chromatography (HPLC) especially when isolated molecules are required.31 The observed decrease in carbohydrate content in processed samples may be associated with the leaching of water-soluble sugars during blanching and pickling. In general, the blanching and pickling processes significantly affected the proximate composition through mechanisms such as osmosis, diffusion, and leaching, resulting in the redistribution and loss of certain nutrients during processing.
Ascorbic Acid Content
The ascorbic acid contents of the turmeric samples during pickling are presented in Table 5. This reduction is consistent with the well-known characteristics of ascorbic acid as a water-soluble and heat-sensitive vitamin. During blanching, vitamin C can be lost through leaching into the surrounding solution and degradation via oxidation when exposed to heat and oxygen. 32 The increase in ascorbic acid content can be primarily attributed to the enhanced stability of ascorbic acid under acidic conditions, together with its increased extractability resulting from acid-induced cell wall disruption and heat treatment during the pickling process. In addition, the higher ascorbic acid content observed in T1 and T2 may also be attributed to the use of Garcinia atroviridis extract, which naturally contains organic acids, including citric acid, as well as small amounts of ascorbic acid.12,33 Therefore, the diffusion of ascorbic acid from the pickling solution into the turmeric tissue may have also occurred. Furthermore, the acidic conditions provided by garcinia extract helped enhance the stability of the ascorbic acid by slowing down oxidation, thereby reducing its loss during storage.34 As a result, T1 and T2 showed significantly higher vitamin C content than the control. However, the sample using dried garcinia extract yielded higher values than the control due to Garcinia atroviridis is abundant in organic acids and phenolic compounds with potent antioxidant properties. These substances can function as reducing agents, reacting with the titrant during the analysis and causing the reported ascorbic acid levels to exceed the actual vitamin C content. This limitation, noting that in complex food systems, the titration method is susceptible to interference from other reducing substances, often leading to an overestimation of the results.
Titratable Acidity (TA)
The changes in titratable acidity (TA) of the turmeric samples and pickling solutions during pickling and storage are shown in Table 6. Initially, both fresh and blanched turmeric exhibited very low TA values, without significant difference. Results indicated that turmeric rhizome naturally contain not high levels of organic acids, in addition blanching in a solution containing 2% NaCl and 0.5% CaCl₂ does not significantly affect acidity as its nature of balanced salt.28 An increase of TA over time can be explained by mass transfer mechanisms, particularly the diffusion of organic acids from the pickling solution into the turmeric tissue, driven by different concentration gradients between the liquid and solid phases.25-26 Among all treatments, T1 consistently provided the highest TA values of all time points. These findings suggest that the initial concentration of the pickling solution influenced the diffusion driving force, in accordance with Fick’s law, where diffusion flux is proportional to the concentration gradient.25 A greater concentration gradient between the two phases results in increased acid diffusion into the sample tissue. However, between days 14–28 of pickling, the rate of increase in TA began to decelerate due to the system reaching a state of dynamic equilibrium,27,29 where the rates of acid influx and efflux become nearly equal, leading to a stabilization of the concentration. In addition, the TA in the pickling solution decreased over time in all treatments, consistent with the mechanism diffusion of organic acids into the sample. Relationship between TA in the turmeric and pickling solution phases clearly demonstrated the mass transfer process occurring within the system. It is important to note that TA values are expressed as % equivalent acid (e.g., % as acetic acid or % as citric acid), which represents the total acidity based on titration with a standard base. However, differences in reported values depend on the equivalent weight of the reference acid used for calculation and do not indicate the presence of multiple acids simultaneously, but rather a standardized method of expressing acidity.26
Total Curcumin Content
The changes in total curcumin content during turmeric processing and pickling are presented in Table 7. This indicates that the thermal processing significantly reduces the stability of curcumin. The reduction can be connected to thermal degradation as well as physical loss following the disruption of the cellular structure.28-29 Due to curcumin is heat-sensitive and prone to degradation under high temperatures.35 Although curcumin has low water solubility, tissue fragmentation can still promote its loss as suspended matter or lead to chemical degradation. It indicated that pickling process leads to additional losses beyond those incurred during the blanching process. The decrease in total curcumin content is attributed to a combination of several factors, including the long-term degradation of curcumin under acidic conditions,7,36 oxidative reactions during storage and structural breakdown of plant tissues can result in physical losses of bioactive compounds.28-29 Furthermore, the shift in moisture content during pickling, driven by osmotic mechanisms, results in a corresponding increase in the proportion of the remaining solid components. However, while total curcumin content decreased significantly from the fresh turmeric the final products still maintained measurable amounts of curcumin. The pickling process serves as an effective preservation method, improving microbial safety while significantly prolonging shelf life.29,37 Therefore, pickling process represents a trade-off between the retention of active compounds and the enhancement of food product stability and safety.
Total Carotene, Flavonoid, and Phenolic Contents
The carotene, flavonoid, and total phenolic contents of the turmeric samples during processing and pickling are summarized in Table 7. These results indicate that thermal processing significantly impacts various groups of antioxidants, particularly carotene, which is highly sensitive to heat and oxygen. The rapid decrease in total phenolic content may be attributed to the leaching of water-soluble phenolic compounds into the pickling solution, through mass transfer mechanisms, combined with oxidation under acidic conditions. This increases because of the concentration effect from water loss, the breakdown of cell walls that helps release more substances, and the change in balance between the solid and liquid parts. Carotenoids, which are lipid-soluble and highly sensitive to heat, light, and oxidation, changed quite a bit during pickling process. A decrease in carotenoid content was observed around day 14, followed by an increase on day 28. This may not show an actual increase in the substance, but rather the physical and chemical factors related to changes in the tissue structure and the low-oxygen environment at the end of the process. Although all antioxidant compounds decreased significantly from the fresh turmeric, the pickled turmeric still retained measurable active compounds. Differences among treatments also affected how well these substances were kept. T1 was more effective in retaining carotenoids at later stages, while T2 better preserved flavonoids and total phenolic content. Overall, the pickling process resulted in an initial reduction of antioxidant compounds due to diffusion and chemical degradation, followed by partial recovery or increased extractability effects influenced by concentration changes and structural modifications of the food matrix.
DPPH and ABTS Assays
The antioxidant activities of the pickled turmeric samples, determined using the DPPH and ABTS assays, are presented in Table 8A and Table 8B, respectively. Both DPPH and ABTS assays were performed to characterize the antioxidant potential of the samples, as these methods collectively evaluate hydrogen atom transfer (HAT) and single electron transfer (SET) mechanisms is important because any reduction in hydrogen-donating capacity directly decreases antioxidant activity. In addition, DPPH radical easily to react with non or less polar compounds.38 The antioxidant reduction indicated the loss or degradation of phenolic compounds, particularly curcuminoids, due to peeling (physical removal), blanching (heating) and leaching (pickling). The initial reduction was probably associated with the leaching and diffusion of phenolic compounds into the pickling solution. Conversely, the subsequent increase could result from the release of bound phenolic compounds under acidic conditions, 35 as well as structural breakdown of plant tissues, which enhances the extractability of antioxidant compounds. On day 28, A significantly higher activity was observed in the control samples than in the T1 and T2 samples (p < 0.05), suggesting that higher osmotic pressure in Garcinia-treated samples enhanced the loss of lower polar antioxidant compounds due to more acidic leaching. In contrast, the ABTS assay showed a different result. Due to the ABTS assay based primarily on electron transfer to reduce ABTS•⁺ radicals, and its ability to measure both hydrophilic and lipophilic antioxidants as well as higher polarity obtaining from acid solutions, acetic acid and Garcinia ones. After pickling process, the ABTS increased overtime, with the highest observed on day 28. The highest value was observed in the control, followed by T1 and T2, respectively. Due to the acidic conditions and long pickling time, especially in high concentration solutions, may break down the cell walls and effect on phenolics attached to the cell structure to be released into free form. Additionally, continuous osmosis and diffusion during pickling process may help extract more active compounds, leading to higher ABTS over time. The DPPH and ABTS are related to changes in total phenolic, flavonoid, and carotene content. Phenolic and flavonoid compounds are a major role in both HAT and SET mechanisms because they have hydroxyl groups that easily provide hydrogen or electrons. The lower DPPH in pickled turmeric matches the decrease in total phenolics. This shows that leaching, diffusion, and osmosis cause some phenolic compounds to be lost from the sample. Meanwhile, the higher ABTS at the later stage may be the release of free-form substances under acidic conditions.
Microbiological Analysis
The microbiological results for the raw materials and pickled turmeric products are summarized in Table 9. High microbial count in black pepper was in accordance with the characteristics of dried spices, which are commonly contaminated with microorganisms from soil, air, and post-harvest handling. Although low moisture content can inhibit microbial growth, it does not effectively eliminate microorganisms.39-40 This reduction can be attributed to the synergistic effects of multiple preservation factors, consistent with the principles of hurdle technology, in which several preservation methods play synergistically to control microbial growth.37 First hurdle is blanching with a solution containing 2% NaCl and 0.5% CaCl2. Heat denaturation denatures microbial proteins and enzymes and destroys cell membranes, which reduces microbial load at the early stage of processing.39-40 At the same time, NaCl increases osmotic pressure, causing cells to lose water, while CaCl2 helps maintain the firmness of plant tissue.28-29 The second hurdle is the acidic condition of the pickling solution. The control used vinegar that is acetic acid, while T1 and T2 used Garcinia atroviridis, which mainly contains hydroxycitric acid (HCA) as a major organic acid. This resulted in a product pH below 4.6 classifying it as an acidified food,39 which is unsuitable for the growth of many pathogenic microorganisms, such as Salmonella spp. and Staphylococcus aureus, was inhibited. The key mechanism is that organic acids, their undissociated form, can pass through cell membranes and then dissociate inside the cell, releasing H+ ions. This lowers the internal pH and disrupts enzymatic activity and energy metabolism. 39-40 The third hurdle is osmotic pressure generated by salt and acid. It dehydrates microbial cells to cause plasmolysis, thereby inhibiting their proliferation. In addition, washing the raw materials with a 100-ppm chlorine solution prior to processing helps reduce initial microbial contamination on the surface. Results confirmed that using those mentioned processing steps aided reduce and achieve the levels of total microbial count, yeast and mold, while ensuring microbiological safety against pathogenic microorganisms, including Escherichia coli, Staphylococcus aureus, and Salmonella spp.
Sensory Evaluation
The sensory evaluation scores of fresh and pickled turmeric products on days 4 and 28 are presented in Table 10. These results indicated that both pickling time and brine formulation significantly affected consumer acceptance (p ≤ 0.05). Based on the Hedonic score classification, ratings were categorized as 1–3 (dislike), 4–5 (slightly to moderately dislike), 6–7 (moderately like to like), and ≥8 (like very much to like extremely). Generally sensory scores of all attributes were improved by pickling process particularly when 1:4 solution or T1 was applied. After pickling process, T1 consistently showed the highest acceptability at both day 4 and day 28, indicating consumer preference throughout storage. The T1 treatment (1:4 ratio) had the lowest curcumin content among the pickled turmeric treatments (Table 7). As is known, curcumin is strongly related to bitterness, astringency, and characteristic of unpleasant turmeric aroma. The reduction in curcumin may result from scrubbing, blanching, diffusion and leaching during the pickling process, leading to a milder flavor profile and improved palatability. Therefore, an inverse relationship between curcumin content and sensory acceptance was observed. His result is similar to the findings of reference,9 which were that although processing may reduce the amount of curcumin in a product, pickling enhances the overall sensory appeal of turmeric; that is, the flavor profile is improved and more agreeable to consumers, making it much easier for them to consume. According to the taste panel, fresh turmeric is traditionally consumed at 2 grams or less per serving. However, pickled turmeric is much easier to consume on a regular basis and can be eaten in larger portions of up to 5 grams or more. This may allow consumers to consume higher amounts of pickled turmeric than they do fresh turmeric, thereby offsetting the lower curcumin content depending on the curcumin content remaining in pickled turmeric. In addition to curcumin, Pickled Turmeric has other naturally occurring compounds which can be beneficial as health promoting agents such as phenolic compounds, dietary fiber, vitamins and minerals, and organic acids. The combination of these compounds may contribute to antioxidant properties and also may contribute towards digestive and gut health. Currently there is a need for further research to optimize the sensory attributes of this product, determine appropriate levels of usage for better consumer acceptability, and determine best ways to use the product functionally. In addition, the development of value-added functional products derived from turmeric is recommended to broaden its application in health-oriented food products.
Conclusion
This study focuses on the development of pickled turmeric using a solution derived from dried Garcinia (Garcinia atroviridis) as a natural agent for vinegar substitution, along with the evaluation of physical, chemical, microbiological, and sensory qualities over 28 days of pickling. The study consisted of three treatments: Control (pickled in vinegar at a 1:1 ratio), T1 (dried Garcinia solution at a 1:4 ratio), and T2 (dried Garcinia solution at a 1:6 ratio). The results showed that blanching, pickling, and pickling solutions significantly affected product quality in several aspects. Both blanching and pickling affected moisture, minerals, proteins, fats, and certain key compounds. Curcumin is the primary bioactive polyphenolic compound isolated from turmeric (Curcuma longa L.), which decreases after processing. Since curcumin contributes to the bitterness, astringency, and characteristic aroma of turmeric, its reduction resulted in higher sensory acceptability scores for pickled turmeric compared to fresh turmeric. A decrease in curcumin content, combined with the acidity from the pickling solution helped reduce bitterness, improve flavor balance, and enhance overall consumer acceptance. This also made the product easier to consume than fresh turmeric, which typically has a more pronounced bitter taste. Among the treatments, the pickled turmeric with dried Garcinia solution at a 1:4 ratio received the highest sensory acceptance scores and had the lowest pH throughout the pickling process, even though it had the lowest total curcumin content among all treatments. This shows a negative relationship between curcumin content and consumer acceptance. Furthermore, the low pH and the blanching process enhanced microbial inhibition and improved product safety. Therefore, T1 represented the most suitable condition, providing good overall quality, microbiological safety, retention of functional bioactive potential, and the highest level of consumer acceptance. These results demonstrate that pickling process is an effective way to process turmeric into a bioactive food product, indicating its potential for development into functional foods.
Acknowledgement
The authors would like to express their sincere gratitude to the Department of Food Technology, Faculty of Agro-Industry, Prince of Songkhla University, Hat Yai, Songkhla 90112, Thailand, for providing laboratory facilities, equipment, and partial financial support for this research.
Funding Sources
This research received financial support from Prince of Songkhla University, Thailand. No grant number was assigned.
Conflict of Interest
The author(s) declare no conflicts of interest.
Data Availability Statement
The data supporting the findings of this study are available from the corresponding author upon reasonable request.
Ethics Statement
This study did not involve human participants, animal subjects, or any procedures requiring ethical approval. All materials used were edible food ingredients commonly consumed in daily life.
Informed Consent Statement
Human participants were already informed and accepted for sensory test as their regular food
Clinical Trial Registration
This study did not involve any clinical trials; therefore, registration is not applicable.
Permission to Reproduce Material from Other Sources
Not applicable.
Author Contributions
- Phitchanan Thongreuk: Conceptualization, Methodology, Data Collection, Analysis, writing – Original Draft, writing – Reviewing and Editing
- Sunisa Siripongvutikorn: Conceptualization, Supervision, writing – Reviewing and Editing.
- Worapinit Chansuwan: Conceptualization and Supervision.
- Worapong Usawakesmanee: Conceptualization and Supervision
References
- Behera SS, El Sheikha AF, Hammami R, et al. Traditionally fermented pickles: how the microbial diversity associated with their nutritional and health benefits? J Funct Foods. 2020;70:103971. doi:10.1016/j.jff.2020.103971
CrossRef - Chandel M, Sharma N. Studies on traditional Indian turmeric pickle as probiotic pickle for therapeutic uses in view of COVID-19 pandemic. Indian J Tradit Knowl. 2020;19:143-152.
CrossRef - Gupta SC, Patchva S, Koh W, et al. Discovery of curcumin, a component of golden spice, and its miraculous biological activities. Clin Exp Pharmacol Physiol. 2012;39(3):283-299. doi:10.1111/j.1440-1681.2011.05648.x
CrossRef - Prasad S, Aggarwal BB. Turmeric, the golden spice: from traditional medicine to modern medicine. In: Benzie IFF, Wachtel-Galor S, eds. Herbal Medicine: Biomolecular and Clinical Aspects. 2nd ed. CRC Press/Taylor & Francis; 2011. Chapter 13.
CrossRef - Aggarwal BB, Sundaram C, Malani N, et al. Curcumin: the Indian solid gold. In: Aggarwal BB, Surh YJ, Shishodia S, eds. The Molecular Targets and Therapeutic Uses of Curcumin in Health and Disease. Vol 595. Springer; 2007:1-75. doi:10.1007/978-0-387-46401-5_1
CrossRef - Hewlings SJ, Kalman DS. Curcumin: a review of its effects on human health. Foods. 2017;6(10):92. doi:10.3390/foods6100092
CrossRef - Anand P, Kunnumakkara AB, Newman RA, et al. Bioavailability of curcumin: problems and promises. Mol Pharm. 2007;4(6):807-818. doi:10.1021/mp700113r
CrossRef - Li S, Yuan W, Deng G, et al. Chemical composition and product quality control of turmeric (Curcuma longa L.). Pharm Crops. 2011;2:28-54.
CrossRef - Choudhary M, Banjara NC, Rajput BS, et al. Sensory evaluation of rhizome turmeric pickles. Pharma Innov J. 2024;13(6):29-31.
- Ramyasri S, Kanneshwari P. Development and formulation of turmeric tuber pickle. Int J Creat Res Thoughts. 2022;10(11):750-754.
- Hayamizu K, Ishii Y, Kaneko I, et al. Effects of Garcinia cambogia (hydroxycitric acid) on visceral fat accumulation: a double-blind, randomized, placebo-controlled trial. Curr Ther Res Clin Exp. 2003;64(8):551-567. doi:10.1016/j.curtheres.2003.08.006
CrossRef - Mackeen MM, Ali AM, Lajis NH, et al. Antimicrobial, antioxidant, antitumour-promoting and cytotoxic activities of different plant part extracts of Garcinia atroviridis Griff. ex T. Anders. J Ethnopharmacol. 2000;72(3):395-402. doi:10.1016/S0378-8741(00)00245-2
CrossRef - Horwitz W, ed. Official Methods of Analysis of AOAC International. 17th ed. AOAC International; 2000. Official Methods 930.04 (moisture in plants), 930.05 (ash of plants), and 942.15 (titratable acidity of fruit products).
- Cunniff P, ed. Official Methods of Analysis of AOAC International. 16th ed. AOAC International; 1995. Official Method 967.21 (ascorbic acid by 2,6-dichloroindophenol titration).
- Sasidharan S, Chen Y, Saravanan D, et al. Extraction, isolation and characterization of bioactive compounds from plant extracts. Afr J Tradit Complement Altern Med. 2011;8(1):1-10.
CrossRef - Kumar D, Bhat ZA. UV-visible spectrophotometric estimation of curcumin in nanoformulation. Int J Pharmacogn. 2015;2(3):127-130. doi:10.13040/IJPSR.0975-8232.IJP.2(3).127-30
CrossRef - Moulick SP, Jahan F, Islam MB, et al. Nutritional characteristics and antiradical activity of turmeric (Curcuma longa L.), beetroot (Beta vulgaris L.), and carrot (Daucus carota L.) grown in Bangladesh. Heliyon. 2023;9(11):e21495. doi:10.1016/j.heliyon.2023.e21495
CrossRef - Tournas V, Stack ME, Mislivec PB, et al. Yeasts, molds, and mycotoxins. In: Bacteriological Analytical Manual. Chapter 18. April 2001 ed. US Food and Drug Administration; 2001. https://www.fda.gov/food/laboratory-methods-food/bam-chapter-18-yeasts-molds-and-mycotoxins
- Tallent S, Hait J, Bennett RW, et al. Staphylococcus aureus. In: Bacteriological Analytical Manual. Chapter 12. March 2016 ed. US Food and Drug Administration; 2016. https://www.fda.gov/food/laboratory-methods-food/bam-chapter-12-staphylococcus-aureus
- Feng P, Weagant SD, Grant MA, et al. Enumeration of Escherichia coli and the coliform bacteria. In: Bacteriological Analytical Manual. Chapter 4. October 2020 ed. US Food and Drug Administration; 2020. https://www.fda.gov/food/laboratory-methods-food/bam-chapter-4-enumeration-escherichia-coli-and-coliform-bacteria
- Andrews WH, Wang H, Jacobson A, et al. Salmonella. In: Bacteriological Analytical Manual. Chapter 5. May 2024 ed. US Food and Drug Administration; 2024. https://www.fda.gov/food/laboratory-methods-food/bam-chapter-5-salmonella
- Zhang G, Ferguson M, Blodgett RJ. Aerobic plate count. In: Bacteriological Analytical Manual. Chapter 3. May 2025 ed. US Food and Drug Administration; 2025. https://www.fda.gov/food/laboratory-methods-food/bam-chapter-3-aerobic-plate-count
- Boone DR, Castenholz RW, Garrity GM, eds. Bergey’s Manual of Systematic Bacteriology. 2nd ed. Springer; 2001-2012.
CrossRef - Department of Medical Sciences, Ministry of Public Health. Compendium of Methods for Food Analysis. Department of Medical Sciences; 2017.
- Crank J. The Mathematics of Diffusion. 2nd ed. Oxford University Press; 1975.
- Singh RP, Heldman DR. Introduction to Food Engineering. 5th ed. Academic Press; 2014.
CrossRef - Medved I, Černý R. Osmosis in porous media: a review of recent studies. Microporous Mesoporous Mater. 2013;170:299-317. doi:10.1016/j.micromeso.2012.12.009
CrossRef - Damodaran S, Parkin KL, eds. Fennema’s Food Chemistry. 5th ed. CRC Press; 2017.
- Fellows PJ. Food Processing Technology: Principles and Practice. 4th ed. Woodhead Publishing; 2017.
- Ramaswamy HS, Marcotte M. Food Processing: Principles and Applications. CRC Press; 2006.
CrossRef - Nielsen SS, ed. Food Analysis. 5th ed. Springer; 2017. doi:10.1007/978-3-319-45776-5
CrossRef - Lee SK, Kader AA. Preharvest and postharvest factors influencing vitamin C content of horticultural crops. Postharvest Biol Technol. 2000;20(3):207-220. doi:10.1016/S0925-5214(00)00133-2
CrossRef - Meeboon A. Physical, Chemical Properties and Antioxidant Activities of Garcinia pedunculata and Garcinia atroviridis Fruits [master’s thesis]. Prince of Songkla University; 2018.
- Wagner BA, Buettner GR. Stability of aqueous solutions of ascorbate for basic research and for intravenous administration. Adv Redox Res. 2023;9:100077. doi:10.1016/j.arres.2023.100077
CrossRef - Xu BJ, Chang SKC, Liu X. Effects of processing and storage on phenolic compounds and antioxidant activities of foods. Crit Rev Food Sci Nutr. 2017;57(14):3085-3101. doi:10.1080/10408398.2015.1020359
CrossRef - Kharat M, Du Z, Zhang G, et al. Physical and chemical stability of curcumin in aqueous solutions and emulsions: impact of pH, temperature, and molecular environment. J Agric Food Chem. 2017;65(7):1525-1532. doi:10.1021/acs.jafc.6b04815
CrossRef - Rahman MS, ed. Handbook of Food Preservation. 2nd ed. CRC Press; 2007.
CrossRef - Rumpf J, Burger R, Schulze M. Statistical evaluation of DPPH, ABTS, FRAP, and Folin-Ciocalteu assays to assess the antioxidant capacity of lignins. Int J Biol Macromol. 2023;233:123470. doi:10.1016/j.ijbiomac.2023.123470
CrossRef - Jay JM, Loessner MJ, Golden DA. Modern Food Microbiology. 7th ed. Springer; 2005.
- Ray B, Bhunia A. Fundamental Food Microbiology. 5th ed. CRC Press; 2014.
CrossRef

Accepted on: 08 Oct 2026
Second Review by: Aamena Zaidi
Final Approval by: Dr. Rajesh Jeewon





Web of Science Coverage
Emerging Sources Citation Index (ESCI)
2024 Journal Impact Factor: 1.1
Scopus Journal Metrics
CiteScore 2025: 2.6
CiteScore Details
Sustainable Nutrition: Food Systems, Nutrient Retention, and Public Health Impact

This journal is a member of, and subscribes to the principles of, the Committee on Publication Ethics (COPE)