
Optimization of Alcalase Hydrolysis to Enhance Degree of Hydrolysis and Protein Solubility in Yellowfin Tuna (Thunnus albacares) Viscera
 , Musiige Denis1, Derrick Kakooza1 and Hung Duc Pham2
 1Faculty of Food Technology, School of Fisheries and Life Sciences, Nha Trang University, Khanh Hoa Province, Vietnam
2Faculty of Aquaculture, School of Fisheries and Life Sciences, Nha Trang University, Khanh Hoa Province, Vietnam
Corresponding Author Email: minhnv@ntu.edu.vn
Download this article as:
ABSTRACT:Enzymatic hydrolysis is an effective approach for valorizing fish processing by-products into functional protein ingredients. In the present study, yellowfin tuna (Thunnus albacares) viscera were hydrolysed using Alcalase, and the hydrolysis process was optimised through response surface methodology (RSM). The influences of reaction time (2-12 h), temperature (47-64 °C), and enzyme concentration (0.3-1.2%, v/w) on degree of hydrolysis (DH) and protein solubility were investigated using a central composite design. Statistical analysis indicated that all three processing variables significantly affected the responses (p<0.05), although reaction time and enzyme concentration contributed more strongly than temperature. The developed quadratic models adequately described the experimental data, yielding coefficients of determination of R² = 0.97 and R² = 0.95 for DH and solubility, respectively. The optimum hydrolysis conditions for achieving maximum DH (66%) and solubility (28%) were 6.7 h, 53.4 °C, and 0.88% Alcalase. These findings demonstrate that yellowfin tuna viscera can be efficiently converted into protein hydrolysates and provide a basis for their further evaluation as alternative protein ingredients for animal feed applications.
KEYWORDS:Alcalase; Enzymatic hydrolysis; Fish protein hydrolysate; Response surface methodology; Yellowfin tuna viscera
Introduction
Fish Protein Hydrolysates (FPHs) are generated through the controlled breakdown of proteins into small peptides (2-20 amino acids) and free amino acids by either chemical hydrolysis, fermentation, or enzymatic hydrolysis from fish or fish by-products.1 These hydrolysates possess various functional properties, including foaming and emulsifying capabilities, and bioactivities such as antioxidant and antibacterial functions, making them suitable for food and animal feed applications.2,3 Although chemical hydrolysis is relatively inexpensive, it has several drawbacks, including the formation of toxic or undesirable compounds, partial degradation of amino acids, reduced functional properties due to salt formation, and limited control over reaction conditions. These limitations make enzymatic hydrolysis a more suitable and preferred method for producing high-quality protein hydrolysates.4 Several commercial proteases, including Chymotrypsin, Trypsin, Alcalase,5 Papain,6 Bromelain,7 Flavourzyme,8 and Neutrase,9 have been successfully applied in the enzymatic hydrolysis of fish proteins. Each enzyme provides unique hydrolysis characteristics depending on substrate type and intended use. Alcalase, an endoproteinase derived from Bacillus licheniformis, is widely used for hydrolyzing fish by-products because it achieves high degrees of hydrolysis under moderate conditions, making it more efficient than many neutral or acidic enzymes.10
The global tuna catch has remained relatively stable at approximately 5 million tonnes annually since 2019, reaching about 5.2 million tonnes in 2023. Yellowfin tuna (Thunnus albacares), one of the most commercially important tuna species, accounts for nearly 31% of global tuna landings.11 The expansion of tuna processing industries has generated substantial quantities of by-products, including heads, skin, bones, and viscera, which remain underutilized or discarded, creating both economic losses and environmental concerns.12 Among these by-products, viscera represent a considerable fraction of processing waste and contain significant amounts of recoverable proteins and other valuable compounds. Despite the substantial quantities of viscera generated during tuna processing, the enzymatic conversion of yellowfin tuna (Thunnus albacares) viscera into protein hydrolysates has not been extensively investigated. Furthermore, owing to their high endogenous enzymatic activity and rapid susceptibility to spoilage, tuna viscera are frequently discarded or utilized for low-value purposes. Therefore, improved utilization of tuna by-products represents a practical approach to recovering additional value from tuna resources while minimizing waste generation and contributing to more sustainable seafood processing practices.
Valorization of tuna viscera into high-value ingredients such as FPHs can generate functional compounds suitable for animal feed, food, and pharmaceutical applications.13 Because hydrolysis performance is influenced by multiple processing variables that may interact with one another, systematic optimization is required to identify suitable operating conditions. Response surface methodology (RSM) has been widely applied for this purpose because it enables the evaluation of both individual and interactive effects of process variables while reducing the number of experimental runs required. As a result, RSM provides an efficient and reliable approach for modelling and optimising enzymatic hydrolysis processes. The central composite design (CCD) is one of the most frequently used experimental designs in response surface methodology because it can efficiently describe curvature effects and interactions among variables with a manageable number of experimental runs.14
Several studies have demonstrated the usefulness of response surface methodology (RSM) for optimizing enzymatic hydrolysis of fish-processing by-products. Optimization of hydrolysis conditions using RSM has been reported for tuna dark muscle by-product,9 for Persian sturgeon (Acipenser persicus) viscera,10 yellowfin tuna (Thunnus albacares) heads,15 and for visceral waste proteins of catla (Catla catla).16 Although previous studies have optimized enzymatic hydrolysis of tuna heads, dark muscle, and other fish-processing by-products, information on the simultaneous optimization of Alcalase hydrolysis of yellowfin tuna viscera using both degree of hydrolysis and protein solubility as response variables remains scarce. Addressing this knowledge gap is important for establishing suitable processing conditions and maximizing the utilization of tuna viscera as a source of value-added protein ingredients.
This work investigated the production of protein hydrolysates from yellowfin tuna viscera through Alcalase-assisted hydrolysis. Particular emphasis was placed on determining the combined effects of hydrolysing temperature, time, and enzyme concentration on hydrolysis efficiency and protein solubility. Response surface methodology was employed to establish predictive models and identify operating conditions that maximise the functional quality of the resulting hydrolysates (i.e. DH and solubility) with the ultimate goal of producing fish protein hydrolysates suitable for use as alternative, sustainable protein ingredients in animal feed formulations.
Materials and Methods
Sample Collection and Preparation
Fresh yellowfin tuna viscera were supplied by Hong Ngoc Seafood Company, located in Hoa Hiep Industrial Zone, Hoa Hiep Commune, Dak Lak Province, Vietnam. The collected materials were maintained under frozen conditions during transportation to Nha Trang University. Upon arrival, the samples were thawed under controlled conditions, mechanically minced, vacuum-packed, and maintained at -20 ± 2 °C until use. Prior to enzymatic hydrolysis, the frozen samples were allowed to thaw at 4 ± 2 °C for approximately 12 h.
Raw Material Characterization
The proximate composition of the yellowfin tuna viscera used in this study contained 73.35 ± 0.21% moisture, 20.85 ± 0.51% protein, 4.04 ± 0.87% lipid, and 1.41 ± 0.26% ash (wet basis). The relatively high protein content indicates that tuna viscera are a suitable substrate for the production of fish protein hydrolysates.
Chemical and Reagents
Commercial Alcalase (2.4 AU/g; density 1.18 g/mL), a protease produced by Bacillus licheniformis, was obtained from Novozymes and kept under refrigerated conditions (4 ± 1 °C) until use. All Analytical-grade reagents and chemicals used throughout the study were procured from Sigma-Aldrich (Singapore).
Protein Hydrolysates Preparation
To obtain protein hydrolysates, yellowfin tuna viscera were first homogenized with 0.1 M phosphate buffer (pH 6.8) at a ratio of 1:1 (w/w) to maintain pH stability throughout the hydrolysis process. The pH of the mixture was subsequently adjusted to 8.5, the optimum pH for Alcalase activity, and the hydrolysis reaction was conducted in a water bath with continuous stirring.15 Following the designated reaction time, proteolytic activity was terminated by heat treatment at 90 °C for 15 min. The hydrolysate was subsequently cooled in ice water and clarified by centrifugation at 2,935 ´ g for 25 min at 4 °C (Heraeus Biofuge Stratos Reconditioned 75005289R, Rotor 3335, DJB Labcare Limited, UK). To minimise experimental variability, all hydrolysis experiments were performed using homogenised raw material batches, and all analytical measurements were conducted in triplicate.
Statistical Optimization of Hydrolysis Parameters
Response surface methodology (RSM) coupled with a CCD was employed to optimize the Alcalase-assisted hydrolysis process of Yellowfin tuna viscera. Three processing factors, namely hydrolysis time (t, X1, h), reaction temperature (T, X2, °C), and enzyme concentration (E, X3, %, v/w) were investigated. The performance of the hydrolysis process was evaluated using degree of hydrolysis (DH) and protein solubility as the response variables. The experimental design comprised factorial combinations, axial points, and replicated centre points, allowing the assessment of linear, quadratic, and interaction effects among the selected factors. Six centre-point replicates were incorporated to provide an estimate of experimental error and to assess the adequacy and reproducibility of the developed regression models. The operating ranges of the variables were established based on preliminary experiments and information reported in previous studies (Table 1).
Table 1: Experimental ranges and coded levels of the process variables applied in the central composite design (CCD) for optimization of Alcalase-assisted hydrolysis of yellowfin tuna (Thunnus albacares) viscera proteins
|
Factors |
Unit | Symbol | Code | Range and levels | ||||
| -a | -1 | 0 | 1 |
a |
||||
|
Hydrolysis time |
h | t | X1 | 2 | 4 | 7 | 10 | 12 |
| Temperature | °C | T | X2 | 47 | 50 | 55 | 60 |
64 |
|
Enzyme concentration |
% | E | X3 | 0.3 | 0.5 | 0.75 | 1.0 |
1.2 |
Experimental results were subsequently analysed using a second-order polynomial model to evaluate the effects of process variables and identify the optimum hydrolysis conditions.
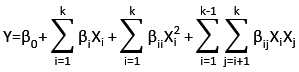
In this equation, k denotes the total number of experimental factors, whereas Xi and Xj are the coded process parameters. The predicted response (Y) corresponds to DH(%) or protein solubility (%). The estimated coefficients b0, bi, bii and bij quantify the contributions of the constant, linear, quadratic, and interaction components of the regression model.
Proximate Composition Determinations
Proximate analysis was performed to characterize the chemical composition of the raw material and hydrolysates. Moisture, protein, lipid, and ash contents were determined using recognized standard methods.17 Crude protein content was calculated from the nitrogen content determined by the Kjeldahl method using a nitrogen-to-protein conversion factor of 6.25. Lipids were measured as given in the protocol.18 All measurements were repeated three times to ensure analytical reliability.
Assessment of Degree of Hydrolysis (DH)
DH was used to evaluate the extent of protein breakdown during enzymatic hydrolysis and was calculated as the proportion of hydrolysed peptide bonds (htot) to the total peptide bonds available in the substrate (hi), as shown in the equation given below:
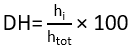
The progression of protein hydrolysis was assessed through the determination of free α-amino groups liberated during enzymatic cleavage of peptide bonds. Quantification was performed using the DNFB assay, in which amino groups react with dinitrofluorobenzene (DNFB) to produce chromogenic compounds.19 The absorbance of the reaction mixture was subsequently recorded at 410 nm and used for DH calculation.
Protein Solubility Measurement
The solubility of protein hydrolysates was determined according to a previously reported method.20 Following centrifugation (7,513 ´ g, 10 min), the supernatant fraction was collected and analysed for soluble protein content by the Biuret assay. Protein solubility was then expressed as the percentage of protein remaining in the soluble phase relative to the total protein content of the hydrolysate and calculated using the equation below:

Data Analysis
All determinations were conducted in triplicate, and and the results are reported as the mean ± standard deviation (SD). Experimental data were statistically analysed using Minitab 16 software. Response surface modelling, prediction of optimal conditions, and graphical representation of response surfaces were performed using JMP 15 (SAS Institute Inc., Cary, NC, USA). Differences were considered statistically significant at p<0.05.
Results
Optimization of Hydrolysis Conditions
The experimental results generated from the CCD matrix are shown in Table 2. DH values ranged from 38.30% to 66.70%, while protein solubility varied between 19.58% and 28.07%. The relatively high DH values observed in the present study are consistent with previous reports on Alcalase-mediated hydrolysis of fish-derived substrate.16
Table 2: CCD matrix and response data for optimization of yellowfin tuna viscera hydrolysis
|
Run No. |
Coded level of variables | Actual values of variables | Responses | |||||||
| X1 | X2 | X3 | X1 | X2 | X3 | %DH
observed |
%DH
predicted |
%Solubility
observed |
%Solubility predicted |
|
|
1 |
-1 | -1 | -1 | 4 | 50 | 0.5 | 48.26 | 50.38 | 23.83 | 23.81 |
| 2 | 1 | -1 | -1 | 10 | 50 | 0.5 | 57.73 | 53.40 | 22.24 |
27.07 |
|
3 |
-1 | 1 | -1 | 4 | 60 | 0.5 | 38.30 | 37.70 | 22.67 | 22.45 |
| 4 | 1 | 1 | -1 | 10 | 60 | 0.5 | 47.52 | 45.09 | 20.95 |
25.70 |
|
5 |
-1 | -1 | 1 | 4 | 50 | 1.0 | 55.26 | 57.29 | 26.16 | 21.72 |
| 6 | 1 | -1 | 1 | 10 | 50 | 1.0 | 64.48 | 64.10 | 22.07 |
22.44 |
|
7 |
-1 | 1 | 1 | 4 | 60 | 1.0 | 45.63 | 48.40 | 25.03 | 20.19 |
| 8 | 1 | 1 | 1 | 10 | 60 | 1.0 | 62.67 | 59.58 | 20.75 |
20.91 |
|
9 |
-1.68 | 0 | 0 | 2 | 55 | 0.75 | 40.36 | 40.41 | 26.61 | 25.88 |
| 10 | 1.68 | 0 | 0 | 12 | 55 | 0.75 | 57.07 | 58.40 | 19.58 |
20.10 |
|
11 |
0 | -1.68 | 0 | 7 | 47 | 0.75 | 56.25 | 56.11 | 25.02 | 24.65 |
| 12 | 0 | 1.68 | 0 | 7 | 64 | 0.75 | 40.13 | 41.65 | 22.06 |
22.22 |
|
13 |
0 | 0 | -1.68 | 7 | 55 | 0.3 | 55.55 | 53.91 | 20.74 | 21.71 |
| 14 | 0 | 0 | 1.68 | 7 | 55 | 1.2 | 62.84 | 65.86 | 26.24 |
25.06 |
|
15 |
0 | 0 | 0 | 7 | 55 | 0.75 | 65.80 | 64.79 | 26.88 | 27.13 |
| 16 | 0 | 0 | 0 | 7 | 55 | 0.75 | 64.98 | 64.79 | 27.70 |
27.13 |
|
17 |
0 | 0 | 0 | 7 | 55 | 0.75 | 66.74 | 64.79 | 27.07 | 27.13 |
| 18 | 0 | 0 | 0 | 7 | 55 | 0.75 | 65.14 | 64.79 | 26.52 |
27.13 |
|
19 |
0 | 0 | 0 | 7 | 55 | 0.75 | 62.84 | 64.79 | 28.07 | 27.13 |
| 20 | 0 | 0 | 0 | 7 | 55 | 0.75 | 63.50 | 64.79 | 26.52 |
27.13 |
X₁, X₂ and X₃ are coded values corresponding to hydrolysis time, temperature and enzyme concentration, respectively. Levels −1, 0 and +1 represent factorial and centre points, whereas ±1.68 represent axial points of the CCD.
Regression Model and Parameter Significance
The DH values obtained from enzymatic hydrolysis were best described by the following equations based on coded variables:

Regression coefficients are shown in Table 3. Linear and quadratic terms significantly affected the responses (p<0.05), whereas interaction terms were not significant. Hydrolysis time had the strongest influence on DH (b1=5.35), followed by enzyme concentration (b3=3.55). For protein solubility, enzyme concentration was the most influential factor (b3=0.99).
Table 3: Estimated regression coefficients and significance levels for DH and protein solubility models
|
Term |
DH | Protein solubility | ||||
| Estimate | t- value | P – value | Estimate | t-value |
P-value |
|
|
Intercept |
64.7938 | 74.4 | <.0001 | 27.13264 | 76.03 | <.0001 |
|
Time |
5.349164 | 9.26 | <.0001 | -1.72097 | -7.27 | <.0001 |
| Temperature | -4.29971 | -7.44 | <.0001 | -0.72331 | -3.06 |
0.0121 |
|
Enzyme |
3.550618 | 6.15 | 0.0001 | 0.99363 | 4.2 | 0.0018 |
| Time*Temperature | 0.94625 | 1.25 | 0.2386 | -0.04 | -0.13 |
0.8997 |
|
Time*Enzyme |
0.94625 | 1.25 | 0.2386 | -0.6325 | -2.04 | 0.0681 |
| Temperature*Enzyme | 1.09125 | 1.45 | 0.1789 | -4.44E-16 | 0 |
1.0000 |
|
Time*Time |
-5.44032 | -9.67 | <.0001 | -1.46443 | -6.35 | <.0001 |
| Temperature*Temperature | -5.62594 | -10 | <.0001 | -1.3071 | -5.67 |
0.0002 |
|
Enzyme*Enzyme |
-1.73508 | -3.08 | 0.0115 | -1.32478 | -5.75 |
0.0002 |
Model Adequacy and ANOVA
ANOVA results (Table 4) showed the developed models were highly significant (p<0.0001), with strong determination coefficients of R2 = 0.97 and R2 = 0.95 for DH and protein solubility, respectively. The high R2 values, together with the non-significant lack-of-fit tests (p = 0.1043 for DH and p = 0.1421 for protein solubility) indicate the models adequately described the experimental data and can be reliably used to predict hydrolysis performance within the investigated experimental region. This observation was further supported by the strong agreement between the observed and predicted values for DH and protein solubility shown in Figure 1A and 1B, respectively.
Table 4: Analysis of variance (ANOVA) for the fitted response surface models of DH and protein solubility
|
Source |
D.f | DH | Protein solubility | ||||||
| Sum of squares | Mean square | F-Value | P – value | Sum of squares | Mean square | F – Value |
P – value |
||
|
Model |
9 | 1650.20 | 183.36 | 40.22 | 0.0001 | 131.78 | 14.64 | 19.13 |
0.0001 |
|
Residual |
10 | 45.59 | 4.56 | 7.66 | 0.76 | ||||
| Lack of fit | 5 | 35.16 | 7.03 | 3.37 | 0.1043 | 5.64 | 1.13 | 2.79 |
0.1421 |
|
Pure error |
5 | 10.44 | 2.09 | 2.02 | 0.40 | ||||
| R2 | 0.97 |
0.95 |
|||||||
|
Total |
19 | 1695.79 | 139.44 |
|
|||||
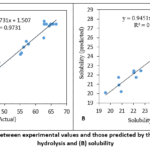 |
Figure 1: Relationship between experimental values and those predicted by the models: (A) degree of hydrolysis and (B) solubility. |
The response surface models (Figures 2) revealed that both values of DH and protein solubility for viscera tended to increase as enzyme concentration and hydrolysis time increased within the studied range. According to the model predictions, the highest DH (approximately 68%) was achieved at 53.8 °C using 1.0% Alcalase for 8.7 h. In contrast, the optimum conditions for protein solubility differed slightly, with a maximum predicted value of approximately 28% obtained at 53.7 °C, an enzyme concentration of 0.89%, and a hydrolysis time of 4.9 h. Response surface plots showed DH and solubility increased with longer hydrolysis time, higher enzyme concentrations, and moderate temperatures. Beyond optimal points, further increases in processing severity resulted in reduced DH and protein solubility.
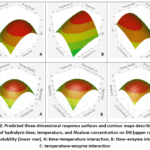 |
Figure 2: Predicted three-dimensional response surfaces and contour maps describing the effects of hydrolysis time, temperature, and Alcalase concentration on DH (upper row) and protein solubility (lower row). |
Optimal Conditions for DH and Protein Solubility
The optimization profile presented in Figure 3 illustrates the combined influence of the selected process variables on degree of hydrolysis and protein solubility. Maximum response values were predicted at approximately 53.4 °C, 6.7 h of hydrolysis, and an Alcalase concentration of 0.88%, resulting in DH and solubility values of about 66% and 28%, respectively. These conditions were selected as the optimum operating parameters for simultaneous maximization of both responses.
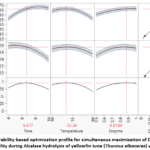 |
Figure 3: Desirability-based optimization profile for simultaneous maximization of DH and protein solubility during Alcalase hydrolysis of yellowfin tuna (Thunnus albacares) viscera. |
Discussion
The increase in degree of hydrolysis (DH) observed during Alcalase treatment can be attributed to the rapid cleavage of readily accessible peptide bonds, resulting in the formation of shorter peptide chains.20,21 As hydrolysis progressed, DH increased with increasing enzyme concentration, hydrolysis time, and temperature within the investigated range (Figure 2). Similar trends have been reported for enzymatic hydrolysis of fish proteins, where greater enzyme availability and prolonged reaction time enhance proteolytic activity and peptide bond cleavage. The same observations have been reported for enzymatic hydrolysis of different fish processing by-products. Ovissipour et al.10 reported that increasing hydrolysis time and temperature significantly enhanced DH in Persian sturgeon viscera hydrolysates, while Bhaskar et al.16 observed similar responses during the Alcalase-assisted hydrolysis of catla visceral proteins. Likewise, Denis et al.15 found that extending hydrolysis time and increasing Alcalase concentration promoted protein degradation in yellowfin tuna heads. These findings collectively indicate that extending the hydrolysis period and providing sufficient enzyme availability can substantially improve the extent of protein hydrolysis and enhance process efficiency.
Protein solubility is an important functional property of protein hydrolysates because it strongly influences their potential applications in food systems, particularly their emulsifying and foaming capacities.22 The response surface analysis demonstrated that protein solubility increased with increasing enzyme concentration, hydrolysis time, and temperature up to the optimum conditions (Figure 2). This improvement can be attributed to the progressive breakdown of proteins into smaller peptides and the exposure of ionizable amino and carboxyl groups, which enhance hydrophilicity and protein-water interactions.23 Furthermore, enzymatic hydrolysis generates low-molecular-weight peptides containing polar and charged residues that facilitate hydrogen-bond formation with water molecules, thereby increasing solubility.24 Protein solubility increased progressively with increasing hydrolysis intensity, indicating that enzymatic treatment altered the structural characteristics of the native proteins. Comparable responses have been reported for a range of fish protein hydrolysates, where the generation of shorter peptide chains and the exposure of polar amino acid residues contributed to improved water solubility.19,25,26 The results obtained in the present study support these observations and suggest that the enhanced solubility of tuna viscera hydrolysates was primarily associated with the formation of low-molecular-weight peptides possessing greater hydrophilic character.
Beyond the optimum hydrolysis conditions, both DH and protein solubility tended to plateau or decline slightly. This phenomenon may be associated with substrate depletion, accumulation of hydrolysis products, and partial inactivation of Alcalase at elevated temperatures or prolonged reaction times.1,25,26 Reduced enzymatic activities under these conditions limits further peptide bond cleavage and consequently restricts additional increases in DH and solubility. Similar reductions in nitrogen solubilization at excessive enzyme concentrations and extended hydrolysis periods have been reported previously.27,28
The optimum hydrolysis temperature (53.4 °C) identified in this study was generally consistent with those reported for other fish-processing by-products hydrolysed using Alcalase. Similar temperatures have been reported for Persian sturgeon viscera (55 °C),10 yellowfin tuna heads (55 °C),15 and visceral waste proteins of Catla (50 °C),16 indicating that temperatures within the range of 50-55 °C are favourable for achieving effective hydrolysis with Alcalase. In contrast, the optimum hydrolysis time (6.7 h) and Alcalase concentration (0.88%) determined in the present study differed from those reported for Persian sturgeon viscera (205 min and Alcalase to substrate ratio of 0.1 AU/g viscera),10 and Catla visceral proteins (135 min and 1.5% Alcalase).16 The variations are likely associated with differences in substrate composition, protein structure, and endogenous enzyme activity among materials. These findings highlight the importance of substrate-specific optimisation when establishing hydrolysis conditions for different fish processing by-products.
Overall, the results indicate that hydrolysis time and enzyme concentration were the most influential factors affecting hydrolysate production from yellowfin tuna viscera. Increasing enzyme concentration in combination with moderate temperatures enhanced protein solubilization, whereas extended hydrolysis time contributed more substantially to the increase in DH. These findings provide useful information for optimizing the production of value-added protein hydrolysates from tuna-processing by-products.
Conclusion
The present investigation demonstrated that yellowfin tuna viscera can serve as an effective raw material for the production of protein hydrolysates via Alcalase hydrolysis. Statistical optimisation revealed that reaction time and enzyme concentration exerted the greatest influence on both degree of hydrolysis and protein solubility, whereas temperature showed a comparatively lower but still significant contribution. The developed response surface models provided reliable predictions within the studied experimental domain and successfully identified optimum processing conditions.
Under the optimized conditions, tuna viscera were efficiently converted into protein hydrolysates with high degrees of hydrolysis and solubility, characteristics that are suitable for further evaluation in animal feed applications. The use of enzymatic hydrolysis enables the production of protein ingredients with potential nutritional value while simultaneously contributing to the valorization of tuna processing by-products. Overall, this work highlights the potential of yellowfin tuna viscera as a promising protein resource for future animal feed applications, supporting circular economy approaches within the seafood processing industry. The efficient conversion of tuna viscera into protein hydrolysates demonstrated in this study highlights the potential for improving the utilization of fish-processing by-products. Further investigations should address downstream processing requirements, including concentration, drying, and storage stability, to facilitate practical application. A limitation of the present study is that characterization of peptide composition, molecular weight distribution, bioactivity, and nutritional performance was not undertaken.
Acknowledgement
We would like to acknowledge and thank everyone who has supported and helped us throughout the research work. The authors would like to gratefully acknowledge Hong Ngoc Seafood Company for providing the raw materials used in this study.
Funding Sources
This research was funded by the Ministry of Education and Training of Vietnam (MOET), grant number B2024-TSN-17.
Conflicts of Interest
The author(s) do not have any conflict of interest.
Data Availability Statement
This statement does not apply to this article.
Ethics Statement
This research did not involve human participants, animal subjects, or any material that requires ethical approval.
Informed Consent Statement
This study did not involve human participants, and therefore, informed consent was not required.
Clinical Trial Registration
This research does not involve any clinical trials.
Permission to Reproduce Material from Other Sources
Not Applicable
Author Contributions
- Minh Van Nguyen: Conceptualization, Supervision, Data Analysis, Writing – Reviewing and Editing.
- Musiige Denis: Data Collection, Writing – Original Draft.
- Derrick Kakooza: Reviewing manuscript.
- Hung Duc Pham: Funding Acquisition, Resources.
References
- Noman A, Wang Y, Zhang C, Yin L, Abed SM. Antioxidant activities of optimized enzymatic protein hydrolysates from hybrid sturgeon (Huso dauricus × Acipenser schrenckii) prepared using two proteases. J Aquat Food Prod Technol. 2022;31(9):909-923. doi:10.1080/10498850.2022.2120377
CrossRef - Noman A, Xu Y, Al-Bukhaiti WQ, et al. Influence of enzymatic hydrolysis conditions on the degree of hydrolysis and functional properties of protein hydrolysate obtained from Chinese sturgeon (Acipenser sinensis) by using papain enzyme. Process Biochem. 2018; 67:19-28. doi: 10.1016/j.procbio.2018.01.009
CrossRef - Ortizo RGG, Sharma V, Tsai ML, et al. Extraction of novel bioactive peptides from fish protein hydrolysates by enzymatic reactions. Appl Sci. 2023;13(9):5768. doi:10.3390/app13095768
CrossRef - Nemati M, Shahosseini SR, Ariaii P. Review of fish protein hydrolysates: production methods, antioxidant and antimicrobial activity and nanoencapsulation. Food Sci Biotechnol. 2024;33(8):1789-1803. doi:10.1007/s10068-024-01554-8
CrossRef - Siddik MAB, Howieson J, Fotedar R, Partridge GJ. Enzymatic fish protein hydrolysates in finfish aquaculture: a review. Rev Aquac. 2021;13(1):406-430. doi:10.1111/raq.12481
CrossRef - Laishram M, Desai AS, Pathan DI, Pawase AS, Wasave SM. Functional properties and proximate analysis of fish waste protein hydrolysate processed using enzymes. Curr Res Nutr Food Sci. 2023;11(2):655-665. doi:10.12944/CRNFSJ.11.2.16
CrossRef - Nurdiani R, Firdaus M, Prihanto AA, et al. Enzymatic hydrolysis of protein hydrolysate from Pangasius by-product using bromelain. Curr Res Nutr Food Sci. 2024;12(1):125-136. doi:10.12944/CRNFSJ.12.1.10
CrossRef - Muzaifa M, Safriani N, Zakaria F. Production of protein hydrolysates from fish by-product prepared by enzymatic hydrolysis. AACL Bioflux. 2012;5(1):36-39.
- Saidi S, Belleville MP, Deratani A, Amar RB. Optimization of peptide production by enzymatic hydrolysis of tuna dark muscle by-product using commercial proteases. Afr J Biotechnol. 2013;12(13):1533-1547.
- Ovissipour M, Abedian A, Motamedzadegan A, Rasco B, Safari R, Shahiri H. The effect of enzymatic hydrolysis time and temperature on the properties of protein hydrolysates from Persian sturgeon (Acipenser persicus) viscera. Food Chem. 2009;115(1):238-242. doi: 10.1016/j.foodchem.2008.12.013
CrossRef - Food and Agriculture Organization of the United Nations. Review of the State of World Marine Fishery Resources. FAO Fisheries and Aquaculture Technical Paper No. 721. Food and Agriculture Organization of the United Nations; 2025.
- Lee HJ, Park SH, Yoon IS, et al. Chemical composition of protein concentrate prepared from yellowfin tuna (Thunnus albacares) roe by cook-dried process. Fish Aquat Sci. 2016;19(1):12. doi:10.1186/s41240-016-0012-1
CrossRef - López-Álvarez M, Souto-Montero P, Durán S, et al. Valuable Ca/P sources obtained from tuna species by-products derived from industrial processing: physicochemical features of skeleton fractions. Recycling. 2024;9(6):109. doi:10.3390/recycling9060109
CrossRef - Ghelich R, Jahannama MR, Abdizadeh H, Torknik FS, Vaezi MR. Central composite design (CCD)-response surface methodology (RSM) of effective electrospinning parameters on PVP-B-Hf hybrid nanofibrous composites for synthesis of HfB2-based composite nanofibers. Compos B Eng. 2019; 166:527-541. doi: 10.1016/j.compositesb.2019.01.094
CrossRef - Denis M, Pham HD, Nguyen MV. Optimisation of hydrolysis conditions for yellowfin tuna (Thunnus albacares) heads using Alcalase enzyme. IOP Conf Ser Earth Environ Sci. 2023;1155(1):012019. doi:10.1088/1755-1315/1155/1/012019
CrossRef - Bhaskar N, Benila T, Radha C, Lalitha RG. Optimization of enzymatic hydrolysis of visceral waste proteins of catla (Catla catla) for preparing protein hydrolysate using a commercial protease. Bioresour Technol. 2008;99(2):335-343. doi: 10.1016/j.biortech.2006.12.015
CrossRef - Association of Official Analytical Chemists. Official Methods of Analysis. Association of Official Analytical Chemists; 1980.
- Bligh EG, Dyer WJ. A rapid method of total lipid extraction and purification. Can J Biochem Physiol. 1959;37(8):911-917. doi:10.1139/o59-099
CrossRef - Goodwin JF. The colorimetric estimation of plasma amino nitrogen with DNFB. Clin Chem. 1968;14(11):1080-1090. doi:10.1093/clinchem/14.11.1080
CrossRef - Tsumura K, Saito T, Tsuge K, Ashida H, Kugimiya W, Inouye K. Functional properties of soy protein hydrolysates obtained by selective proteolysis. LWT Food Sci Technol. 2005;38(3):255-261. doi: 10.1016/j.lwt.2004.06.007
CrossRef - Nguyen HTM, Sylla KSB, Randriamahatody Z, et al. Enzymatic hydrolysis of yellowfin tuna (Thunnus albacares) by-products using Protamex protease. Food Technol Biotechnol. 2011;49(1):48-55.
- Naqash SY, Nazeer RA. Antioxidant and functional properties of protein hydrolysates from pink perch (Nemipterus japonicus) muscle. J Food Sci Technol. 2013;50(5):972-978. doi:10.1007/s13197-011-0416-y
CrossRef - Jemil I, Jridi M, Nasri R, et al. Functional, antioxidant and antibacterial properties of protein hydrolysates prepared from fish meat fermented by Bacillus subtilis Process Biochem. 2014;49(6):963-972. doi: 10.1016/j.procbio.2014.03.004
CrossRef - Villamil O, Váquiro H, Solanilla JF. Fish viscera protein hydrolysates: production, potential applications and functional and bioactive properties. Food Chem. 2017; 224:160-171. doi: 10.1016/j.foodchem.2016.12.057
CrossRef - Batista I, Ramos C, Coutinho J, Bandarra NM, Nunes ML. Characterization of protein hydrolysates and lipids obtained from black scabbardfish (Aphanopus carbo) by-products and antioxidative activity of the hydrolysates produced. Process Biochem. 2010;45(1):18-24. doi: 10.1016/j.procbio.2009.07.019
CrossRef - Korkmaz K, Tokur B. Optimization of hydrolysis conditions for the production of protein hydrolysates from fish wastes using response surface methodology. Food Biosci. 2022; 45:101312. doi: 10.1016/j.fbio.2021.101312
CrossRef - Alahmad K, Xia W, Jiang Q, et al. Effect of the degree of hydrolysis on nutritional, functional, and morphological characteristics of protein hydrolysate produced from bighead carp (Hypophthalmichthys nobilis) using ficin enzyme. Foods. 2022;11(9):1320. doi:10.3390/foods11091320
CrossRef - Yathisha UG, Vaidya S, Sheshappa MB. Functional properties of protein hydrolyzate from ribbon fish (Lepturacanthus savala) as prepared by enzymatic hydrolysis. Int J Food Prop. 2022;25(1):187-203. doi:10.1080/10942912.2022.2027964
CrossRef
Abbreviations
ANOVA Analysis of Variance
CCD Central Composite Design
DH Degree of Hydrolysis
FPHs Fish Protein Hydrolysates
R2 Coefficient of determination
RMS Response Surface Methodology
SD Standard Deviation

Accepted on: 07 Jul 2026
Second Review by: Rafael Souza
Final Approval by: Dr. Cheng Lai Hoong





Web of Science Coverage
Emerging Sources Citation Index (ESCI)
2024 Journal Impact Factor: 1.1
Scopus Journal Metrics
CiteScore 2025: 2.6
CiteScore Details
Sustainable Nutrition: Food Systems, Nutrient Retention, and Public Health Impact

This journal is a member of, and subscribes to the principles of, the Committee on Publication Ethics (COPE)