
Nutrient Enhancement and Quality Evaluation of a Fish-Powder Incorporated Ready-To-Use Cutlet-Mix
 , Premila L. Bordoloi2, Amita Beniwal3 and Mridula Saikia Barooah2
 1Department of Community Science, Lakhimpur Girls' College (Autonomous), Lakhimpur, India
2Department of Food and Nutrition, College of Community Science, Assam Agricultural University, Jorhat, India
3Department of Nutrition and Dietetics, Chandigarh University, Mohali, India
Corresponding Author Email: mansi4148@gmail.com
DOI : http://dx.doi.org/10.12944/CRNFSJ.14.2.12
Download this article as:

The study aims to systematically develop and evaluate a Ready-To-Use (RTU) cutlet mix fortified with fish powder at various substitution levels. The developed cutlet mix were exposed to quality evaluation in terms of proximate composition, mineral profile, storage stability, and sensory performances. Evidence of substantial improvement in nutritional quality of the product with increasing proportion of fish powder were obtained by significant elevations in protein (9.78 ± 0.10 to 27.08 ± 0.70 g/100 g) and fat content (0.56 ± 0.05 - 4.36 ± 0.21 g/100 g), alongside a marked reduction in carbohydrate content (85.38 ± 0.14 to 56.78 ± 0.60 g/100 g). Total ash and minerals, particularly calcium (34.41 ± 0.46 to 476.42 ± 0.14 mg/100 g), phosphorus (75.52±4.91 - 277.14±9.70 mg/100g), and iron (0.51±0.15 - 3.04±0.17 mg/100g), showed significant increments, underscoring the micronutrient-enhancing potential of the formulation. Although sensory acceptability exhibited a gradual decline during storage, the fortified mixes retained acceptable organoleptic attributes throughout the evaluated period. Overall, incorporation of fish powder substantially enhances the nutritional density of RTU cutlet mixes, positioning the product as a promising protein- and mineral-rich alternative. Ensuring optimal packaging and controlled storage conditions remains critical for preserving quality and consumer acceptability.
KEYWORDS:Cutlet Mix; Fish powder; Nutritional Enhancement; Protein rich; Ready-To-Use
Introduction
Adequate nutrition is crucial for growth, development, immune response, and metabolic homeostasis, influencing both individual well-being and public health outcomes.1 However, global nutritional security is challenged by population growth, climate change, depletion of natural resources, and increasing consumer demand. This requires innovative approaches to food production and consumption. With passing time, India has undergone significant dietary transitions owing to economic growth, industrialization, and urbanization. Traditionally focussed cereals, pulses, legumes, fruits, and vegetables-based diets have progressively been replaced by highly processed and convenience foods.2 Concurrently, meal consumption patterns have shifted toward frequent snacking rather than structured meals.3 The growing need for food items that are ready to cook and consume is driven by urban lifestyle changes, dual-income households, and the need for time-efficient meal solutions.4 However, most commercial snack products lack essential nutrients and are often poor sources of high-quality proteins, vitamins, and minerals.5
To address these deficiencies, the development of protein-rich snack formulations has become a focus area. Fish-based foods present a viable solution, particularly in regions where fish is a dietary staple. Fish is a nutrient-dense food, providing high biological value protein, essential-amino-acids (EAA), long-chain omega-3 polyunsaturated fatty acids (PUFAs), and critical micronutrients.6 Traditional fish-based snacks in South and Southeast Asia are prepared by gelatinizing starch in dough containing fish, followed by steaming, cooling, slicing, drying, and packaging.7 Such products have potential to provide substantial nutritional benefits and have economic significance.8
The incorporation of fish protein into food products have considerable implications for addressing protein-energy malnutrition (PEM) which is a significant public health issue in countries like India. Compared to plant-derived proteins, animal-based proteins, particularly fish, exhibit high biological value protein with superior digestibility and amino acid profiles. Fish proteins consist of approximately 15–20% high-quality protein which play critical roles in cellular repair, enzymatic activity, and tissue development.9 They are also a rich source of sulphur-containing amino acids like methionine and cysteine which are crucial for synthesis of protein and other metabolic processes.10 Omega-3 fatty acids such as eicosapentaenoic acid (EPA) and docosahexaenoic acid (DHA) derived from fish, have also documented protective effect against several cardiovascular, neuroprotective, and anti-inflammatory diseases.11 The American Heart Association recommends a minimum intake of 200 mg/day of PUFAs which is achievable through dietary fish consumption or fortification.12
Fish is also an excellent source of fat-soluble vitamins and essential trace elements, including zinc, iron, and selenium.13 Despite its high nutritional value, a significant proportion of global fish production remains underutilized. In India the annual fish production reached 10.80 million tonnes in 2016, but out of the total production approximately 40% of the catch, primarily small indigenous fish species (SIF), remains unutilized or wasted.14 This underutilization was contributed by lack of adequate preservation and storage techniques.15 SIF, rich in protein, calcium, and omega-3 fatty acids, represent an untapped resource for value-added food development. These SIF provide an accessible and affordable protein source particularly in rural communities.16
Fish wastage is predominantly due to microbial degradation, lipid oxidation, and autolytic enzymatic activity.17 Processing of fish into a shelf-stable powder can be effective in mitigating post-harvest losses. Fish powder, derived from underutilized or excess fish could serve as a sustainable ingredient for fortification in Ready-To-Use food products, thus including starch-based snack formulations.18 Prior studies have successfully incorporated fish powder into starch-based product, thus yielding protein-enriched snacks with higher consumer acceptability.19,20 The global market for fish protein ingredients is expanding gradually with increased demand for functional foods, including ready-to-eat and fortified meal solutions.21 Despite of numerous research being conducted in the arena of fish-based snacks, there is limited study relating to utilization of small indigenous fish as a whole. Considering these factors, the present study aims to develop and evaluate a Ready-To-Use fish cutlet mix by incorporating fish powder derived from underutilized SIF species. This formulation is intended to address food and nutrition security through sustainable resource utilization. Fish powder-based formulations thus offer the potential to bridge nutritional gaps in snack products, thereby aligning with global efforts toward food security and optimal nutrition.
Materials and Methods
Fish powder development
Three kilogrammes of fresh small bony fish (Puntius sophore, Amblypharyngodon mola, and Labeo bata in a 2:2:1 ratio) were obtained from Raha, Nagaon, Assam, and transported to the Fish Processing Laboratory, Department of Fish Processing and Technology, College of Fisheries, Raha, in an insulated box containing a 1:1 ratio of gel ice to fish, maintaining a temperature of 0–4°C. The fish were washed thrice with chilled potable water (4 ± 1°C), descaled, gutted, rewashed, blanched (1:1 fish to water ratio) at 100°C for 5 minutes, minced, dried in a cabinet dryer at 55°C for 8 hours, and milled into fine flour (100 g per 2 minutes), which was stored in airtight HDPE containers.
Preparation of Ready-To-Use fish cutlet mix
A Ready-To-Use fish incorporated cutlet mix was formulated using the developed fish powder and rice flour as primary ingredients, with potato flour, dehydrated carrot, dehydrated beans, and spices incorporated for enhanced nutrition and sensory appeal (Table 1). Potato flour was made using the technique of Lingling et al. with required changes to suit the current experimental conditions.22 Dehydrated carrot was prepared according to Gupta and Shukla, and beans were processed using the method of Kuna et al.23,24
Table 1: Proportions of ingredients used for development of RTU fish cutlet mix
|
Treatment |
Rice flour (g) | Potato flour (g) | Fish powder (g) | Dried carrot (g) | Dried beans (g) |
| Control | 40 | 50 | 0 | 5 |
5 |
|
T1 |
30 | 50 | 10 | 5 | 5 |
| T2 | 20 | 50 | 20 | 5 |
5 |
|
T3 |
10 | 50 | 30 | 5 | 5 |
Nutritional Compositions
Moisture contents, protein, lipid, and ash contents of the produced RTU fish cutlet mix were determined using AOAC method.25 Total carbohydrates were calculated by difference method, and energy values were computed using the formula of James.26,27 Iron (Fe), calcium (Ca), and phosphorus (P) contents were analyzed using an atomic absorption spectrophotometer.
Physical Attributes
The physical parameters such as water absorption capacity (WAC), fat absorption capacity (FAC) and colour values of the produced RTU fish cutlet mix were determined. WAC and FAC of samples were analysed by the method of Sosulski et al. 28 The instrumental surface color (CIE L*a*b*) of produced RTU fish cutlet mix was measured using a Hunter Lab Mini Scan XE Plus Color Meter (Illuminant D65, 2.5 cm diameter aperture, 10° standard observer; Hunter Associate Laboratory, Inc., Reston, VA). Calibration was done applying conventional black and white tiles prior to the color measurement. CIE L* a* b* values were used to determine saturation index/ chroma [(a2+ b2)1/2] and hue angle [tan-1(b*/a*)]. Sample hue was assessed after placing the samples in front of the smallest aperture.29
Sensory Evaluation
Consumer acceptability was assessed in the Sensory Evaluation Laboratory, Department of Food Science and Nutrition, Assam Agricultural University, Jorhat. With the use of RTU-fish cutlet mix, cutlets were prepared by shallow frying at 180 ± 5°C. The prepared cutlet was evaluated by 15 semi-trained panellists for its appearance, taste, texture, crispness, flavor, and color. Samples were coded with alpha-numerals and served randomly to eliminate bias. Acceptability was graded on a 9-point hedonic scale with one being disliked extremely and nine being liked extremely.
Shelf-Life Analyses
Storage stability of the RTU fish cutlet mix kept in HDPE airtight containers under room temperature was evaluated over 3 months at 30-day intervals. Shelf-life attributes in terms of moisture change, change in free fatty acids (FFA), peroxide value (PV), and total plate count (TPC) was assessed across storage. Moisture change was determined using the oven drying method25, FFA and PV were determined as per the AOAC method, and TPC across storage was evaluated following ISO.30,31
Statistical Analysis
The results obtained in the present investigation are presented as mean ± standard deviation, and all quality analyses were carried out in triplicate. Excel and SPSS were used to analyse the data. To find significant changes between formulations at p < 0.05, a one-way analysis of variance (ANOVA) and Duncan’s multiple range test were used.
Results
Selection of Basic Ingredients
The developed snacks were formulated using rice and fish powder, considering their local availability and nutritional benefits. Rice is a staple food of Assam and a rich source of carbohydrates. While fish offers vital nutrients like protein, omega-3 fatty acids, and essential micronutrients.32 The synergy between rice and fish enhances the nutritional profile, making the combination ideal for balanced diets. Additional ingredients such as potato flour, dehydrated carrot and dehydrated beans were incorporated in various proportions (Table 1).
Sensory Evaluation of RTU fish cutlet mix
Sensory characteristics of the developed RTU rice–fish cutlet mix is displayed in Table 2. The addition of fish powder changed the mix’s appearance, giving it a deeper hue and a progressively lower attractiveness score. With an appearance score of 7.50±0.80, T1 was the highest, followed by T2 (7.17±0.72) and T3 (6.58±0.79). Taste scores rose as fish powder levels increased, ranging from 7.00±1.53 in the control to 7.58±1.08 in T3. These results are consistent with those of Islam et al. who found comparable improvements up to 55% fish powder inclusion.33 As fish powder levels increased, texture also improved; T2 scored the highest at 7.83±0.83, whereas T1 and the control scored 7.58 (±0.99 and ±0.79, respectively). Odour did not vary significantly (P>0.05), with scores ranging from 7.66±1.07 in the control to 7.00±1.00 in T3. Colour scores decreased significantly (P<0.05) with higher fish powder levels, as indicated by scores of 7.08±1.16 (control), 7.58±0.79 (T1), 7.16±0.57 (T2), and 6.75±0.62 (T3). Overall acceptability was highest for T3 (7.75±0.87), followed by the control (7.33±0.98) and T2 (7.33±0.78), with the preference for T3 mainly due to enhanced taste and texture.
Table 2: Mean sensory scores for evaluation of cutlet prepared from RTU fish cutlet mix
|
Treatment |
Appearance | Taste | Texture | Odour | Colour | Overall Acceptability |
| Control | 8.08±0.67ᶜ | 7.00±1.53ª | 7.58±0.99ª | 7.66±1.07ª | 8.33±0.49ᶜ |
7.33±0.98ª |
|
T1 |
7.50±0.80ᵇᶜ | 7.25±1.28ª | 7.58±0.79ª | 7.25±0.87ª | 7.58±0.79ᵇ | 7.17±0.71ª |
| T2 | 7.17±0.72ªᵇ | 7.33±1.23ª | 7.83±0.80ª | 7.08±0.90ª | 7.16±0.57ªᵇ |
7.33±0.78ª |
|
T3 |
6.58±0.79ª | 7.58±1.08ª | 7.75±0.86ª | 6.50±0.21ᵇ | 6.75±0.62ª | 7.75±0.87ª |
| CD | 0.62 | NS | NS | 0.44 | 0.52 |
NS |
Values are mean ± S.D
NS= not significant
Values with different superscript indicates significant difference (p<0.05)
Control= 40% rice flour, 50% potato flour, 5% dehydrated carrot, 5% beans and fish powder 0%
T1= 30% rice flour, 50% potato flour, 5% dehydrated carrot, 5% beans and fish powder 10%
T2= 20% rice flour, 50% potato flour, 5% dehydrated carrot, 5% beans and fish powder 20%
T3 =10% rice flour, 50% potato flour, 5% dehydrated carrot, 5% beans and fish powder 30%
Physical Properties of RTU fish cutlet mix
The physical properties of the RTU rice–fish cutlet mix were influenced by the incorporation of fish powder. Water absorption capacity (WAC) declined significantly, from 181.67±2.89 ml/100 g in the control to 111.00±1.73 ml/100 g in T3, indicating reduced water-holding ability with increased fish powder. This observation is in agreement with the results of Vijaykrishnaraj et al. who reported a similar decline in WAC with fish powder addition.34 Fat absorption capacity (FAC) also decreased from 105.33±5.03 ml/100 g in the control to 92.33±2.52 ml/100 g in T3, in accordance with findings by Netto et al. in fish powder–based snacks.35 Colour measurements showed a reduction in L* values (68.36 to 45.60), indicating darkening, with decreasing b* values and increasing a* values due to the natural pigmentation of the fish powder.
Table 3: Physical characteristics of developed RTU fish cutlet mix
|
Treatment |
WAC (ml/100g) | FAC
(ml/100g) |
L* | a* | b* | Hue | Chroma |
| Control | 181.67±2.89ᵈ | 105.33±5.03ᵇ | 68.36d | -0.63b | 23.65c | 91.50c |
23.66c |
|
T1 |
149.33±1.15ᶜ | 103.33±3.05ᵇ | 55.92c | 1.74b | 18.65ab | 84.67b | 18.73ab |
| T2 | 143.33±2.89ᵇ | 102.00±5.29ᵇ | 50.46b | 3.56a | 15.38a | 77.00a |
15.79a |
|
T3 |
111.00±1.73ª | 92.33±2.52ª | 45.06a | 3.91a | 13.85a | 74.23a |
14.39a |
Values are mean ± S.D; NS= not significant; Values with different superscript indicate significant difference (p<0.05)
Control= 40% rice flour, 50% potato flour, 5% dehydrated carrot, 5% beans and fish powder 0%
T1= 30% rice flour, 50% potato flour, 5% dehydrated carrot, 5% beans and fish powder 10%
T2= 20% rice flour, 50% potato flour, 5% dehydrated carrot, 5% beans and fish powder 20%
T3 =10% rice flour, 50% potato flour, 5% dehydrated carrot, 5% beans and fish powder 30%
In the Hunter Colour Lab Lightness or darkness is indicated by L* (0 = black, 100 = white). The hue on the green-to-red axis is indicated by a*. (Green is represented by a negative value, and red by a positive value).On the blue-to-yellow axis, b* represents the hue (negative value = blueness, positive value = yellowness).Hue angle (H°) is the angle in the 360° colour wheel (H° =𝑡𝑎𝑛−1b*/a*); C* is the hue’s intensity [c* = a*2 = b*2)1/2].
Nutritional Composition of RTU fish cutlet mix
The proximate composition of the RTU rice–fish cutlet mix is shown in Table 4. Moisture content decreased from 6.80±0.05% in the control to 5.98±0.06% in T3, similar to the observations of Bishnoi et al. in chicken meat–based idli mix.36 Protein content increased markedly from 9.78±0.10 g/100 g in the control to 27.08±0.70 g/100 g in T3, consistent with earlier reports indicating enhanced protein levels in fish powder–incorporated products.33 Fat content increased from 0.56±0.05 g/100 g to 4.36±0.21 g/100 g, which agrees with the findings of Abraha et al. in fish powder–enriched biscuits.37 Carbohydrate levels decreased significantly (P<0.05) from 85.38±0.14 g/100 g in the control to 56.78±0.60 g/100 g in T3, aligning with the results reported by Patimah et al. in fish flour–based biscuits.38 Ash content increased from 3.10±0.01 g/100 g to 10.60±0.17 g/100 g which is attributed to the higher mineral content of fish powder.
The mineral content of the developed rice fish cutlet mix increased significantly with the addition of fish powder (Table 4). Calcium content rose from 34.41±0.46 mg/100g in the control to 476.42±0.14 mg/100g in the highest fish powder level (P<0.05), aligning with Rathnakumar and Pancharaja’s findings.6 Phosphorus content also increased from 75.52±4.91 mg/100g in the control to 277.14±9.70 mg/100g in the highest fish powder mix, similar to previous studies by Devi et al.13 Iron content followed the same trend, rising from 0.51±0.15 mg/100g in the control to 3.04±0.17 mg/100g at the highest fish powder incorporation level, confirming the findings of Devi et al.13
Table 4: Nutritional composition of developed RTU fish cutlet mix per 100 gas per day matter basis
| Parameter | Control | T1 | T2 | T3 | CD |
| Moisture (g) | 6.80±0.05ª | 6.67±0.18ª | 6.35±0.05ᵇ | 5.98±0.06ᵇ | 0.19 |
| Dry Matter (%) | 93.20±0.05ª | 93.33±0.68ª | 93.65±0.05ª | 94.02±0.06ª | NS |
| Energy (Kcal) | 385.67±1.36ª | 391.17±9.71ª | 383.57±1.13ª | 374.68±5.55ᵇ | 10.82 |
| Crude Protein (g) | 9.78±0.10ª | 16.48±0.16ᵇ | 22.07±0.46ᶜ | 27.08±0.70ᵈ | 0.82 |
| Crude Fat (g) | 0.56±0.05ª | 2.76±0.25ᵇ | 3.64±0.21ᶜ | 4.36±0.21ᵈ | 0.37 |
| Carbohydrates (g) | 85.38±0.14ª | 75.10±0.36ᵇ | 65.63±0.53ᶜ | 56.78±0.60ᵈ | 0.85 |
| Crude Fibre (g) | 0.88±0.46ª | 0.86±0.07ª | 0.84±0.04ª | 0.84±0.03ª | NS |
| Total Ash (g) | 3.10±0.01ª | 4.66±0.20ᵇ | 8.01±0.01ᶜ | 10.60±0.17ᵈ | 0.25 |
| Calcium (mg) | 34.41±0.46a | 150.55±0.07b | 310.32±0.34c | 476.42±0.14d | 0.85 |
| Phosphorus (mg) | 75.52±4.91a | 172.18±8.52b | 213.85±8.87c | 277.14±9.70d | 23.39 |
| Iron (mg) | 0.51±0.15a | 1.90±0.09b | 2.56±0.47c | 3.04±0.17d | 0.75 |
Values are mean ± S.D; NS= not significant; Values with different superscript indicate significant difference (p<0.05)
Control= 40% rice flour, 50% potato flour, 5% dehydrated carrot, 5% beans and fish powder 0%
T1= 30% rice flour, 50% potato flour, 5% dehydrated carrot, 5% beans and fish powder 10%
T2= 20% rice flour, 50% potato flour, 5% dehydrated carrot, 5% beans and fish powder 20%
T3 =10% rice flour, 50% potato flour, 5% dehydrated carrot, 5% beans and fish powder 30%
Shelf-life Analysis
Across a storage period of 60 days, a substantial change (p<0.05) in the quality features of the created RTU fish cutlet mix was noted. Observation of sensory characteristics (Table 5) across the storage period indicates a progressive decline in all sensory attributes as storage days increased, though the extent of deterioration differed among treatments. Appearance scores decreased markedly, especially in formulations having higher fish powder incorporation (T₂ and T₃). This reflects surface dullness and changes in colour characteristics associated with oxidative processes. Taste and flavour also declined notably across storage, with T₃ showing the greatest reduction. This could likely be due to accelerated lipid oxidation and the formation of off-flavours at higher level of fish powder inclusion. Texture, however, remained relatively stable throughout storage across all formulations, with statistically non-significant variations. This suggests a minimal structural changes during storage. Odour scores declined moderately, with fish-based mixes exhibiting higher susceptibility than the control. Thus, highlighting the oxidative sensitivity of fish-derived ingredients. Colour scores followed a similar decreasing trend, with more pronounced losses observed at higher incorporation of fish powder. Correspondingly, overall acceptability also decreased steadily during storage, although formulations with moderate fish powder content (particularly T₁) maintained comparatively better sensory quality than those with higher inclusion levels. Overall, the results demonstrate that sensory qualities are adversely affected by storage duration. The formulations containing lower to moderate levels of fish powder show enhanced stability and sustained acceptability over-time.
Table 5: Mean sensory score of developed RTU fish cutlet mix across storage
|
Treatment |
Storage Days | Appearance | Taste | Texture | Odour | Flavour | Colour | Overall Acceptability |
| Control | 0th day | 8.08±0.67 | 7.00±1.53 | 7.58±0.99 | 7.66±1.07 | 7.50±0.90 | 8.33±0.49 |
7.33±0.98 |
| 30th day | 7.70±0.48 | 6.90±1.10 | 7.50±1.08 | 7.50±0.71 | 7.40±0.10 | 7.70±0.48 | 6.70±0.48 | |
| 60th day | 7.10±5.70 | 6.50±0.71 | 7.30±0.82 | 7.30±0.82 | 7.20±1.03 | 7.40±0.70 |
6.60±0.52 |
|
|
CD at 0.05 |
0.499 | NS | NS | NS | NS | 0.505 | NS | |
| T₁ | 0th day | 7.50±0.80 | 7.25±1.28 | 7.58±0.79 | 7.25±0.87 | 7.25±0.86 | 7.58±0.79 |
7.17±0.71 |
| 30th day | 6.50±0.52 | 6.70±1.16 | 7.20±0.63 | 7.00±0.82 | 7.10±0.99 | 7.30±0.95 | 7.10±0.74 | |
| 60th day | 6.00±0.67 | 6.60±1.17 | 7.00±0.67 | 6.70±0.95 | 6.70±1.06 | 7.00±1.15 |
6.80±0.63 |
|
|
CD at 0.05 |
0.859 | NS | NS | NS | NS | NS | NS | |
| T₂ | 0th day | 7.17±0.72 | 7.33±1.23 | 7.83±0.80 | 7.08±0.90 | 7.00±0.95 | 7.16±0.50 |
7.33±0.78 |
|
30th day |
6.60±0.63 | 6.70±1.06 | 7.60±0.84 | 6.40±6.99 | 6.70±0.82 | 7.10±0.57 | 6.90±0.57 | |
| 60th day | 5.50±0.52 | 6.30±1.06 | 7.10±0.57 | 6.10±0.74 | 6.00±1.05 | 6.40±1.17 |
6.30±0.76 |
|
|
CD at 0.05 |
0.683 | 0.910 | NS | 0.730 | 0.864 | NS | 0.64 | |
| T₃ | 0th day | 6.20±0.63 | 7.58±1.08 | 7.75±0.86 | 7.00±1.10 | 7.08±1.16 | 6.75±0.62 |
7.75±0.87 |
|
30th day |
6.10±0.69 | 7.40±1.07 | 7.50±0.85 | 6.60±0.70 | 7.10±1.29 | 6.70±0.48 | 7.20±0.63 | |
| 60th day | 5.47±0.67 | 5.50±0.85 | 6.00±0.67 | 5.80±0.92 | 6.20±1.03 | 6.30±0.48 |
6.60±0.51 |
|
|
CD at 0.05 |
0.64 | 0.891 | NS | 0.833 | NS | NS |
0.70 |
Values are mean ± S.D; NS= not significant; Values with different superscript indicate significant difference (p<0.05)
Control= 40% rice flour, 50% potato flour, 5% dehydrated carrot, 5% beans and fish powder 0%
T1= 30% rice flour, 50% potato flour, 5% dehydrated carrot, 5% beans and fish powder 10%
T2= 20% rice flour, 50% potato flour, 5% dehydrated carrot, 5% beans and fish powder 20%
T3 =10% rice flour, 50% potato flour, 5% dehydrated carrot, 5% beans and fish powder 30%
The developed RTU fish cutlet mix’s shelf-life characteristics throughout a 60-day storage period are depicted in Fig. 1. Fig. 1a shows the total bacterial load of the designed RTU fish cutlet mix. For the control, T1, T2, and T3 formulations, the initial microbial load of the produced RTU rice-fish flour mix was 3.30 ± 0.20, 3.34 ± 0.22, 3.69 ± 0.21, and 3.62 ± 0.35 log CFU/g, respectively. By the sixty-first day of storage, this had risen to 4.53 ± 0.23, 4.76 ± 0.12, 4.11 ± 0.19, and 5.24 ± 0.09 log CFU/g. Notwithstanding this rise, the microbial load recorded on the 30th and 60th days stayed within permissible bounds of 5 log cfu/g, demonstrating microbiological safety over a duration of 60 days. 39
Figure 1b illustrates the changes in peroxide value (PV) of the developed RTU fish cutlet mix during storage. On 0th day, the PVs of the Control, T1, T2, and T3 formulations were 3.30, 3.34, 3.69, and 3.62 mEq O₂/kg, respectively. This increased significantly (p<0.05) to 4.53, 4.76, 4.11, and 5.24 mEq O₂/kg over the storage period. Although a gradual increase in PV was observed, all values remained well below the permissible threshold of 10–20 mEq O₂/kg.40
Figure 1c depicts the changes in moisture content of the formulated RTU rice–fish flour mix over 60 days of storage. A gradual increase in moisture content was observed in all formulations. Specifically, the moisture content of the Control increased from 6.80 ± 0.05% to 7.78 ± 0.06%, T1 from 6.67 ± 0.18% to 7.13 ± 0.56%, T2 from 6.35 ± 0.05% to 7.37 ± 0.03%, and T3 from 5.98 ± 0.06% to 6.79 ± 0.04%.
Figure 1d depicts the changes in free fatty acid (FFA) content of the developed RTU fish cutlet mix during 60 days of storage. FFA levels increased significantly over the storage period. On day 0, FFA content ranged from 0.65 ± 0.08% to 0.91 ± 0.07% across the formulations. By the 60th day, FFA content had risen to 1.49 ± 0.08% in Control, 1.70 ± 0.10% in T1, 1.73 ± 0.08% in T2, and 1.89 ± 0.07% in T3. The increase in FFA across all formulations exceeded acceptable limits, indicating the onset of rancidity. Ozogul et al. state that when FFA values of oleic acid reach 0.5–1.5%, fish products usually start to exhibit obvious acidity.41
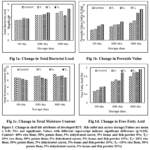 |
Figure 1: Change in shelf-life attributes of developed RTU fish cutlet mix across storage |
Discussion
Incorporation of fish powder into the RTU fish cutlet mix significantly enhanced its overall nutritional profile. This increment was more pronounced in terms of protein, fat, and minerals. Thus, aligning with earlier findings on the nutrient density of fish-based ingredients.32, 33 This improvement in quality attributes is largely due to the presence of high-quality, complete proteins. Incorporation of which in turn led to enrichment of cereal-based formulations.42 The increase in fat content was also observed with higher levels of fish powder, that can be attributed to the presence of EFA, especially omega-3 fatty acids such as EPA and DHA.12,18,43 Moreover, fish powder prepared by utilizing bones, served as a concentrated source of minerals, thus elevating the total mineral content of the mix on increased fish powder concentration.18,44 The substantial increase in calcium, phosphorus and iron levels further demonstrates the value of fish powder as a mineral-rich supplement.6,13 Studies reports that, 10% of fish powder consumption daily can be effective in meeting 20% of the daily calcium requirement for pregnant and lactating women.44-46 Thus, bearing the potential to be a potent source for dietary supplementation.47 However, the increased incorporation of fish powder led to a reduction in carbohydrate levels, reflecting the displacement of rice flour, which is consistent with earlier findings in fish flour–enriched products.12,38,48
Sensory results indicate that higher fish powder levels improved taste and texture, attributes that contributed to the higher overall acceptability of T3. This might be due to the presence of umami-rich amino acids and savoury compounds in fish which results flavour enhancement. Further, presence of higher protein and fat could also contribute to better texture and mouthfeel.49,50 However, increased fish powder levels also reduced appearance and colour scores due to the natural pigmentation of fish, causing darker shades in the T3 formulation.49,51 Islam et al. and other recent studies consistently report that increasing fish powder levels in food products improves taste and texture, but can negatively affect appearance and color.33,49,52
In the study a decrease in WAC was recorded with increase in fish powder content. Multiple studies show a significant decrease in WAC as fish powder content increases. Study carried out by Tiwari et al. showed a decrease in WAC from 212.67 to 71.67 ml/100g as fish powder increased from 0 per cent to 30 per cent.52 Higher fish powder level also significantly lowered WAC in fish powder incorporated Pasta. This could likely be due to reduction in starch content and altered protein-starch interactions.12 FAC also declined with increased fish powder concentration. In wafers, FAC decreased from 164.00 to 66.00 ml/100g as with increased supplementation with fish powder.52 This reduction could be attributed to the higher protein and mineral content of fish powder, which binds less fat than starch does.53,54 This aligns with the previously reported decline in WAC and FAC in fish powder incorporated snacks.34,35 Colour changes observed in instrumental measurements confirmed the influence of fish pigmentation on the developed formulation. A decrease in L* value was observed with increased supplementation which could result from presence of natural pigments such as myoglobin, haemoglobin, and carotenoids which darken the product and reduce its lightness. Increased redness and yellowness value observed in the study could be because of several other pigments present in fish muscle.33,55
Shelf-life analysis revealed that oxidative changes such as rise in FFA and peroxide values, were prominent in samples having higher level of fish powder. Although microbial loads were within admissible limits across storage of 60 days, the oxidative deterioration suggested a reduced shelf stability for higher fish powder formulations. The findings indicate that T1 and T2 provided better storage stability compared to T3 as sensory and oxidative changes were less pronounced in these formulations. Products with higher fish powder levels exhibited more pronounced increases in FFA and peroxide values during storage. This reflects accelerated lipid hydrolysis and oxidation. It could mainly result from high PUFA in fish products which is highly susceptible oxidation, especially when exposed to air, light, or suboptimal packaging. Sensory quality deterioration across storage was also observed in the present investigation. This may be due to elevated oxidative markers which correspond to negative sensory changes, such as rancid odours and off-flavours which in turn reduced consumer acceptability.35
Conclusion
The present investigation demonstrates that incorporation of fish powder into cutlet mix improves the quality of the developed products in terms of its protein, fat, and mineral content. It was observed that fish powder could be successfully incorporated up to 30 per cent without significantly affecting its sensory characteristics. Physical properties indicated changes in water and fat absorption, affecting product formulation. These findings support the development of nutritionally enriched, Ready-To-Use fish cutlet mix as a viable alternative for public health nutrition and food security.
Acknowledgement
The authors would like to acknowledge Assam Agricultural University for granting the Masters research work. The authors are grateful to the Department of Fish Processing Technology, College of Fisheries, Assam Agricultural University for providing laboratory facilities and necessary hand holding for carrying out the research.
Funding Sources
The author(s) received no financial support for the research, authorship, and/or publication of this article.
Conflict of Interest
The author(s) declare no conflict of interest.
Data Availability Statement
This statement does not apply to this article.
Ethics Statement
This research did not involve human participants, animal subjects, or any material that requires ethical approval
Informed Consent Statement
This study did not involve human participants, and therefore, informed consent was not required.
Clinical Trial Registration
This research does not involve any clinical trials.
Permission to Reproduce Material from Other Sources
Not Applicable
Author Contributions
- Mansi Tiwari: conceptualization; investigation; methodology; writing-original draft; writing-review & editing
- Premila Laishram Bordoloi: conceptualization; data curation; resources; supervision; writing-review & editing
- Amita Beniwal: formal analysis; methodology; resources; statistical analysis
- Mridula Saikia Barooah: conceptualization; project administration; resources; supervision; validation
References
- Medical Research Council. Annual review of nutrition and human health research. National Institute for Health Research. 2018:5.
- Popkin B. M., Nielsen S. J. The sweetening of the world’s diet. Obes Res. 2003; 11:1325–1332.
CrossRef - Chaplin K., Smith A. P. Breakfast and snacks: associations with cognitive failures, minor injuries, accidents and stress. Nutr. 2011; 3:515–528.
CrossRef - Solanki S., Jain S. A study on consumer buying behaviour towards ready-to-eat food industry. Proc XVIII Annu Int Conf. 2017:277–284.
- Iqbal A., Khalil A., Ateeq N., et al. Nutritional quality of important food legumes. Food Chem. 2006; 97:331–335.
CrossRef - Rathnakumar K., Pancharaja N. Development of health mix from lizard fish and its nutritional characteristics. Int J Curr Microbiol Appl Sci. 2018; 7:3136–3144.
CrossRef - Siaw C. L., Yu S. Y., Chen S. S. Studies on Malaysian fish crackers: effect of sago, tapioca and wheat flours on acceptability. Proc Second Symp Fed Asian Oceanian Biochem. 1980:128–136.
- Raza A. S. Development of fish protein powder as an ingredient for food applications. J Food Sci Technol. 2013; 52:648–661.
CrossRef - Mohanty B. P., Behera B. K., Sharma A. P. Nutritional significance of small indigenous fishes in human health. CIFRI ICAR. 2011:162.
- Muller O., Krawinkel M. Malnutrition and health in developing countries. Can Med Assoc J. 2005; 173:279–288.
CrossRef - Kris-Etherton P., William M., Harris S., et al. Fish consumption, fish oil, omega-3 fatty acid, and cardiovascular disease. J Am Heart Assoc. 2000; 106:1–12.
CrossRef - Desai A., Brennan M. A., Brennan C. S. Effect of semolina replacement with fish protein powder on pasta. LWT. 2018; 89:52–57.
CrossRef - Devi N., Aparna K., Kalpana K. Utilization of fish mince in pasta products. Int Food Res J. 2013; 20:219–224.
- The state of world fisheries and aquaculture 2018. FAO. 2018.
- Chavan B. R., Basu S., Kovale S. R. Development of edible texturised dried fish granules. CMU J Nat Sci. 2008; 7:173–181.
- Mohanty B. P., Behera B. K., Sharma A. P. Nutritional significance of small indigenous fishes in human health. CIFRI ICAR. 2011:162.
- Boziaris I. S. Microbiological spoilage of fresh fish. Fish Aquac J. 2015;6(1).
- Abbey L., Amengor M. G., Atikpo M. O., et al. Nutrient content of fish powder. Food Sci Nutr. 2016; 5:374–379.
CrossRef - Suknark K., McWatters K. H., Phillips R. D. Acceptance of extruded fish snack products. J Food Sci. 2001; 63:721–725.
CrossRef - Shaviklo A. R. Development of fish protein powder. J Food Sci Technol. 2011; 52:648–661.
CrossRef - Shaviklo G. R. Product development approach for increasing fish consumption. Infofish Int. 2015; 4:47–52.
- Cui L., Tian Y., Tian S., et al. Preparation of potato whole flour. Grain Oil Sci Technol. 2018;1(3):145–150.
CrossRef - Gupta N., Shukla R. N. Preparation and quality evaluation of dehydrated carrot and onion slices. J Food Process Technol. 2017;8(9):6.
CrossRef - Kuna P., Chandni R. C., Sankar A., et al. Solar dehydration of green beans. Int J Res Granthaalayah. 2017;5(4):39–44.
CrossRef - Official methods of analysis. AOAC. 2005:1193.
- Nitisewojo P. Prinsip analisis makanan. Penerbit UKM. 1995.
- James C. S. Analytical chemistry of foods. Blackie Academic. 1990.
- Sosulski F. W., Garatt M. O., Slinkard A. E. Functional properties of legume flours. Int J Food Sci Technol. 1976; 9:66–69.
CrossRef - Navneet K., Kshitij K. Carrot pomace wheat cookies. J Pure Appl Sci Technol. 2011; 1:5–11.
- Official methods of analysis. AOAC. 2000.
- Enumeration of microorganisms. ISO. 1991:12.
- Sharma S., Mohanty S., Mohapatra T., et al. National Seminar on Fisheries. 2017.
- Islam M., Sarker M. N. I., Islam M. S., et al. Protein enriched instant soup mix. Food Nutr Sci. 2018; 9:663–675.
CrossRef - Vijaykrishnaraj M., Kumar S. B., Prabhasankar P. Green mussel enriched pasta. Food Meas Charact. 2015; 9:76–85.
CrossRef - Netto J. D. P. C., Oliveira F. P. R. C., Lapa-Guimarães J., et al. Tilapia snack characteristics. Food Sci Technol. 2014; 34:591–596.
CrossRef - Bishnoi S., Khanna N., Bishnoi N., et al. Shelf-life of instant idli mixes. J Anim Res. 2015; 5:879–884.
CrossRef - Abraha B., Mahmud A., Admassu H., et al. Biscuit with fish protein concentrate. J Nutr Food Sci. 2018;8(6):1–13.
- Patimah S., Arundhana A. I., Mursaha A., et al. Fish flour cookies. Curr Res Nutr Food Sci J. 2019; 7:504–516.
CrossRef - Centre for Food Safety. Microbiological guidelines for food. CFS. 2014:14–21.
- Connell J. J. Control of fish quality. Fishing News Books. 1995.
- Ozogul Y., Oyurt G., Ozogul F., et al. Freshness assessment of eel. Food Chem. 2005;92(4):745–751.
CrossRef - Bhowmik S., Zakaria M. A., Sarwar M. S., et al. Ready-to-use fish products. Appl Food Res. 2022;2(1):100111.
CrossRef - Gómez-Guillén M. C., Pérez-García S., Alemán A., et al. Ready-to-eat fish product enriched with fish oil. Foods. 2023; 12:2272.
CrossRef - Byrd K. A., Pincus L., Pasqualino M. M., et al. Dried small fish nutrient density. Matern Child Nutr. 2021;17(4): e13192.
CrossRef - Jensen M. B., Jakobsen J., Jacobsen C., et al. Minerals and proteins in fish side streams. Mar Drugs. 2024;22(4):162.
CrossRef - Jahan S. N., Bayezid M. A., Islam B., et al. Biochemical quality of fish powder. Am J Food Nutr. 2017;5(3):110–114.
CrossRef - Busca K., Wu S., Miao S., et al. Bioavailability of calcium from fish bone powder. Ir J Agric Food Res. 2022;61(2):229–240.
CrossRef - Bandara G. M. W. R., Hewage H. S., Arampath P. C. Nutritious fish powder mixture. J Food Agric. 2019;12(1).
CrossRef - Kabir M. I., Ove T. A., Kamal M. M., et al. Edible fish powder quality. J Food Qual. 2022; 2022:2530533.
CrossRef - Ahern M., Lowore T., Andrianarimanana M. H., et al. Fish powder in school meals. Front Nutr. 2025; 12:1605540.
CrossRef - Partanen M., Honkapää K., Hiidenhovi J., et al. Chemical and sensory properties of fish proteins. Foods. 2023;12(5):966.
CrossRef - Tiwari M., Barooah M. S., Bordoloi P. L. Fish powder enriched wafers. J Aquat Food Prod Technol. 2020;29(8):775–788.
CrossRef - Nawaz A., Khalifa I., Walayat N., et al. Whole fish powder snacks. Sustainability. 2021;13(11):6010.
CrossRef - Hussein A. A., Awahd H. A., Jabber R. S., et al. Low-fat surimi burgers. IOP Conf Ser Earth Environ Sci. 2025; 1449:012157.
CrossRef - Liao Q., Wei C., Li Y., et al. Machine vision for fish freshness prediction. Food Nutr Sci. 2021;12(3):239–248.
CrossRef
Abbreviations
CD – Critical Difference
CFU – Colony Forming Unit
DHA – Docosahexaenoic Acid
EPA – Eicosapentaenoic Acid
FAC – Fat Absorption Capacity
FFA – Free Fatty Acids
NS – Not Significant
PUFA – Polyunsaturated Fatty Acids
PV – Peroxide Value
RTU – Ready-To-Use
TPC – Total Plate Count
WAC – Water Absorption Capacity
CD – Critical Difference
CFU – Colony Forming Unit
DHA – Docosahexaenoic Acid
EPA – Eicosapentaenoic Acid
FAC – Fat Absorption Capacity
FFA – Free Fatty Acids
NS – Not Significant
PUFA – Polyunsaturated Fatty Acids
PV – Peroxide Value
RTU – Ready-to-Use
TPC – Total Plate Count
WAC – Water Absorption Capacity
 PlumX:
 Views: 1727
  PDF Downloads:
272
PDF Downloads:
272 
Accepted on: 24 Jun 2026
Second Review by: Yuli Hartati
Final Approval by: Krešimir Mastanjević





Web of Science Coverage
Emerging Sources Citation Index (ESCI)
2024 Journal Impact Factor: 1.1
Scopus Journal Metrics
CiteScore 2025: 2.6
CiteScore Details
Sustainable Nutrition: Food Systems, Nutrient Retention, and Public Health Impact

This journal is a member of, and subscribes to the principles of, the Committee on Publication Ethics (COPE)