
Integrating Halal and Food Safety Indicator Relationships through DEMATEL-ISM-MICMAC Structural Analysis
 , Patdono Suwignjo1*, Iwan Vanany1, Bambang Syairudin1
 1Department of Industrial and Systems Engineering, Institut Teknologi Sepuluh Nopember (ITS), Surabaya,Indonesia
2Department of Industrial Engineering, Institut Teknologi Nasional Bandung (Itenas), Bandung, Indonesia
Corresponding Author Email:patdono@ie.its.ac.id
DOI : http://dx.doi.org/10.12944/CRNFSJ.14.2.30
Download this article as:

The food industry’s supply chain is both complex and fragmented, which amplifies the risk of contamination; this paper focuses on addressing these challenges. To tackle these challenges, companies need indicators that track their activities from procurement through to returns, as such metrics are essential for supporting decision-making, efficiency, and risk management. This study’s goal was to investigate the relationships among operational performance indicators in order to identify priority indicators that may enhance operational performance while integrating halal and food safety certification. The indicators were identified by examining activities within the business process (source, make, deliver, and return). They were then developed based on previous studies and the perspectives of experts panel. The DEMATEL method was used to find cause-and-effect links between indicators; ISM was used to make hierarchical structures; and MICMAC was applied to categorize indicators according to driving power and dependent power. This study shows that there are five hierarchical levels of the 25 identified operational indicators. Indicators such as material quality, cleanliness, defect rate, production rate, and warehouse inventory can be root causes that impact other operational performance indicators. The findings may assist stakeholders in the food industry to identify root causes, strengthen halal and food safety assurance, and significantly improve performance. This study contributes new insights by applying an activity-based approach combined with DEMATEL-ISM-MICMAC, advancing both the theoretical and practical application of performance indicators within the food industry.
KEYWORDS:Business process; Food safety; Food supply chain; Halal food; Operational performance
Introduction
The world population in 2025 is projected to reach 8,261,826,7581, spread across the continents as follows: Asia (59.04%), Africa (18.28%), America (12.86%), Europe (9.24%), and Oceania (0.57%)2. On the other hand, food products, as a primary human need, have specific characteristics that can pose challenges to meeting this need, for example, high variety (10% common), relatively short shelf life, and seasonality3. Food industrialization is a solution to meeting food security. However, the food industry can also cause problems if not managed properly. Millions of people may fall ill or die from consuming unhealthy food4. According to the World Health Organization (WHO) (2024), 600.000.000 individuals get sick every year by consuming food that contains contaminants, with 40% being children under five years old, while financial losses of more than US$ 110.000.000.000 are incurred due to unsafe food, especially in nations with poor and medium income.
Due to the dangers of illness and death that can happen when food is not handled properly, it is very important to make sure it is safe5. Food safety, according to the WHO, is the set of rules and practices that must be followed during the production, processing, storage, distribution, and preparation of food to make sure it is safe, healthy, and fit for human consumption4.
Halalness is one of the requirements that products must meet when Muslims consume them. While food safety is a concept related to protecting consumer health, halalness broadens its scope by demanding compliance with Islamic law. These two concepts are key factors influencing consumers in product selection.6 By implementing these two concepts in their operations, companies can capture the opportunity of serving the Muslim market, which has the second-largest population in the world, with a total of 2.000.000.000 people7.
The integration of halal and food safety certification into operational systems within the food industry is becoming an essential necessity due to the globalization of supply chains. The risk of contamination in this industry is increasing due to the complex network of stakeholders, including farmers, input suppliers, transporters, processing units, wholesalers, distributors, retailers, exporters, importers, and finally, consumers 8. Furthermore, the fragmentation of supply chains across various regions and even countries contributes to the risk of contamination 9. Therefore, consumers demand food safety assurance that emphasizes the management of microbiological, chemical, and physical hazards in food 10. Muslim consumers are pushing regulatory agencies and processing companies to produce products with halal certification 11. This involves guaranteeing that the processing area is sanitary and that products are free from contamination by pork and its by-products, alcohol, blood, as well as certain types of animals and all types of flesh that have not been slaughtered according to Islamic protocols 12. Ensuring halal and food safety compliance throughout the supply chain calls for an integrated standard covering all stages, from raw materials to distribution.
According to earlier studies, consumers are willing to pay a premium for goods with food safety and halal certification 13,14. Therefore, companies having halal certification will positively impact their operations 15. Likewise, food safety certifications such as HACCP and ISO 22000 provide immediate and enduring benefits for a company’s profitability 16. Compliance with internationally accepted standards is crucial for companies because failure to comply with halal and food safety standards directly impacts their reputation, operational costs, and market confidence 17. Implementing halal and food safety standards can also positively impact a company’s performance to a significant degree 18. For this reason, it is necessary to identify indicators that influence operational performance, especially in connection with halal and food safety compliance. Furthermore, understanding the relationships between these operational performance indicators is crucial for mapping cause and effect. This mapping can be used to evaluate current policies and develop future policies for the food industry.
DEMATEL, ISM, and MICMAC are the three integrated methods used in this study. The main objective is to systematically build a hierarchical model among performance indicators. The cause-and-effect correlations between the indicators are found and shown using the DEMATEL approach. ISM is subsequently employed to organize the hierarchical structure based on these relationships, resulting in a clear model that illustrates the degree of interconnection and the sequence of influence among the indicators. MICMAC complements the analysis by classifying indicators according to their levels of influence and dependence, enabling the mapping of indicators as drivers, dependents, linkages, or autonomous. In comparison to other methods such as Regression or Structural Equation Modeling (SEM), the DEMATEL-ISM-MICMAC model is more appropriate for exploratory and conceptual purposes, as it does not solely focus on the statistical relationship, but also on the hierarchical structure and indicator dynamics. Therefore, the combination of these three methods provides a strong justification for the development of a model that can effectively illustrate the complexity of the relationship between performance indicators in the context of food safety and halal, as well as produce conceptual insights that can be used as the foundation of business strategy or further research. This model is important to provide an analytical framework, evaluation tools, and useful recommendations for the food industry by knowing the operational performance indicators and modeling the relationships between these indicators for future research.
The food industry has a supply chain that is crucial for human needs, job creation, and economic growth, and also impacts the natural environment 19. The food supply chain is highly complex and has unique characteristics; if not managed properly, it will cause losses for both consumers and producers 9, 20,21. Key characteristics inherent in the food industry include: shelf-life constraints, food safety requirements, long production times, seasonality in production results, special features such as sensory properties (flavor, color, size, and shape), conditioned transportation and warehousing, and the impact of natural conditions on the quantity and quality of agricultural products 3.
To overcome these distinctive challenges, the Supply Chain Operations Reference (SCOR) Model offers a comprehensive framework for assessing and managing operations. SCOR is the first cross-industry framework designed to assess and improve supply chain performance and management across companies 9. Although the SCOR model is often used in non-food industries, it can also facilitate an in-depth study of the complex performance measurement indicators applied in agribusiness production systems and related supply chains 22. The basis of every supply chain is the ‘chain’ of source, make, and deliver 23,24. Because supply chains are not only related to companies but also to consumers, there is the additional ‘return’ activity, i.e., products being returned after delivery to consumers 25. Apart from business process activities, in the SCOR framework, there are performance attributes such as reliability, responsiveness, agility, cost, and assets 26.
Besides quality and food safety, one of the consumers’ needs that companies with a majority Muslim consumer base must address is the assurance of halal products. For example, Indonesia, a nation with a Muslim majority, has implemented legislation that ensures things are halal, as specified in Law No. 33 of 2014. The importance of halal assurance stems from the commandment of Muslims to only consume halal food, as stated in Surah Al-Baqarah, verse 168. According to the Indonesian Ulema Council (MUI), there are three main criteria for halal certification: the halalness of the raw materials used, the methods of obtaining them, and the processes of processing them. For example, when slaughtering, a halal slaughterer must recite a prayer before carrying out the slaughtering process, complying with halal slaughtering regulations 11. The challenge of maintaining these three main criteria is multidimensional and difficult to contextualize holistically, because they are all interdependent and equally important 27.
Given the characteristics of the food industry mentioned above and the need to meet halal requirements, operational management is crucial for managing supply uncertainty and maintaining product quality, safety, and halal certification. Therefore, the goal of operational management in the food industry is not only to ensures that procedures are functional and efficient but also to prioritize protecting consumers.
Several studies have focused on performance indicators in the food industry and introduced specific indicators related to its characteristics. A framework for assessing the food supply chain performance has been established in previous research. Aramyan et al 28conducted research on the tomato supply chain by collecting expert perspectives to identify performance measurement indicators with three general dimensions: efficiency, flexibility, and responsiveness; and one dimension specifically related to food characteristics, namely food quality. They examined financial and non-financial dimensions, and food safety was one of the things that made up the food quality dimension. Bigliardi and Bottani 29suggested at the Balanced Scorecard (Financial, Learning and Growth, Internal Processes, and Customer) to develop a performance measurement framework for the food supply chain, and suggested integrating several measurement aspects. To that end, Moazzam et al 22looked at performance indicators from a business process perspective using the SCOR approach with five dimensions (reliability, responsiveness, agility, cost, and assets), where these indicators are derived from activities for operational implementation. To obtain the right strategy, it is necessary to understand the indicators as factors that influence or are influenced by other indicators. Sufiyan 30 examined performance in the food supply chain by examining the relationship between indicators using DEMATEL and Analytic Network Process (ANP). Although many studies have addressed activity-based indicators in the supply chain and developed criteria to address the quality aspects of the food industry, without explicitly addressed halal and food safety requirements. This leaves a gap in understanding how compliance with halal and food safety standards translates into operational performance outcomes. To address this gap, the present study applies the DEMATEL-ISM-MICMAC approach to analyze the interrelationships among indicators, thereby providing a structured framework that integrates halal assurance and food safety into operational performance measurement. Informed by past research, this study addresses the gap through the following research questions:
RQ 1 – What indicators reflect operational performance integrated with halal and food safety requirements?
RQ 2 – What is the relationship between operational performance indicators integrated with halal and food safety requirements?
The results of this study can assist the food industry in establishing effective and efficient systems that comply with food safety and halal requirements. Using a qualitative approach, operational performance indicators were explored. The researchers used SCOR, which focuses on operational business process activities (source, make, deliver, return) to explore and categorize the operational performance indicators. The indicators identified from the characteristics in the food industry (covering halalness and food safety) are listed in Table 1, and their mapping is presented in Table 2.
Table 1: The Operational Performance Indicators in Food Industry Base on Supply Chain Activities
|
Activities |
KPI
Code |
Indicator | Source | Description |
| Source | (1) | Sufficient employee | Interview results |
Have a food safety coordinator & halal supervisor and for RPH have at least one halal slaughterer. |
|
(2) |
Employee knowledge evaluation31, 32, 25 | Literature | Employees know, understand, and initiate actions related to halal and food Requirements. Knowledge related to: Halal and food safety mind-set, knowledge, motivation. | |
| (3) | Sufficient raw materials25, 32 | Literature |
Raw materials must be available in sufficient quantities according to industrial demands. |
|
|
(4) |
Number of materials not contaminated by non-FSH substances25, 27, 33, 32, 34, 35 | Literature | Raw materials must be free from direct or indirect contact, mixing, or interaction with anything that is categorized as unclean or haram according to Islamic law. | |
| (5) | Operational cost22, 25, 33, 36, 37 | Literature |
All expenses incurred in running a business on a day-to-day basis. These costs are important to monitor because they directly impact a company’s profitability. |
|
|
(6) |
Availability of Sanitation25, 38, 39 | Literature | Sanitation is crucial, especially in the food industry, to ensure product safety and employee health. This includes access to adequate facilities and hygienic conditions in the work environment. | |
| (7) | Suppliers with halal, HACCP/ISO 22000 certification40, 41, 42 | Literature |
Suppliers with ownership of documents are needed to ensure that the supplier has met standards in terms of halal and food safety aspects. |
|
| Make |
(8) |
Percentage of employee awareness (cleanliness)28, 43, 31, 39, 44, 45, 46, 47 | Literature | Employees are objects that have significant potential to carry contaminants. The lower the percentage of employees who do not comply with hygiene regulations, the better. |
| (9) | Percentage of compliance in product handling & animal welfare34,48, 49, 50, 51 | Literature |
A crucial aspect of industries involving animals. This indicator focuses on how animals are managed from the farm to the finished product. |
|
|
(10) |
Percentage of compliance with facility cleanliness inspection results49,50 | Literature | Number of Violations | |
| (11) | Number of defective FSH products (WIP)43, 39 | Literature |
% of defective products Number of defective products Food safety & Halal. |
|
|
(12) |
Separation of halal and non-halal facilities50 | Literature | Segregation of halal facilities is an essential physical element to guarantee the complete elimination of contamination during manufacturing. | |
| (13) | Documentation47, 49, 52, 53 | Literature |
Documentation related to food safety implementation and its availability for assessment are factors to consider. Thorough documentation and comprehensive record-keeping throughout the HACCP process are essential requirements to ensure compliance with regulatory standards and facilitate traceability. |
|
|
(14) |
Production Rate54, 55, 56, 57 | Literature | Looking at the productivity of a process in optimizing resources, costs and maintaining quality. Percentage of output to input. | |
| Delivery | (15) | Compliance with storage facility specifications58, 59, 50 | Literature |
Product storage facility specifications can be represented by the percentage of damaged products (damaged packaging, crushed, wet) during the storage process. |
|
(16) |
Number of warehouse facility inspections | Interview results | Reducing the risk of contamination and damage to stored goods. Demonstrating compliance with food safety and halal standards. | |
| (17) | Percentage of product stock shortages | Interview results |
Controlling the number of products to prevent overstock or understock. |
|
| (18) | On-Time Delivery Rate30, 60, 61, 62 | Literature | This indicator measures how often product shipments arrive at their destination on or before the promised time to customers. It measures the percentage of correct deliveries (product, quantity, and condition) and on-time deliveries. | |
| (19) | Percentage of accuracy in order quantity and type62 | Literature | Measuring the ability to meet customer demand with the right quantity and type. | |
| (20) | Compliance with halal labelling and clarity of composition25, 33, 32, 34, 35, 39, 50, 63 | Literature | This indicator indicates the company’s compliance with food safety and halal regulations. | |
| Return | (21) | Availability of procedures for handling defective FSH products | Interview results | In the BPJPH standards there is a clause stating that companies must have an SOP for halal failure. |
| (22) | Percentage of defective products | Interview results | The level of non-conformity of recalled products needs to be measured based on the product that can be worked on and resold. | |
| (23) | Number of customer complaints59 | Literature | One of the company’s goals is to meet customer quality standards. If consumers receive a product that doesn’t meet their desired quality, complaints will be an indication of inefficiencies in the operational process. | |
| (24) | Availability of traceability system52, 50 | Literature | Traceability is the capacity to monitor and/or trace product movements, encompassing both fresh manufacturing and industrial distribution networks. Traceability denotes the unique identification of items, the documentation of product identity at important stages of manufacturing and distribution, and the systematic collection, processing, and storage of information. | |
| (25) | Customer Satisfaction Index (CSI)64, 65, 66 | Literature | A metric used to measure the overall level of customer satisfaction with a product, service, or experience provided by a company. |
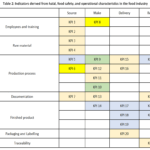 |
Table 2: Indicators derived from halal, food safety, and operational characteristics in the food industry |
Materials and Methods
The objective of this research was to determine the indicators impacting operational performance within the food industry and analyze the hierarchical relationships between them. The ISM method is often used in research to create a hierarchical structure model that illustrates the causal relationships between indicators and classifies indicator variables to understand the interdependencies within a complex system67,68. Systems with many elements are more comprehensible when depicted through a hierarchical structure than a network structure69. Food supply chains are complicated, so the ISM approach is suitable for identifying and analyzing the relationship of operational performance indicators within the food industry, as validated by a panel of experts.
Operational performance indicators were determined using a thorough literature review and interviews with the members of the panel. To guarantee the integrity of the Delphi results, the Delphi procedure included a panel of seven carefully selected panelists, each possessing over five years of expertise in halal, food safety, and food company operations. The panel consisted of both practitioners and academics. Panelists were chosen using a non-probability selection method referred to as snowball sampling, to ensure that only experts with direct experience 68.This organized and iterative methodology guaranteed the systematic use of the Delphi technique, integrating varied knowledge to produce robust and credible results. The Delphi technique was used to manage, compile, and analyze expert comments, as well as to evaluate the relevant literature through the perspectives of the experts’ 67,70. DEMATEL is a structural approach that understands the interaction between indicators of a system through causal diagrams71,72. This study employed the Delphi procedure within the DEMATEL framework to achieve consensus without in-person meetings, therefore mitigating social contact and pressure that may influence the panelists’ responses 69. This study applied the Delphi technique over two iterations. During the first iteration, the panelists responded to questionnaires for approximately 40 minutes, assisted by the researchers via Zoom. In the second iteration, they conducted a review after receiving the average answer scores from the first iteration. During this process, no panelist changed their answers. The list of panelists can be observed in Table 3.
Table 3: Panelist profiles
| NO | Status | Education | Work Experience (Years) | Field | Job Title |
| 1. | Professional & Academic | Doctoral Degree | 16 | Halal & Food Safety | Lecturer & Manager of Halal Inspection Agency |
| 2. | Professional & Academic | Doctoral Degree | 28 | Halal | Lecturer & head of Halal Inspection Agency |
| 3. | Professional | Bachelor’s Degree | 15 | Halal & Food Safety | Lead Auditor Food Safety, Halal Assessor |
| 4. | Professional | Bachelor’s Degree | 10 | Halal & Food Safety | Manager of Quality Control |
| 5. | Professional | Bachelor’s Degree | 10 | Halal & Food Safety | Auditor of Food safety & Halal |
| 6. | Professional | Master’s Degree | 15 | Halal | Auditor of Food safety & Halal |
| 7. | Professional | Master’s Degree | 12 | Halal & Food Safety | Auditor of Food safety & Halal |
Gunawan 69 integrated DEMATEL and ISM to structurally model the interaction among barriers in a traceability system. As a comprehensive methodology, DEMATEL consolidates group knowledge to construct structural models that reveal causal links among complex indicators. ISM complements this by structuring and visualizing the indicators in a directional graph (diagram), with its procedure necessitating the development of the structural self-interaction matrix (SSIM) questionnaire to generate group assessments 73. Meanwhile, DEMATEL enables the Delphi technique, which enables the drawing of comparable conclusions without the necessity of formal meetings. The use of the Delphi technique in the DEMATEL questionnaire can combine expert consensus with causal relationship analysis, making it more efficient. The integration of DEMATEL and ISM is achieved when the total relationship matrix from DEMATEL is transformed into the initial reachability matrix required by ISM. The final reachability matrix (ISM) then serves as the basis for the MICMAC analysis, which is vital for system development. MICMAC enriches and sharpens the analysis 69.This data processing series is assisted by Excel for calculations and Visio for depicting the hierarchy chart.The DEMATEL-ISM-MICMAC procedure is outlined below:
Designing the questionnaire
The questionnaire is designed from a list of indicators according to the literature review and expert perspectives. A sample can be seen in Table 4. This questionnaire contains F = {f1; f2; … ; fn}, arranging the relationship between the indicators. The questionnaire was assessed by the experts by adding the value of each relationship between the indicators from the fi indicator to the fj indicator using an integer scale of 0 to 4:0 = not having an influence; 1 = low influence; 2 = moderate influence; 3 = highly influence; 4 = very strong influence.
Sufficient employees (1) has ____X___ influence on ____Y____
Table 4: The questionnaire sample.
| Indicator (X) | KPI
Code |
Indicator (Y) | ||||
| 0 | 1 | 2 | 3 | 4 | ||
| 2 | Employee knowledge evaluation | |||||
| 3 | Sufficient raw materials | |||||
| 4 | Number of materials not contaminated by non-FSH substances | |||||
| 5 | Operational cost | |||||
| 6 | Availability of sanitation | |||||
| 7 | Suppliers with halal, HACCP/ISO 22000 certification | |||||
| 8 | Percentage of employee awareness (cleanliness) | |||||
| 9 | Percentage of compliance in product handling & animal welfare | |||||
| 10 | Percentage of compliance with facility cleanliness inspection results | |||||
| 11 | Number of defective FSH products (WIP) | |||||
| 12 | Separation of halal and non-halal facilities | |||||
| 13 | Documentation | |||||
| 14 | Production Rate | |||||
| 15 | Compliance with storage facility specifications | |||||
| 16 | Number of warehouse facility inspections | |||||
| 17 | Percentage of product stock shortages | |||||
| 18 | On-Time Delivery Rate | |||||
| 19 | Percentage of accuracy in order quantity and type | |||||
| 20 | Compliance with halal labelling and clarity of composition | |||||
| 21 | Availability of procedures for handling defective FSH products | |||||
| 22 | Percentage of defective products | |||||
| 23 | Number of customer complaints | |||||
| 24 | Availability of traceability system | |||||
| 25 | Customer Satisfaction Index (CSI) | |||||
Determining the initial direct-relation matrix (A)
This study considers H experts and indicators. Each expert generates an n x n non-negative matrix Xk = n x n, with 1 ≤ k ≤ H. The average matrix A, or initial direct-relation matrix, is subsequently derived to capture the collective influence dynamics among the elements. This matrix indicates the initial direct influence of each element given to and received from other elements. Given the involvement of 7 experts and 25 indicators in this study, the resulting initial direct-relation matrix is presented in Table 5.
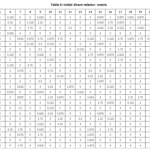 |
Table 5: Initial direct-relation matrix |
Normalizing the initial direct-relation matrix (A) into a normalized direct-relation matrix (G)
The score scale used by each researcher can vary. Therefore, the initial direct relationship matrix needs to be normalized with G = [gij]n x n and 0 < gij< 1. The normalization result is presented in Table 6.
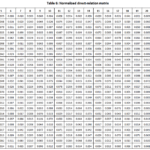 |
Table 6: Normalized direct-relation matrix |
Calculating the total relation matrix (T)
Calculating the total relation matrix is necessary because the normalization process creates a distinction between the elements (gij) of the matrix of G values. The compilation of the total relation matrix T = [tij]n x n strengthens the value of each element, so that elements that actually affect each other can be distinguished from elements that have no effect. The total relation matrix can be seen in Table 7.
Table 7: Total relation matrix
| F | 1 | 2 | 3 | 4 | 5 | 6 | 7 | 8 | 9 | 10 | 11 | 12 | 13 | 14 | 15 | 16 | 17 | 18 | 19 | 20 | 21 | 22 | 23 | 24 | 25 |
| 1 | 0 | 0 | 0 | 0 | 0 | 0 | 0 | 0 | 1 | 0 | 0 | 0 | 0 | 0 | 0 | 0 | 0 | 1 | 0 | 0 | 0 | 1 | 0 | 0 | 0 |
| 2 | 0 | 0 | 0 | 1 | 1 | 0 | 0 | 1 | 1 | 0 | 1 | 1 | 0 | 1 | 1 | 1 | 0 | 0 | 1 | 1 | 1 | 0 | 0 | 0 | 0 |
| 3 | 0 | 1 | 0 | 1 | 1 | 0 | 1 | 1 | 1 | 0 | 0 | 1 | 0 | 0 | 1 | 0 | 0 | 0 | 1 | 0 | 0 | 1 | 0 | 0 | 0 |
| 4 | 0 | 1 | 1 | 0 | 0 | 1 | 1 | 1 | 0 | 0 | 1 | 1 | 0 | 0 | 1 | 0 | 0 | 0 | 0 | 0 | 0 | 0 | 0 | 0 | 0 |
| 5 | 1 | 1 | 1 | 1 | 1 | 1 | 1 | 1 | 1 | 1 | 1 | 1 | 0 | 1 | 1 | 1 | 1 | 1 | 1 | 1 | 1 | 1 | 1 | 0 | 0 |
| 6 | 0 | 0 | 0 | 0 | 1 | 0 | 0 | 0 | 1 | 0 | 0 | 0 | 0 | 0 | 1 | 0 | 0 | 0 | 0 | 0 | 0 | 0 | 0 | 0 | 0 |
| 7 | 0 | 0 | 0 | 0 | 1 | 0 | 0 | 0 | 1 | 0 | 0 | 0 | 0 | 0 | 0 | 0 | 1 | 0 | 0 | 0 | 0 | 0 | 0 | 0 | 0 |
| 8 | 0 | 1 | 0 | 0 | 1 | 0 | 0 | 0 | 1 | 0 | 0 | 1 | 0 | 1 | 0 | 0 | 1 | 0 | 0 | 0 | 0 | 0 | 0 | 0 | 0 |
| 9 | 0 | 1 | 1 | 1 | 1 | 1 | 1 | 0 | 1 | 0 | 0 | 1 | 0 | 0 | 0 | 0 | 1 | 0 | 0 | 0 | 0 | 0 | 1 | 0 | 0 |
| 10 | 0 | 1 | 0 | 0 | 0 | 0 | 0 | 1 | 1 | 0 | 0 | 1 | 0 | 0 | 0 | 0 | 0 | 0 | 0 | 0 | 0 | 0 | 0 | 0 | 0 |
| 11 | 0 | 1 | 1 | 1 | 0 | 0 | 1 | 0 | 1 | 1 | 0 | 1 | 0 | 1 | 0 | 0 | 0 | 0 | 0 | 0 | 0 | 0 | 0 | 0 | 0 |
| 12 | 0 | 1 | 0 | 0 | 1 | 0 | 0 | 0 | 1 | 0 | 0 | 0 | 0 | 0 | 0 | 0 | 0 | 0 | 0 | 0 | 0 | 0 | 0 | 0 | 0 |
| 13 | 0 | 1 | 1 | 1 | 1 | 1 | 1 | 1 | 1 | 1 | 1 | 1 | 0 | 1 | 1 | 1 | 1 | 1 | 1 | 1 | 1 | 1 | 1 | 0 | 1 |
| 14 | 0 | 1 | 1 | 1 | 0 | 0 | 1 | 0 | 1 | 0 | 1 | 1 | 0 | 0 | 1 | 0 | 1 | 0 | 0 | 0 | 0 | 1 | 0 | 1 | 0 |
| 15 | 0 | 1 | 0 | 0 | 1 | 0 | 0 | 0 | 1 | 0 | 0 | 1 | 1 | 0 | 0 | 0 | 0 | 0 | 0 | 0 | 0 | 0 | 0 | 0 | 0 |
| 16 | 0 | 1 | 1 | 0 | 1 | 0 | 0 | 0 | 1 | 1 | 0 | 0 | 0 | 1 | 1 | 0 | 0 | 1 | 1 | 0 | 0 | 0 | 0 | 0 | 0 |
| 17 | 0 | 0 | 1 | 1 | 0 | 0 | 0 | 0 | 1 | 0 | 1 | 0 | 0 | 1 | 1 | 0 | 0 | 0 | 0 | 0 | 0 | 0 | 0 | 0 | 0 |
| 18 | 0 | 0 | 1 | 0 | 0 | 0 | 0 | 0 | 1 | 0 | 1 | 0 | 0 | 1 | 0 | 0 | 1 | 0 | 1 | 0 | 0 | 1 | 0 | 0 | 0 |
| 19 | 0 | 1 | 1 | 0 | 0 | 0 | 0 | 0 | 1 | 0 | 1 | 0 | 1 | 1 | 1 | 1 | 1 | 0 | 0 | 0 | 0 | 0 | 1 | 0 | 0 |
| 20 | 1 | 1 | 0 | 1 | 1 | 1 | 1 | 0 | 1 | 1 | 1 | 1 | 1 | 0 | 1 | 1 | 0 | 0 | 0 | 0 | 1 | 0 | 0 | 1 | 1 |
| 21 | 0 | 1 | 0 | 0 | 0 | 0 | 0 | 0 | 1 | 0 | 0 | 0 | 1 | 1 | 0 | 0 | 0 | 0 | 0 | 0 | 0 | 1 | 0 | 0 | 1 |
| 22 | 0 | 1 | 1 | 1 | 0 | 0 | 1 | 0 | 1 | 0 | 1 | 1 | 0 | 1 | 1 | 1 | 0 | 0 | 1 | 0 | 0 | 0 | 0 | 0 | 0 |
| 23 | 0 | 0 | 0 | 0 | 0 | 0 | 0 | 0 | 1 | 0 | 1 | 0 | 0 | 1 | 1 | 0 | 1 | 1 | 1 | 1 | 0 | 1 | 0 | 0 | 0 |
| 24 | 0 | 1 | 0 | 0 | 1 | 0 | 1 | 0 | 1 | 0 | 0 | 1 | 1 | 1 | 0 | 0 | 0 | 0 | 0 | 0 | 1 | 0 | 1 | 0 | 1 |
| 25 | 0 | 1 | 0 | 0 | 0 | 0 | 1 | 0 | 1 | 0 | 1 | 1 | 0 | 1 | 1 | 0 | 1 | 1 | 1 | 1 | 1 | 1 | 1 | 1 | 0 |
Converting the total-relation matrix (T) to the initial reachability matrix (K)
The total-relation matrix represents the complex dependencies among the observed indicators. A meaningful relationship between the fi indicator and the fj indicator is indicated by tij greater than or equal to the threshold value. The threshold value (α) is the average value in the total relation matrix. The initial reachability matrix is derived by transforming the total-relation matrix T into a binary matrix K, where values are expressed as 0 or 1 based on the threshold criterion. The conversion process and the resulting matrix K are detailedin Table 8.
Table 8: Initial reachability matrix
|
F |
1 | 2 | 3 | 4 | 5 | 6 | 7 | 8 | 9 | 10 | 11 | 12 | 13 | 14 | 15 | 16 | 17 | 18 | 19 | 20 | 21 | 22 | 23 | 24 | 25 |
| 1 | 0 | 0 | 0 | 0 | 0 | 0 | 0 | 0 | 1 | 0 | 0 | 0 | 0 | 0 | 0 | 0 | 0 | 1 | 0 | 0 | 0 | 1 | 0 | 0 |
0 |
|
2 |
0 | 0 | 0 | 1 | 1 | 0 | 0 | 1 | 1 | 0 | 1 | 1 | 0 | 1 | 1 | 1 | 0 | 0 | 1 | 1 | 1 | 0 | 0 | 0 | 0 |
| 3 | 0 | 1 | 0 | 1 | 1 | 0 | 1 | 1 | 1 | 0 | 0 | 1 | 0 | 0 | 1 | 0 | 0 | 0 | 1 | 0 | 0 | 1 | 0 | 0 |
0 |
|
4 |
0 | 1 | 1 | 0 | 0 | 1 | 1 | 1 | 0 | 0 | 1 | 1 | 0 | 0 | 1 | 0 | 0 | 0 | 0 | 0 | 0 | 0 | 0 | 0 | 0 |
| 5 | 1 | 1 | 1 | 1 | 1 | 1 | 1 | 1 | 1 | 1 | 1 | 1 | 0 | 1 | 1 | 1 | 1 | 1 | 1 | 1 | 1 | 1 | 1 | 0 |
0 |
|
6 |
0 | 0 | 0 | 0 | 1 | 0 | 0 | 0 | 1 | 0 | 0 | 0 | 0 | 0 | 1 | 0 | 0 | 0 | 0 | 0 | 0 | 0 | 0 | 0 | 0 |
| 7 | 0 | 0 | 0 | 0 | 1 | 0 | 0 | 0 | 1 | 0 | 0 | 0 | 0 | 0 | 0 | 0 | 1 | 0 | 0 | 0 | 0 | 0 | 0 | 0 |
0 |
|
8 |
0 | 1 | 0 | 0 | 1 | 0 | 0 | 0 | 1 | 0 | 0 | 1 | 0 | 1 | 0 | 0 | 1 | 0 | 0 | 0 | 0 | 0 | 0 | 0 | 0 |
| 9 | 0 | 1 | 1 | 1 | 1 | 1 | 1 | 0 | 1 | 0 | 0 | 1 | 0 | 0 | 0 | 0 | 1 | 0 | 0 | 0 | 0 | 0 | 1 | 0 |
0 |
|
10 |
0 | 1 | 0 | 0 | 0 | 0 | 0 | 1 | 1 | 0 | 0 | 1 | 0 | 0 | 0 | 0 | 0 | 0 | 0 | 0 | 0 | 0 | 0 | 0 | 0 |
| 11 | 0 | 1 | 1 | 1 | 0 | 0 | 1 | 0 | 1 | 1 | 0 | 1 | 0 | 1 | 0 | 0 | 0 | 0 | 0 | 0 | 0 | 0 | 0 | 0 |
0 |
|
12 |
0 | 1 | 0 | 0 | 1 | 0 | 0 | 0 | 1 | 0 | 0 | 0 | 0 | 0 | 0 | 0 | 0 | 0 | 0 | 0 | 0 | 0 | 0 | 0 | 0 |
| 13 | 0 | 1 | 1 | 1 | 1 | 1 | 1 | 1 | 1 | 1 | 1 | 1 | 0 | 1 | 1 | 1 | 1 | 1 | 1 | 1 | 1 | 1 | 1 | 0 |
1 |
|
14 |
0 | 1 | 1 | 1 | 0 | 0 | 1 | 0 | 1 | 0 | 1 | 1 | 0 | 0 | 1 | 0 | 1 | 0 | 0 | 0 | 0 | 1 | 0 | 1 | 0 |
| 15 | 0 | 1 | 0 | 0 | 1 | 0 | 0 | 0 | 1 | 0 | 0 | 1 | 1 | 0 | 0 | 0 | 0 | 0 | 0 | 0 | 0 | 0 | 0 | 0 |
0 |
|
16 |
0 | 1 | 1 | 0 | 1 | 0 | 0 | 0 | 1 | 1 | 0 | 0 | 0 | 1 | 1 | 0 | 0 | 1 | 1 | 0 | 0 | 0 | 0 | 0 | 0 |
| 17 | 0 | 0 | 1 | 1 | 0 | 0 | 0 | 0 | 1 | 0 | 1 | 0 | 0 | 1 | 1 | 0 | 0 | 0 | 0 | 0 | 0 | 0 | 0 | 0 |
0 |
|
18 |
0 | 0 | 1 | 0 | 0 | 0 | 0 | 0 | 1 | 0 | 1 | 0 | 0 | 1 | 0 | 0 | 1 | 0 | 1 | 0 | 0 | 1 | 0 | 0 | 0 |
| 19 | 0 | 1 | 1 | 0 | 0 | 0 | 0 | 0 | 1 | 0 | 1 | 0 | 1 | 1 | 1 | 1 | 1 | 0 | 0 | 0 | 0 | 0 | 1 | 0 |
0 |
|
20 |
1 | 1 | 0 | 1 | 1 | 1 | 1 | 0 | 1 | 1 | 1 | 1 | 1 | 0 | 1 | 1 | 0 | 0 | 0 | 0 | 1 | 0 | 0 | 1 | 1 |
| 21 | 0 | 1 | 0 | 0 | 0 | 0 | 0 | 0 | 1 | 0 | 0 | 0 | 1 | 1 | 0 | 0 | 0 | 0 | 0 | 0 | 0 | 1 | 0 | 0 |
1 |
|
22 |
0 | 1 | 1 | 1 | 0 | 0 | 1 | 0 | 1 | 0 | 1 | 1 | 0 | 1 | 1 | 1 | 0 | 0 | 1 | 0 | 0 | 0 | 0 | 0 | 0 |
| 23 | 0 | 0 | 0 | 0 | 0 | 0 | 0 | 0 | 1 | 0 | 1 | 0 | 0 | 1 | 1 | 0 | 1 | 1 | 1 | 1 | 0 | 1 | 0 | 0 |
0 |
|
24 |
0 | 1 | 0 | 0 | 1 | 0 | 1 | 0 | 1 | 0 | 0 | 1 | 1 | 1 | 0 | 0 | 0 | 0 | 0 | 0 | 1 | 0 | 1 | 0 | 1 |
| 25 | 0 | 1 | 0 | 0 | 0 | 0 | 1 | 0 | 1 | 0 | 1 | 1 | 0 | 1 | 1 | 0 | 1 | 1 | 1 | 1 | 1 | 1 | 1 | 1 |
0 |
Checking the transitivity and establishing the final reachability matrix K0
This stage uses Boolean multiplication and the addition theory of sets. The conclusion arises due to some indirect relationships that the concept of transitivity eliminates, for example, if aàb a is related to b and bàc b is related to c, it can be concluded that a àc a is related to c. The final reachability matrix can be seen in Table 9.
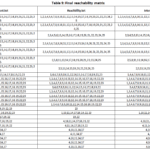 |
Table 9: Final reachability matrix |
Defining the reachability set and the antecedent set
Each element’s reachability set is composed of specific elements. In the interim, the antecedent set of each element comprises elements that constitute specific elements 74. In technical terms, the reachability set RSi of an element system is a collection of elements that correspond to the columns, where all elements in row i of the final reachability matrix are ‘1’. The antecedent set ASi of the element system is a collection of elements that correspond to the rows, where all elements in column i of the final reachability matrix are ‘1’. These sets provide the basis for partitioning the elements into distinct levels, and the results for each indicator are summarized in Table 9.
Compiling the hierarchical structure
Partition levels are obtained from the reachability set (RS), the antecedent set (AS), and the final reachability matrix. The RS of an attribute is the set an indicators in the row with a value of ‘1’, including the indicator itself. The US for an indicator is an indicator that is in the column with a value of ‘1’, including the indicator itself. Thus, the intersection set IS is identified by selecting the same indicator from the US and the RS. The RS and IS attributes are the same, occupying the top position in the ISM model. The indicator that occupies the top level is then separated from that level, and the same process is continued to obtain the position of the other indicators. The iteration process is shown in Table 10.
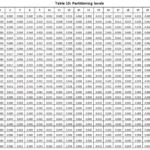 |
Table 10: Partitioning levels |
Generating the diagram
A diagram is drawn based on the final reachability matrix. The indicators placed above are indicators that are at level 1. Indicators that are at level 2 are below the level 1 indicators and are therefore at the next level. The Operational Performance Indicator Model is illustrated in Figure 1.
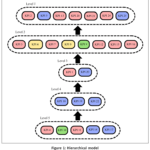 |
Figure 1: Hierarchical model |
Determining the Value of Driving Power and Dependence Power using the MICMAC diagram
The MICMAC diagram utilizes the X-axis (Dependence Power) and the Y-axis (Driving Power). The driving power and dependence power values of indicators were used as input to classify the indicators into four groups (Figure 2): The MICMAC diagram utilizes the X-axis (Dependence Power) and the Y-axis (Driving Power). The value-driving power and dependence power of indicators were used as input to classify the indicators into four groups (Figure 2): Autonomous (Quadrant I): Indicators characterized by both low driving power and low dependence power, indicating weak interaction with the system; Dependent (Quadrant II): Indicators with weak driving power but high dependence power, meaning they are primarily influenced by other indicators in the system; Linkage (Quadrant III): Indicators featuring both high driving power and dependence power. These are inherently unstable, as any change in these indicators can trigger feedback loops and affect the entire system; Independent (Quadrant IV): Indicators possessing high driving power but low dependence power. Often referred to as the influence group, these factors serve as the primary drivers of the system.
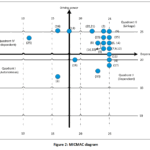 |
Figure 2: MICMAC diagram |
Results
At the beginning of the collection of indicators through the literature review, the indicators were categorized based on the four main operational processes in the supply chain, namely, source, make, deliver, and return. A total of 25 indicators were obtained, which were then translated into a questionnaire. This questionnaire was given to the panelists to assess the influence of the relationship between the indicators. The questionnaire responses were then analyzed based on the operational processes according to the stages in the methodology.
The model built with the ISM approach produced a relationship between the indicators in the form of a hierarchical structure with five levels. At level 5, there were five indicators: KPI 4 (Number of materials not contaminated by non-FSH substances), KPI 10 (Percentage of compliance with facility cleanliness inspection results), KPI 11 (Number of defective FSH products (WIP)), KPI 14 (Production rate), and KPI 17 (Percentage of product stock shortages). These five indicators affect the indicators above. These indicators can be said to be the root of the problem if there are problems in the company’s operational performance.
At level 4, there were three indicators: KPI 18 (On-time delivery rate), KPI 19 (Percentage of accuracy in order quantity and type), and KPI 22 (Percentage of defective products). These indicators are influenced by indicators at previous levels, i.e., KPI 4 (Number of materials not contaminated by non-FSH substances), KPI 10 (Percentage of compliance with facility cleanliness inspection results), KPI 11 (Number of defective FSH products (WIP)), and KPI 14 (Production rate and percentage of product stock shortages). For example, if the indicator KPI 4 (Number of materials not contaminated by non-FSH substances) is not managed, it will directly affect the indicators KPI 11 (Percentage of defective products) and KPI 18 (On-time delivery rate indicators).
At level 3, there are two indicators, namely KPI 1 (Sufficient employees) and KPI 23 (Number of customer complaints). Both indicators at level 3 are influenced by the indicators at two levels below them and affect the indicators that are two levels above them. If the indicator KPI 18 (On-time delivery rate) is problematic, it will affect the indicator KPI 23 (Number of customer complaints), and in addition to that, it will also affect the indicator KPI 1 (Sufficient employees) to pursue the delivery target.
Level 2 has eight indicators: KPI 3 (Sufficient raw materials), KPI 6 (Availability of sanitation), KPI 7 (Suppliers with HACCP/ISO 22000 halal certification), KPI 8 (Percentage of employee awareness (cleanliness)), KPI 9 (Percentage of compliance in product handling and animal welfare), KPI 12 (Separation of halal and non-halal facilities), KPI 15 (Compliance with storage facility specifications), KPI 16 (Number of warehouse facility inspections). Indicators at level 2 are influenced by the indicators KPI 1 (Sufficient employees) and KPI 23 (Number of customer complaints) at the previous level.
At the final level of the ISM hierarchy, the indicators are: KPI 2 (Employee knowledge evaluation), KPI 5 (Operational cost), KPI 13 (Documentation), KPI 20 (Compliance with halal labeling and clarity of composition), KPI 21 (Availability of procedures for handling defective FSH products), KPI 24 (Availability of traceability system), and KPI 25 (Customer satisfaction index (CSI)). Analysis showed that seven driving indicators accounted for over 25% at the highest position in the hierarchy, where they have the most direct impact on operational performance.
The MICMAC results (Figure 2) show that Quadrant I – autonomous (Sufficient employees) includes indicators with limited driving power (influence) and minimal dependency. Further, Quadrant II – dependent (Number of materials not contaminated by non-FSH substances, Percentage of compliance with facility cleanliness inspection results, Number of defective FSH products (WIP), Production rate, Percentage of product stock shortages) created a group of indicators with weak influence but dependency. Furthermore, Quadrant III – interdependent or linkage (Employee knowledge evaluation, Sufficient raw materials, Operational cost, Availability of sanitation, Suppliers with HACCP/ISO 22000 halal certification, Percentage of employee awareness (cleanliness), Percentage of compliance in product handling and animal welfare, Number of defective FSH products (WIP), Separation of halal and non-halal facilities, Documentation, Production rate, Compliance with storage facility specifications, Number of warehouse facility inspections, Percentage of accuracy in order quantity and type, Compliance with halal labeling and clarity of composition, Availability of procedures for handling defective FSH products, Percentage of defective products, Number of customer complaints) created up of indicators with strong influence. Finally, Quadrant IV – driving or independent (Availability of traceability system, Customer satisfaction index (CSI)) consists of elements with strong influence and weak dependency. From the MICMAC diagram, it can be seen that the operational performance indicators are spread across all four Quadrants. This means that there are indicators that have a reciprocal influence, while others function as indicators that trigger or are recipients of influence in one direction.
Discussion
This research analyzed comprehensive operational performance indicators associated with halal and food safety requirements in the food industry. The relationships between the indicators can help identify the key indicators that drive operational performance in the food industry. Indicator mapping with an activity approach to business processes (source, make, deliver, return) can make it easier to identify important indicators within each activity. From the results of the analysis process, 25 indicators were obtained that form a five-level hierarchical structure.
The study also visually presents the results using the DEMATEL-ISM-MICMAC approach to show the most dominant driving indicators in operational performance and the important relationships between these indicators. By knowing the indicators that drive operational performance, we can formulate a model for appropriate and comprehensive strategies and policies to maximize a company’s performance.
Five indicators are driving factors (Level 5), KPI 4 (Number of materials not contaminated by non-FSH substances), KPI 10 (Percentage of compliance with facility cleanliness inspection results), KPI 11 (Number of defective FSH products (WIP)), KPI 14 (Production Rate), and KPI 17 (Percentage of product stock shortages). The indicator KPI 4 (Number of materials not contaminated by non-FSH substances) can be one of the root problems in operational performance. Compliance with this indicator is crucial and is the main foundation in maintaining product integrity based on halal and food safety standards58. Raw food materials that comply with food safety requirements must be free from chemical, physical, and biological hazards, while food that complies with halal requirements must be free from haram elements such as alcohol, pork, blood, and their derivatives75. A sequence of production processes will be implemented to ensure that raw materials undergo the following: if there are materials contaminated with non-FSH materials, there can be disruptions such as production downtime, increased costs due to the need to replace raw materials, and delays in the production and distribution33, which will indirectly affect the company’s performance58.
Indicator KPI 10 (Percentage of compliance with facility cleanliness inspection results) relies significantly on cleanliness, especially in facilities along halal logistics. Hygiene inspections are part of food safety standards HACCP, ISO 22000, and FSSC 22000, in addition to satisfying the halal and food safety standards, but the implementation of hygiene must also be carried out with a deep understanding and obedience to Sharia requirements76. This is because failure to maintain the cleanliness of the facility can result in incompatibilities in the production process, such as cross-contamination between halal and haram ingredients, damp facilities, and pathogenic microbial growth 43. Moreover, if there is no control of pathogenic microbes to prevent them from reaching the consumer’s hands, they may cause infections31.
Indicator KPI 11 (Number of defective FSH products (WIP)) measures the number of semi-finished products that do not comply with quality, food safety (chemical, physical, and biological), or halal standards. The impact of this important indicator affects other indicators, such as KPI 22 (Percentage of defective products) and KPI 18 (On-time delivery rate). This is due to the disruption of the production schedule due to the additional time needed for product reworking or even product destruction. According to Government Regulation BPOM No. 22 (2025), destruction must be carried out if the product contains toxic, harmful, or hazardous materials that may endanger human health or life; contains contaminants that exceed the maximum threshold; contains materials that are not permitted for use in the manufacture of food activities, or processes, and/or distribution; comprises plant or animal materials that are filthy, rotten, rancid, decomposed, or diseased, materials that come from carcasses, materials that are manufactured in a manner that is not permissible, and/or expired products.
KPI 14 (Production rate) is an indicator that measures the speed of production. It is important to maintain the production rate for smooth operation. An increase in production rate that is not offset by quality control can affect the indicator KPI 22 (Percentage of defective products), so that there is a decrease in quality. Furthermore, this may result in a rise in indicator KPI 23 (Number of customer complaints).
The next indicator is KPI 17 (Percentage of product stock shortages). This indicator measures the sufficiency of product stock against market demand. An imbalance between demand and production can lead to overproduction or a shortage of products 58. leading to a possibility of affecting the indicators KPI 5 (Operational cost) and KPI 25 (Customer satisfaction index (CSI)).
The MICMAC diagram in Figure 2 illustrates that the indicators in the influence group are KPI 24 (Availability of traceability system) and KPI 25 (Customer satisfaction index (CSI)). These two indicators have a strong influence. Looking at the hierarchical model in Figure 1, it can be seen that both of these indicators are at level 1. At the summit of the hierarchy are the driving indicators, which means they have the greatest direct impact on operational performance. Meanwhile, the other five indicators at level 1 of the hierarchical model – KPI 2 (Evaluation of employee knowledge), KPI 5 (Operational cost), KPI 13 (Documentation), KPI 20 (Compliance with halal labeling and clarity of composition), and KPI 24 (Availability of procedures to deal with defective FSH products) – are in Quadrant III (Linkage), which means that these indicators are the main drivers but are influenced by many indicators below them. Thus, the management of these five indicators needs to be prioritized so that their mutual impact does not cause problems in the company’s activities.
It’s also important to see how these specific results align with other research on halal certification and food safety laws. Unlike studies that identify automated warehousing and environmentally friendly packaging as important factors for maintaining halal certification based on big data, this study highlights facility cleanliness (KPI 10) and traceability (KPI 24) as crucial components. The DEMATEL-ISM-MICMAC framework, on the other hand, demonstrates a more complex causal relationship between indicators. This method differs from text-based big data capture. This methodological difference highlights the importance of defining interdependencies and explains why indicators such as raw material integrity (KPI 4) are considered a key driver.
Conclusion
This study found that there are 25 indicators that can reflect operational performance and can be integrated into halal and food safety certification, which answers RQ1. Eight indicators are related to operations in general, two indicators reflect food safety aspects, two indicators reflect halal aspects, and fourteen indicators reflect combined halal and food safety aspects. These indicators are spread out over general operations, food safety, halal, and both halal and food safety. From the mapping of these indicators, it can be concluded that the halal and food safety aspects are closely related. The study also answers RQ2 by using the DEMATEL-ISM-MICMAC method to map out causal relationships between indicators and find important points of connection. The results emphasize the importance of two strong driver indicators (Traceability systems and Customer satisfaction) and five connecting indicators (Evaluation of employee knowledge, Operational costs, Documentation, Halal labeling compliance, and Defective product handling procedures), which serve as critical nodes in business processes. Managers must conduct targeted audits and verifications before products reach the market to prevent consumer dissatisfaction and regulatory violations. By embedding these linkage indicators into dashboards and internal audits, managers can anticipate how changes in one area might impact others and intervene early to stabilize operations. In this way, linkage indicators become proactive tools for maintaining halal integrity, ensuring food safety compliance, and maintaining consumer trust, rather than passive measures that only reveal problems after they occur. Organizations can improve the effectiveness of halal food production, minimize risks, and enhance resilience by incorporating these indicators into operational strategies. Future research should focus on developing tailored strategies for each critical indicator in a specific business process, thereby enabling companies to improve their operational performance and competitiveness in the global halal market.
Acknowledgement
The authors are thankful to Institut Teknologi Nasional for funding this research.
Funding Sources
The author received study and publication funding from the institution referring to the doctoral advanced study guidelines for permanent lecturers at the National Institute of Technology with No 113/N.07/SK-Rektor/ItensNI 11/2025.
Conflict of Interest
The author(s) do not have any conflict of interest.
Data Availability Statement
The manuscript incorporates all datasets produced or examined throughout this research study
Ethics Statement
This research did not involve human participants, animal subjects, or any material that requires ethical approval.
Informed Consent Statement
This study did not involve human participants, and therefore, informed consent was not required.
Clinical Trial Registration
This research does not involve any clinical trials.
Permission to reproduce material from other sources
Not Applicable
Author Contributions
- Melati Kurniawati: Conceptualization, Writing-Original Draft, Introduction, Literature Review, Method, Data Collection, Analysis
- Patdono Suwignjo: Introduction, Supervision, Corresponding author
- Iwan Vanany: Conceptualization, Method, Analysis, Supervision
- Bambang Syairudin: Analysis, Conclusion, Supervision
References
- World population. Population Today. https://populationtoday.com/. Published 2025.
- PRB World Population 2024: Data Sheet. Population Reference Bureau. https://2024-wpds.prb.org/wp-content/uploads/2024/09/2024-World-Population-Data-Sheet-Booklet-1.pdf. Published 2024.
- Luning PA, Marcelis illem J. Food Quality Management: Technological and Managerial Principles and Practices. Wageningen: Wageningen Academic Publishers; 2002. doi:10.3920/978-90-8686-899-5
CrossRef - Engdaw GT, Tesfaye AH, Worede EA. Heliyon Food handlers ’ practices and associated factors in public food establishments in Gondar , Ethiopia 2021 / 2022. Heliyon. 2023;9(4):e15043. doi:10.1016/j.heliyon.2023.e15043
CrossRef - Yu H, Song Y, Lv W, et alFood safety risk assessment and countermeasures in China based on risk matrix method. Front Sustain Food Syst. 2024;(April):1-13. doi:10.3389/fsufs.2024.1351826
CrossRef - Al-Ansi A, Olya HGT, Han H. Effect of general risk on trust, satisfaction, and recommendation intention for halal food. … J Hosp Manag. 2019;83:210-219. doi:10.1016/j.ijhm.2018.10.017
CrossRef - Number of people by religion. https://ourworldindata.org/grapher/number-of-people-by-religion. Published 2020.
- Mor RS, Bhardwaj A, Singh S. Benchmarking the interactions among performance indicators in dairy supply chain: An ISM approach. Benchmarking. 2018;25(9):3858-3881. doi:10.1108/BIJ-09-2017-0254
CrossRef - Ali MH, Tan KH, Pawar K, et al. Extenuating food integrity risk through supply chain integration: The case of halal food. Ind Eng Manag Syst. 2014;13(2):154-162. https://www.researchgate.net/profile/Zafir_Mohd_Makhbul/ publication/269778548_ Extenuating _Food _Integrity_Risk_through_Supply_Chain_Integration_ The_Case_of_Halal_Food/links/565dade008ae1ef929832f69.pdf.
CrossRef - Drew CA, Clydesdale FM. New Food Safety Law: Effectiveness on the Ground. Crit Rev Food Sci Nutr. 2015;55(5):689-700. doi:10.1080/10408398.2011.654368
CrossRef - Zulfakar MH, Chan C, Jie F. Institutional forces on Australian halal meat supply chain (AHMSC) operations. J Islam Mark. 2018;9(1):80-98.
CrossRef - Rahim ZA, Voon B, Mahdi R. The Impact of Service Quality on Business Commitment in Contract Manufacturing Services : An Exploratory Study of F & B Industry in Malaysia. Int J Bus Soc. 2020;21(1):197-216.
CrossRef - Iberahim1a H, Kamarudin R, Shabudin A. Halal Development System: The Institutional Framework, Issues and Challenges for Halal Logistics. In: Business, Engineering and Industrial Applications (ISBEIA). ; 2012. https://www.researchgate.net/profile/ Hadijah_Iberahim2/publication/ 261149783_ Halal_development_system_ The_institutional_framework_issues_and_ challenges_ for_halal_logistics/links/560e3cf 708ae2aa0be4a855a.pdf.
- Wang Z, Mao Y, Gale F. Chinese consumer demand for food safety attributes in milk products. Food Policy. 2008;33(1):27-36. doi:10.1016/j.foodpol.2007.05.006
CrossRef - Ab Talib MS, Ai Chin T, Fischer J. Linking Halal food certification and business performance. Br Food J. 2017;119(7):1606-1618. doi:10.1108/BFJ-01-2017-0019
CrossRef - Liu F, Rhim H, Park K, et al. HACCP certification in food industry: Trade-offs in product safety and firm performance. Int J Prod Econ. 2021;231(June 2020):107838. doi:10.1016/j.ijpe.2020.107838
CrossRef - Tieman M. The application of Halal in supply chain management: in‐depth interviews. J Islam Mark. 2011. https://www.emerald.com/insight/content/doi/10.1108/17590831111139893/full/html?mob.
CrossRef - Kurniawati M, Suwignjo P, Vanany I, et al. Food Company Manager’s Perspective for Food Safety and Halal: Exploratory Study. In: Proceedings of the International Conference on Industrial Engineering and Operations Management. ; 2022:3351-3358.
- Fattahi F, Nookabadi AS. A model for measuring the performance of the meat supply chain. Br Food J. 2009;115(8):1090-1111. doi:10.1108/BFJ-09-2011-0217
CrossRef - Keramydas C, Papapanagiotou K, Vlachos D, et al. Risk Management for Agri ‐ food Supply Chains. In: Supply Chain Management for Sustainable Food Networks. Wiley & Sons, Ltd; 2016.
CrossRef - Yontar E, Ersöz S. Investigation of Food Supply Chain Sustainability Performance for Turkey ’ s Food Sector. Front Sustain Food Syst. 2020;4(June):1-21. doi:10.3389/fsufs.2020.00068
CrossRef - Moazzam M, Akhtar P, Garnevska E, et al. Measuring agri-food supply chain performance and risk through a new analytical framework: a case study of New Zealand dairy. Prod Plan Control. 2018;29(15):1258-1274. doi:10.1080/09537287.2018.1522847
CrossRef - Huan SH, Sheoran SK, Wang G. A review and analysis of supply chain operations reference ( SCOR ) model. Supply Chain Manag An Int J. 2004;9(1):23-29. doi:10.1108/13598540410517557
CrossRef - Thuy T, Nguyen H. Measuring Supply Chain Performance Using the SCOR Model. Oper Res Forum. 2024;5(2):1-28. doi:10.1007/s43069-024-00314-y
CrossRef - Sarasi V, Yunizar, Satmoko ND. Evaluation of halal supply chain management’s performance in culinary enterprises. Cogent Bus Manag. 2025;12(1). doi:10.1080/23311975.2024.2440128
CrossRef - APICS. Supply Chain Operations Reference Model.; 2017.
- Ali MH, Suleiman N. Eleven shades of food integrity: A halal supply chain perspective. Trends Food Sci Technol. 2018;71:216-224. doi:10.1016/J.TIFS.2017.11.016
CrossRef - Aramyan LH, Lansink AGJMO, Van Der Vorst JGAJ, et al. Performance measurement in agri-food supply chains: A case study. Supply Chain Manag An Int J. 2007;12(4):304-315. doi:10.1108/13598540710759826
CrossRef - Bigliardi B, Bottani E. Performance measurement in the food supply chain : a balanced scorecard approach. Facilities. 2010;28(5):249-260. doi:10.1108/02632771011031493
CrossRef - Sufiyan M, Haleem A, Khan S, et al. Evaluating food supply chain performance using hybrid fuzzy MCDM technique. Sustain Prod Consum. 2019;20:40-57. doi:10.1016/j.spc.2019.03.004
CrossRef - Johnson L, Shin JH, Feinstein AH, et al. Validating a food safety instrument: Measuring food safety knowledge and attitudes of restaurant employees. J Foodserv Bus Res. 2003;6(2):49-65. doi:10.1300/J369v06n02_05
CrossRef - Usman I. Halal supply chain management practice model: A case study in evidence of halal supply chain in Indonesia. Int J Innov Creat Chang. 2020;11(11):440-451.
- Fauziyah IS, Ridwan AY, Muttaqin PS. Food production performance measurement system using halal supply chain operation reference (SCOR) model and analytical hierarchy process (AHP). IOP Conf Ser Mater Sci Eng. 2020;909(1). doi:10.1088/1757-899X/909/1/012074
CrossRef - Talib HA, Ali KAM, Idris F. A Review of Relationship Between Quality Management and Organizational Performance : A Study of Food Processing SMEs. In: 2nd IEEE International Conference on Computer Science and Information Technology. ; 2009.
CrossRef - Wahyuni D, Nazaruddin, Frastika SA, et al. Performance measurement of Tempeh crackers supply chain management using Halal criteria on SCOR Model. E3S Web Conf. 2021;332. doi:10.1051/e3sconf/202133204002
CrossRef - Manning L, Baines R, Chadd S. Benchmarking the poultry meat supply chain. Benchmarking. 2008;15(2):148-165. doi:10.1108/14635770810864866
CrossRef - Mansour MM, Al-Hamdani KSM. Key Performance Indicators for Evaluating the Efficiency of Production Processes in Food Industry. Passer J Basic Appl Sci. 2024;6(2):494-504. doi:10.24271/psr.2024.450557.1555
CrossRef - Griffith CJ, Livesey KM, Clayton D. The assessment of food safety culture. Br Food J. 2010;112(4):439-456. doi:10.1108/00070701011034448
CrossRef - Sasikumar Nair S, Mazurek-Kusiak AK, Trafialek J, et al. Assessing Food Safety Compliance in a Small-Scale Indian Food Manufacturer: Before and after Certification of the Food Safety Management System and Foreign Supplier Verification Program. Appl Sci. 2023;13(22). doi:10.3390/app132212190
CrossRef - López-Santiago J, García García AI, Villarino AG, et al. Assessing wineries’ performance in managing critical control points for arsenic, lead, and cadmium contamination risk in the wine-making industry: A survey-based analysis utilizing performance indicators as a results tool. Heliyon. 2024;10(1). doi:10.1016/j.heliyon.2023.e22962
CrossRef - Lu H, Mangla SK, Hernandez JE, et al. Key operational and institutional factors for improving food safety: a case study from Chile. Prod Plan Control. 2021;32(14):1248-1264. doi:10.1080/09537287.2020.1796137
CrossRef - Politis Y, Krokos FD, Papadakis I. Categorization of control measures in food safety management systems: The COMECAT method. Br Food J. 2017;119(12):2653-2683. doi:10.1108/BFJ-01-2017-0018
CrossRef - Jacxsens L, Uyttendaele M, Devlieghere F, et al. Food safety performance indicators to benchmark food safety output of food safety management systems. Int J Food Microbiol. 2010;141(SUPPL.):S180-S187. doi:10.1016/j.ijfoodmicro.2010.05.003
CrossRef - Gellynck X, Molnár A, Aramyan L. Supply chain performance measurement: The case of the traditional food sector in the EU. J Chain Netw Sci. 2008;8(1):47-56. doi:10.3920/JCNS2008.x088
CrossRef - Kong S, Liangrokapart J. Developing Performance Measurement System In Food Industry: A Literature Review. 2019:1-10.
- Cristea C, Cristea M. KPIs for operational performance assessment in flexible packaging industry. Sustain. 2021;13(6). doi:10.3390/su13063498
CrossRef - Shukla S, Singh SP, Shankar R. Food safety assessment in India: modelling enablers. Benchmarking. 2018;25(7):2478-2495. doi:10.1108/BIJ-04-2017-0068
CrossRef - Aghwan ZA, Bello AU, Abubakar AA, et al. Efficient halal bleeding, animal handling, and welfare: A holistic approach for meat quality. Meat Sci. 2016;121(June):420-428. doi:10.1016/j.meatsci.2016.06.028
CrossRef - Ali MH, Suleiman N. Sustainable food production: Insights of Malaysian halal small and medium sized enterprises. Int J Prod Econ. 2016;181:303-314. doi:10.1016/j.ijpe.2016.06.003
CrossRef - Saifudin AM, Zainuddin N, Elias EM, et al. Reviewing the contributors towards the performance of the new Islamic supply chain model. Int J Supply Chain Manag. 2018;7(4):151-157.
- Vukina T. Animal Welfare Ballot Initiatives and the Vote-Buy Gap. J Agric Food Ind Organ. 2025;23(1):1-15. doi:10.1515/jafio-2024-0053
CrossRef - Othman B, Shaarani SM, Bahron A. Evaluation of knowledge, halal quality assurance practices and commitment among food industries in Malaysia. Br Food J. 2016. https://www.emerald.com/insight/content/doi/10.1108/BFJ-12-2015-0496/full/html.
CrossRef - Uazhanova R, Tungyshbaeva U, Kazhymurat A, et al. Evaluation of the effectiveness of implementing control systems in the increasing of food safety. J Adv Res Dyn Control Syst. 2018;10(13 Special Issue):649-656. https://www.scopus.com/inward/record.uri?eid=2-s2.0-85059471854&partnerID=40&md5=1d412856e05be9dd74a0a0fb65d5f60c.
- Doucouliagos H, Hone P. The efficiency of the Australian dairy processing industry. Aust J Agric Resour Econ. 2000;44(3):423-438. doi:10.1111/1467-8489.00118
CrossRef - Alarcón S, Sánchez M. Business strategies, profitability and efficiency of production. Spanish J Agric Res. 2013;11(1):19-31. doi:10.5424/sjar/2013111-3093
CrossRef - Pongpanich R, Peng KC, Wongchai A. The performance measurement and productivity change of agro and food industry in the stock exchange of Thailand. Agric Econ (Czech Republic). 2018;64(2):89-99. doi:10.17221/15/2016-AGRICECON
CrossRef - Pervan M. Efficiency of large firms operating in the croatian food industry: Data envelopment analysis. WSEAS Trans Bus Econ. 2020;17:487-495. doi:10.37394/23207.2020.17.47
CrossRef - Ali MH, Zhan Y, Alam SS, et al. Food supply chain integrity: The need to go beyond certification. Ind Manag Data Syst. 2017;117(8):1589-1611. doi:10.1108/IMDS-09-2016-0357
CrossRef - Tieman M, van der Vorst JGAJ, Ghazali MC. Principles in halal supply chain management. J Islam Mark. 2012;3(3):217-243. doi:10.1108/17590831211259727
CrossRef - Chaowarut W, Wanitwattanakosol J, Sopadang A. A Framework for Performance Measurement of Supply Chains in Frozen Food Industries. BalBuuAcTh. 2009;9(March):19-21. http://bal.buu.ac.th/vcml2009/paper/S105.pdf.
- Ala-Harja H, Helo P. Green supply chain decisions – Case-based performance analysis from the food industry. Transp Res Part E Logist Transp Rev. 2014;69:97-107. doi:10.1016/j.tre.2014.05.015
CrossRef - Mor RS, Bhardwaj A, Singh S, et al. Modelling The Distribution Performance in Dairy Industry: A Predictive Analysis. Logforum. 2021;17(3):425-440.
CrossRef - Harwati, Permana Y. Islamic value to the modification of BSC model (a case study in evaluating company performance). IOP Conf Ser Mater Sci Eng. 2017;277(1). doi:10.1088/1757-899X/277/1/012004
CrossRef - Nwokah NG, Maclayton DW. Customer-focus and business performance: The study of food and beverages organizations in Nigeria. Meas Bus Excell. 2006;10(4):65-76. doi:10.1108/13683040610719281
CrossRef - Abdul‐Talib A, Abd‐Razak I. Cultivating export market oriented behavior in halal marketing Addressing the issues and challenges. J Islam Mark. 2013;4(2):187–197. doi:10.1108/17590831311329304
CrossRef - Suchánek P, Richter J, Králová M. Customer satisfaction, product quality and performance of companies. Rev Econ Perspect. 2014;14(4):329-344. doi:10.1515/revecp-2015-0003
CrossRef - Aini BK, Chen MC. Exploring barriers and developing strategies for implementing smart supply chain management with Delphi method and ISM-MICMAC. Res Transp Bus Manag. 2025;62(June):101439. doi:10.1016/j.rtbm.2025.101439
CrossRef - Minz NK, Yadav M, Prakash A, et al. Analysing the key drivers and barriers for implementing circular economy practices in waste management systems using ISM and MICMAC analysis. Clean Waste Syst. 2025;12(August). doi:10.1016/j.clwas.2025.100381
CrossRef - Gunawan I, Vanany I, Widodo E. Typical traceability barriers in the Indonesian vegetable oil industry. Br Food J. 2021;123(3):1223-1248. doi:10.1108/BFJ-06-2019-0466
CrossRef - Ahmad S, Wong KY. Development of weighted triple-bottom line sustainability indicators for the Malaysian food manufacturing industry using the Delphi method. J Clean Prod. 2019;229:1167-1182. doi:10.1016/j.jclepro.2019.04.399
CrossRef - Gardas BB, Raut RD, Narkhede B. Modelling the challenges to sustainability in the textile and apparel ( T & A ) sector : A Delphi-DEMATEL approach. Sustain Prod Consum. 2018;15:96-106. doi:10.1016/j.spc.2018.05.001
CrossRef - Yadav VS, Singh AR, Raut RD, et al. Blockchain technology adoption barriers in the Indian agricultural supply chain: an integrated approach. Resour Conserv Recycl. 2020;161(May):104877. doi:10.1016/j.resconrec.2020.104877
CrossRef - Handayani DI, Masudin I, Susanty A, et al. Modeling of halal supplier flexibility criteria in the food supply chain using hybrid ISM-MICMAC : A dynamic perspective Modeling of halal supplier flexibility criteria in the food supply chain using hybrid ISM-MICMAC : A dynamic perspective. Cogent Eng. 2023;10(1). doi:10.1080/23311916.2023.2219106
CrossRef - Poduval PS, Pramod VR, P JR V. Interpretive Structural Modeling (ISM) and its application in analyzing factors inhibiting implementation of Total Productive Maintenance (TPM). Int J Qual Reliab Manag. 2015;32(3):308-331.
CrossRef - Harwati, Pettalolo Y. Halal Criteria in Supply Chain Operations Reference (SCOR) for Performance Measurement : A case Study. In: 1st International Conference on Industrial and Manufacturing Engineering. ; 2019. doi:10.1088/1757-899X/505/1/012020
CrossRef - Ahmad N, Shariff SM. Supply Chain Management: Sertu Cleansing for Halal Logisitics Integrity. In: Procedia Economics and Finance. ; 2016. doi:10.1016/s2212-5671(16)30146-0
CrossRef
 PlumX:
 Views: 1486
  PDF Downloads:
280
PDF Downloads:
280 
Accepted on: 22 June 2026
Second Review by: Khritish Swargiary
Final Approval by: Dr. Aly El.Sheikha





Web of Science Coverage
Emerging Sources Citation Index (ESCI)
2024 Journal Impact Factor: 1.1
Scopus Journal Metrics
CiteScore 2025: 2.6
CiteScore Details
Sustainable Nutrition: Food Systems, Nutrient Retention, and Public Health Impact

This journal is a member of, and subscribes to the principles of, the Committee on Publication Ethics (COPE)