
Comprehensive Assessment of Physicochemical Characteristics, Mineral Content, and Antioxidant Capacity of Malaysian Kelulut and Tualang Honeys
 , Nor Hafizah Zakaria2, Muhammad Ibrahim1*, Mohd Nur Nasyriq Anuar3, Fadzilah Adibah Abdul Majid2, Nur Maizatul Idayu Othman4and Abdullah Hagar5
 1Department of Nutrition Sciences, Kulliyyah of Allied Health Sciences, International Islamic University Malaysia, Pahang, Malaysia
2Higher Institution Centre of Excellence (HICoE), Institute of Climate Adaptation and Marine Biotechnology (ICAMB), Universiti Malaysia, Terengganu, Malaysia
3Discipline of Basic Health Sciences, Pharmacology and Toxicology, Faculty of Pharmacy, Universiti Sultan Zainal Abidin, 22200, Terengganu, Malaysia
4Faculty of Plantation and Agrotechnology, Universiti Teknologi MARA, Melaka, Malaysia
5Medical Laboratories and ABS College Yemen, Al-Razi University, Sanaa, Yemen
Corresponding Author Email: abumaisarah@iium.edu.my
DOI : http://dx.doi.org/10.12944/CRNFSJ.14.2.26
Download this article as:

Honey provides both nutritional and therapeutic benefits, making it important to evaluate its quality to ensure safe and effective consumption. The present work intended to examine the physicochemical properties, mineral composition, and antioxidant capacity of Kelulut and Tualang honeys, obtained from different regions in Malaysia. Kelulut honey was collected from Kedah (KH1) and Kelantan (KH2), whereas wild (TUW) and farmed (TUF) Tualang honey were collected from the state of Pahang, Malaysia. These honeys are unique due to their distinct floral sources, harvesting environments, and bee species, all of which may contribute to differences in their nutritional composition, bioactive compounds, and therapeutic potential. Findings revealed that KH1 had the highest dietary fiber (0.612 ± 0.027 g/100g) and carotenoid content (13.324 ± 0.778 µg BC/100g), while KH2 had greater moisture (30.586 ± 0.109 g/100g) and ash content (0.766 ± 0.010 g/100g). The concentration of protein in TUW was the highest with the value of 1.776 ± 0.040 g/100g, whereas TUF recorded 79.980 ± 0.280 g/100g of carbohydrate level, which was the highest among the samples. TUW was richer in fructose (33.500 ± 3.473), while KH1 contained the most glucose (40.983 ± 0.941 g/100g). KH2 exhibited the highest concentrations of calcium, magnesium, and potassium among the samples analyzed, while KH1 showed the lowest pH, indicating higher acidity. KH2 also exhibited the highest electrical conductivity and colour intensity, whereas TUW had the lowest water activity and TUF recorded the highest total soluble solid. Overall, although each honey sample exhibited distinct nutritional and physicochemical characteristics, KH2 demonstrated the most prominent quality attributes, including superior mineral composition and physicochemical properties, particularly reflected in its elevated phenolic (33.711 ± 0.590 mg GAE/100 g) and flavonoid contents (2.217 ± 0.126 mg CE/100 g), highlighting its potential as a nutritionally valuable honey with enhanced antioxidant capacity and health-promoting properties.
KEYWORDS:Kelulut; Phenolics; Phytochemicals; Sugar Profile; Tualang
Introduction
Honey is a thick and sweet liquid formed from floral nectar collected by bees and processed by mixing them with enzymes from their salivary glands and storing the resulting mixture in honeycombs. 1 The quality, composition, colour, and sensory attributes of honey are determined by more than its botanical origin. They are shaped by a complex interaction of factors such as bee species, environmental and soil conditions, honey maturation, colony health, ecoclimatic influences, and seasonal variability, all of which contribute to the unique characteristics of honey.2 In Malaysia, two prominent types of honey, Kelulut and Tualang honey have gained attention for their potential health benefits.3 Kelulut honey comes from the stingless bee, Trigona sp., the largest genus of stingless bees within the Meliponini tribe, comprising numerous small, eusocial species that are incapable of stinging and instead defend their colonies by biting. These bees are known for their highly organised colonies, unique waxy nests, and the production of propolis-rich honey with potent antimicrobial and antioxidant properties.4-6 Kelulut honey differs from other varieties in its taste, viscosity and colour. Kelulut honey is generally less viscous and has a higher moisture content compared to Tualang honey. It is characterized by a distinctive tangy flavor and a darker coloration. Honey color has been linked to variations in mineral composition, with darker honeys typically displaying higher concentrations of both macro- and microelements. These honeys are frequently characterised by increased levels of magnesium, sodium, calcium, potassium, copper, manganese iron, and zinc. Moreover, darker honey types have been reported to contain greater amounts of specific trace elements, including aluminum, cadmium, and nickel, relative to lighter-colored honeys.7In contrast, Tualang honey is typically lighter in color, ranging from golden yellow to dark amber. It has a sweeter and more floral taste compared to Kelulut honey. Tualang honey is also more viscous, with a thicker consistency. Tualang honey is produced by Apis dorsata, the giant honeybee. These wild bees construct massive, open-air honeycombs on the towering branches of the Tualang tree (Koompassia excelsa) in Southeast Asian rainforests. A. dorsata bees are not domesticated and are known for producing multifloral honey that is valued for its strong medicinal benefits, including anti-inflammatory, anti-cancer, antioxidant and antibacterial activities.3,7
Carbohydrates constitute the major component of honey, with the monosaccharides fructose and glucose collectively representing about 85–95% of its total sugar composition.3 The balance between these sugars significantly affects honey’s tendency to granulate. Increased fructose levels are associated with delayed crystallization, allowing honey to remain liquid for extended periods due to the comparatively lower solubility of glucose.4 The remaining carbohydrates consist mainly of oligosaccharides formed by linked fructose and glucose molecules, while polysaccharides are present only in trace amounts. In addition to its primary sugars, honey contains a number of secondary bioactive components, including hydroxymethylfurfural (HMF), enzymes, minerals, flavonoids, amino acids, proteins, and fat-soluble vitamins.1
In honey produced in proximity to agricultural and industrial zones, elevation of heavy metal concentrations is frequently reported. Because consumers may be at risk for harmful health effects due to microelement deficiencies, excessive buildup, or imbalances in honey, the presence of pollutants like cadmium, nickel, lead, etc. is a significant cause for concern.2 Microelements are essential for biological accumulation and play important roles in physiological development, metabolic regulation, and overall cellular functions. Zinc, potassium, sodium, iron, calcium, manganese and copper are essential trace and macro-minerals required for normal biological metabolism, whereas Cd, As and Pb are considered toxic, non-essential environmental contaminants. At elevated concentrations, these heavy metals can become highly harmful, as the human body has limited ability to effectively metabolize and eliminate them.3,4
Despite the growing interest in the medicinal and nutritional value of Malaysian honey, comparative studies involving both Kelulut and Tualang honey from different geographical regions remain limited. There has been lack of research comparing mineral composition and heavy metal levels of various Malaysian honeys, with most studies concentrating on the medicinal components or physicochemical characteristics of a single variety of honey. Therefore, this study set out to examine the differences between the elemental profiles and physicochemical properties of honey samples sourced from various areas in Malaysia, specifically Kelulut and Tualang. This study provides additional insight into the nutritional quality and safety aspects of Malaysian honey and contributes valuable baseline data for future quality assessment and authentication studies.
Materials and Methods
Chemicals
Sigma-Aldrich (USA) provided Trolox, TPTZ (2,4,6-tri(2-pyridyl)-s-triazine), β-carotene, quercetin, 2,2-diphenyl-1-picrylhydrazyl, sodium carbonate, methanol, sodium hydroxide, acetonitrile, gallic acid, aluminum chloride, Folin-Ciocalteu’s reagent, ferric chloride heyxahydrate, sodium acetate, and sodium nitrite. While, fructose and glucose were obtained from Nacalai Tesque, Japan. Nitric acid (HNO3), hydrogen peroxide (H2O2) were purchased from Fisher Scientific, USA.
Collection of honey
As shown in Figure 1, samples of Kelulut honey were collected from two regions in Malaysia: Kedah (KH1) and Kelantan (KH2). Tualang honey samples (TUW and TUF) were obtained from Pahang, where TUW was wild honey and TUF was cultivated on a farm by beekeepers. This study comprised four honey samples in total (n = 4). The age of the harvested beehives was approximately three years. All honey samples were harvested without processing and stored at room temperature. KH1 was collected in September 2014, while other samples were harvested in March 2015.
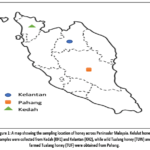 |
Figure 1: A map showing the sampling location of honey across Peninsular Malaysia. Kelulut honey samples were collected from Kedah (KH1) and Kelantan (KH2), while wild Tualang honey (TUW) and farmed Tualang honey (TUF) were obtained from Pahang. |
Proximate analysis
For moisture content, the procedure adopted an oven-drying method from AOAC Official Method 977.11.8 An empty plate was dried for two hours at 110°C in a Memmert 100-800 Incubator (Germany). After weighing about 2 g of each honey sample, they were dried for 8 hours at 70°C. The dried samples were allowed to cool for half an hour in a desiccator. Triplicate analyses of the moisture content were carried out using the following formula:

W1 = Weight of dried dish
W2 = Weight of the dish with the sample after drying.
The amount of ash in honey was ascertained using the dry ashing method.8 First, 2 g of the material was burnt for 12 hours at 550°C in a muffle oven. A percentage representation of the final weight was recorded. After conducting the analysis three times, the following formula was employed to calculate the results:

The Kjeldahl method was done to quantify the protein content, and all measurements were made in three replications. 8 A KjelDigestor (K-446) was used to digest the sample, and a Kjeldahl distillation apparatus was then used to extract the released nitrogen. Utilizing Soxhlet extraction, the lipid content was evaluated in all honey samples. 8 Five grams of each sample were extracted using petroleum ether in triplicate. Next, crude fiber analysis was conducted through successive acid and alkaline digestion using sulfuric acid and sodium hydroxide, respectively. The samples were put into a ceramic crucible that had already been weighed. It was then heated to 600°C for two hours and cooled in a desiccator for thirty minutes before it was weighed again. 8 The analysis was performed in triplicate and calculated using the following equation:

W1 = the weight of the crucible and residue after drying
W2 = the weight of the crucible and ash after incineration
For the determination of total dietary fiber, fritted crucibles were initially heated to 525 °C overnight, allowed to cool, and cleaned prior to the addition of 1.0 g of celite for the total dietary fiber calculation. 8 The honey sample, which weighed 1 g with 10 mL of 85% methanol. At a pH of 8.2, the extract was mixed with 40 mL of MES-TRIS buffer and mixed thoroughly by stirring. After adding 50 µL of alpha-amylase, the mixture was incubated for 15 minutes at 95–100 °C before being cooled. Protease treatment and acidification with hydrochloric acid were carried out in sequence. Soluble dietary fiber (SDF) was recovered from the filtrate by ethanol precipitation, whereas insoluble dietary fiber (IDF) was collected as the residue through filtration. Total dietary fiber was computed in triplicate as the sum of the final weights of SDF and IDF.
For carbohydrate content, each honey sample was analyzed in three replicates using the formula; total carbohydrate (%) = 100 – (moisture (%) + ash (%) + protein (%) + fat (% + dietary fiber (%), where the results were expressed in g/100 g of dry matter. 5 A total of three independent calculations were performed on the honey samples to determine their energy content. The standard energy parameters used were 17 kJ/g (4 kcal/g) for protein and carbohydrates and 38 kJ/g (9 kcal/g) for fat. The formula is as follows:
Energy (kcal/100g) = (% carbohydrate × 4) + (% total fat × 9) + (% protein × 4).
Sugar analysis
Based on the procedure done by Abdul Rafa et al.,⁶ sugar analysis was conducted in triplicate using an Agilent 1200 series HPLC system equipped with a refractive index detector and a Zorbax NH2 column (250 mm × 4.6 mm × 5 µm). The chromatographic conditions included a mobile phase of acetonitrile and water (75:25, v/v), a flow rate of 1 mL/min, an injection volume of 20 µL, a total run time of 30 minutes, and a maintained column temperature of 30 °C. Before analysis, 5 g of honey was dissolved in 10 mL of ultrapure water and filtered over a 0.45 µm nylon membrane. The first 2 mL of the filtrate was discarded. To calibrate, standard solutions of glucose and fructose (2.5 to 25 g/L of concentrations) were prepared.
Mineral analysis
Agilent 7500 Series inductively coupled plasma mass spectrometer (ICP-MS) was utilised to assess the concentration of minerals and toxic elements in honey samples. 9 The experiment was conducted in triplicate. Clean digestion vessels were filled with approximately 0.22 g of each honey sample, followed by 6 ml of 67-70% nitric acid (HNO₃) and 2 ml of hydrogen peroxide (H₂O₂). The vessels were then sealed. The microwave digestion system (Milestone Ultrawave) was employed to digest the samples for 45 minutes, comprising 30 minutes of heating and 15 minutes of cooling, ensuring the total dissolution of minerals.
A blank was prepared similarly, and all digestions were performed in triplicate. After the digestion process was complete, the solutions were diluted with 2% HNO₃ using 50 ml volumetric flasks filled with double deionized water (Milli-Q, 18.2 MΩ-cm). Standard solutions for the minerals were prepared by dissolving 1000 mg of each standard in 14 ml of double deionized water, adding 7 ml of HNO3, and adjusting the volume to 1 literThe solutions were further diluted with 0.1 M HNO3 to attain measurable concentrations in µg/L. After the digestion process was finished and the standards were prepared, the blank and samples were processed via ICP-MS. The final values were presented in µg/g (ppm).
Analysis of physical properties
Water activity of the samples was determined at 25 °C using an Aqualab Series 4 water activity meter (4TE, Washington, USA), according to AOAC methods. 8 The disposable sampling cup was filled with the samples until the bottom of the cup was completely covered. The readings were taken in triplicate when the equilibrium was achieved.
The pH value analysis of honey utilized the AOAC Official Method 981.121. 8 The initial step involved the preparation of a 10% w/v honey solution by dissolving 2 g of honey in 20 ml of milli-Q water. After calibrating the pH meter at 4.01, and 10.01 with a known buffer solution, the pH values were recorded using a pH meter (Mettler Toledo). The experiment was conducted in triplicate. Electric conductivity (EC) was also done following AOAC Official Method 981.121.8 The calculation was based on the result of ash content, where EC (mS/cm) = 0.14 + 1.74 × A., where A was the ash content (g/100 g).
In order to conduct the color analysis, the method outlined by Paula et al.10 was followed, employing a UV spectrophotometer (Schott UVLine 9400). The honey solution (50% w/v) was first heated at 50 °C. The plastic cuvettes were used to keep the prepared solution for a period of 10 to 15 minutes. The absorbances were then measured at 635 nm using water for a blank solution. After converting the absorbance readings, honey’s color intensity was classified using the Pfund scale, where:
mm Pfund = -38.70 + 371.39 × absorbance
A hand refractometer (Atago, Japan) with ranges of 45°Brix to 82°Brix was used to measure total soluble solid (TSS).11 The prism-plate of the refractometer was loaded with the appropriate quantity of each honey sample. Total soluble solids (°Brix) were measured in triplicate at 20 °C.
Analysis of total phenolic content (TPC)
The Folin Ciocalteu method, as outlined by Anuar et al.,¹² was used to determine TPC. The first step was to dilute the honey samples to a final concentration of 0.1 g/ml by filtering 3 g of each sample through Whatman No. 1 paper using 30 ml of distilled water. Following that, Folin Ciocalteu’s phenol reagent was combined with 2 ml of each honey solution. Sodium carbonate (Na₂CO₃) solution, with a concentration of 10%, was added to the mixture two minutes later. The mixture was vortexed and then left to incubate for 90 minutes in a dark environment. At 725 nm, the absorbance was determined using a UV/Vis spectrophotometer (Schott UVLine 9400, USA). A standard gallic acid solution was used to construct a calibration curve. As a blank, distilled water was used. The measurement was conducted in triplicate, with values reported as milligrams of gallic acid equivalents (GAEs) per 100 grams of honey sample.
Analysis of total flavonoid content (TFC)
Initially, 10 g of each honey sample was diluted with distilled water to 50 ml at a concentration of 0.2 g/ml.12 Using Whatman No. 4 filter paper, the honey solution was filtered. The mixing then proceeded by adding 2 ml of filtrate to 8 ml of distilled water and then 0.6 ml of sodium nitrite (NaNO₂), which is a 5% solution. A 10% solution of aluminum chloride (AlCl3), in 0.6 ml, was added to the mixture after 5 minutes. After adding 4 ml of 1M sodium hydroxide (NaOH) to the mixture, it was incubated for an additional five minutes. UV spectrophotometer (Schott UVLine 9400) was used to measure the mixture’s absorbance at 510 nm immediately following vortexing. The calibration curve was derived using quercetin (20-100 μg/ml, R2=0.973) as a reference. Milligram of quercetin equivalents (mg quercetin/100 g honey) was the unit of expression for the results.
Analysis of total carotenoid content (TCC)
In a 6:4 (v/v) proportion, 10 mL of an n-hexane–acetone solvent mixture were added to 2 g of each honey sample.¹³ After centrifuging the solution for 12 minutes at room temperature at 600 rpm, Whatman No. 4 filter paper was used to filter the mixture. Using a UV spectrophotometer (Schott UVLine 9400), the absorbance was measured at 450 nm compared to a blank after filtration. Standard β-carotene solutions ranging from 0.015 to 0.3 μg/mL (R² = 0.982) were used to generate a calibration curve for estimating the total carotenoid levels in the honey samples. The results were therefore reported in micrograms of β carotene equivalents (mg β carotene/100 g honey).
2,2-Diphenyl-picrylhydrazyl (DPPH) assay
In order to prepare the DPPH solution, 2.4 mg of DPPH powder (Sigma-Aldrich, USA) was dissolved in 100 ml of methanol.14 2.7 mL of methanolic DPPH solution was combined with a 1 mL aliquot of the diluted honey sample (20% w/v). Afterward, the mixture was incubated in the dark for 15 minutes after being vortexed for 4 minutes. At 517 nm, the absorbance was measured with a UV-Vis spectrophotometer (Schott UVLine 9400, USA). In order to determine the correlation coefficient between ascorbic acid concentration and absorbance, linear regression analysis was implemented, resulting in a calibration equation at R² = 0.982. Antioxidant activity, measured in percentage of DPPH radical scavenging activity (RSA), was determined using the following equation:
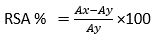
Ax = the absorbance of pure DPPH solution
Ay = the absorbance of the sample with DPPH after incubation
Ferric reducing antioxidant power assay (FRAP)
By dissolving 0.031 g of TPTZ in 10 mL of 40 mM HCl, a 10 mM solution of 2,4,6-tri(2-pyridyl)-s-triazine (TPTZ) was made.5 Throughout the analysis procedure, the solution, which was freshly prepared, was maintained at 50°C in a water bath. To make the FRAP reagent working solution, 200 mL of 300 mM acetate buffer pH 3.6, 20 mL of 10 mM TPTZ, and 20 mL of 20 mM iron (III) chloride hexahydride were combined. After that, a UV-Vis-spectrophotometer (Schott UVLine 9400, USA) was used to detect the absorbance of the solution at 593 nm. This was followed by a 30-minute incubation period at 37 °C during which the samples were combined with the FRAP buffer. The absorption at the same wavelength was measured at that time. Comparisons were made between the absorbance change and a standard curve. Trolox/L was linear between 100 and 1000 µM, as indicated by the standard curve (R² = 0.983). The FRAP results were expressed using the Trolox equivalent (μM Trolox/100 g honey).
Statistical Analysis
Version 20 of the Statistical Package for the Social Sciences (SPSS) software (IBM, USA) was utilized to perform the statistical analysis. The mean values ± standard deviation (SD) were used to express all results, which were obtained from triplicate measurements. Statistically significant differences were denoted by distinct letters at p < 0.05, and the sample means were compared using one-way analysis of variance (ANOVA) and Tukey’s post hoc multiple comparison test. Furthermore, the Pearson correlation analysis was conducted to investigate the correlation between TPC, TFC, TCC, DPPH, and FRAP activities.
Results
Analysis of proximate composition
There are notable variations in the moisture, ash, protein, fat, dietary fiber, total carbohydrate, and energy content of the four samples of Malaysian honey that are shown in Table 1, together with their proximate composition and energy values (p < 0.05). The samples were ranked by moisture content, with KH2 showing the highest and TUF the lowest. The ash concentration, which is a measure of the mineral composition, varied between 0.034 ± 0.003 and 0.766 ± 0.010 g/100g. Among the samples, KH2 had substantially higher ash levels. The protein levels in the honey samples varied between 0.580 ± 0.030 and 1.776 ± 0.04 g/100 g. When comparing Tualang honey (TUW) to KH1, KH2, and TUF, the protein content in TUW was noticeably greater.
The fat content was minimal across all samples, with Tualang honey, TUW significantly showing the highest fat content, followed by TUF, KH1, and KH2. Dietary fiber content varied significantly across the Malaysian honey samples, with KH1 exhibiting the greatest amount, followed in descending order by TUF, KH2, and TUW. In contrast, all samples displayed relatively high carbohydrate levels, reinforcing honey’s role as a major dietary energy source. Tualang honey, TUF exhibited a significantly higher total carbohydrate content compared to the other varieties, aligning with its also high gross energy value (322.780±1.074 Kcal/100g), which makes it suitable for individuals seeking a natural energy boost. This was closely followed by KH1 and TUW, while KH2 had significantly lower carbohydrate levels.
Analysis of sugar content
Table 1 summarizes the sugar composition (fructose and glucose) of Kelulut and Tualang honey samples. Fructose content varied from 8.660 ± 1.071 to 33.500 ± 3.473 g/100g, whereas glucose ranged between 12.803 ± 0.841 and 40.983 ± 0.941 g/100g. TUW contained the highest fructose level (33.500 ± 3.473 g/100g), which was significantly higher than that of KH2 and TUF. Conversely, KH1 (Kedah) showed the highest glucose concentration, significantly surpassing KH2, TUW, and TUF (p < 0.05). The combined fructose and glucose (F+G) content ranged from 22.857 ± 2.192 to 72.077 ± 0.642 g/100g, with KH1 exhibiting the greatest total sugar content compared to KH2 and TUF.
Table 1: Honey samples (KH1, KH2, TUW and TUF) with their proximate compositions and sugar concentrations.
|
Parameter |
KH1 | KH2 | TUW |
TUF |
|
Proximate composition |
||||
|
Moisture (g/100g) |
23.123 ± 0.125b | 30.586 ± 0.109d | 24.035 ± 0.004c | 18.914 ± 0.264a |
|
Ash (g/100g) |
0.126 ± 0.001b | 0.766 ± 0.010d | 0.197 ± 0.002c | 0.034 ± 0.003a |
| Protein (g/100g) | 0.603 ± 0.008a | 1.270 ± 0.031b | 1.776 ± 0.040c |
0.580 ± 0.030a |
| Fat (g/100g) | 0.034 ± 0.003b | 0.025 ± 0.003a | 0.070 ± 0.007d |
0.061 ± 0.002c |
|
Dietary fiber (g/100g) |
0.612 ± 0.027d | 0.215 ± 0.024b | 0.087 ± 0.003a | 0.432 ± 0.015c |
| Crude fiber (g/100g) | – | – | – |
– |
|
Carbohydrate (g/100g) |
75.500 ± 0.170c | 67.134 ± 0.125a | 73.833 ± 0.040b | 79.980 ± 0.280d |
| Gross energy (kcal/100g) | 304.713 ± 0.644b | 273.837 ± 0.502a | 303.070 ± 0.000b |
322.780 ± 1.074c |
|
Sugar content |
||||
| Fructose (g/100g) | 31.093 ± 1.100c | 15.033 ± 0.826b | 33.500 ± 3.473c |
8.660 ± 1.071a |
|
Glucose (g/100g) |
40.983 ± 0.941c | 12.803 ± 0.841a | 34.117 ± 1.086b | 14.197 ± 1.154a |
| Fructose + glucose (g/100g) | 72.077 ± 0.642b | 27.837 ± 1.654a | 67.617 ± 2.685b | 22.857 ± 2.192a |
– = not detected; KH1 refers to Kelulut honey from Kedah, while KH2 denotes honey from Kelantan. The abbreviation TUW refers to wild Tualang honey collected in Pahang, whereas TUF denotes cultivated Tualang honey from Pahang. Mean ± standard deviation (SD) is the notation used to describe the results. Under the same row, distinct superscript letters (a, b, c, d) show statistically significant differences between the samples (p < 0.05).
Analysis of mineral content
Across the four honey varieties analysed, potassium and sodium were the dominant macro-minerals, as presented in Table 2. Sodium concentrations ranged from 406.63 ± 3.33 µg/g to 514.70 ± 6.27 µg/g, whereas potassium levels varied greatly, ranging from 136.97 ± 2.30 µg/g to 5162.93 ± 23.17 µg/g. KH2 had a potassium concentration of 5162.93 ± 23.17 µg/g, which was significantly greater than KH1 and TUW (p < 0.05) by a factor of 37.69 and 3.4, respectively. Calcium content ranged between 37.03 ± 1.84 µg/g and 214.80 ± 2.76 µg/g, with KH2 exhibiting the maximum level (p < 0.05). The magnesium levels in KH2 were substantially greater than those in KH1, TUW, and TUF (p < 0.05), ranging from 1.53 ± 0.06 µg/g in KH1 to 364.23 ± 2.8 µg/g in KH2. Overall, KH2 from Kelantan consistently demonstrated the highest concentrations of key macro-minerals, particularly potassium, calcium, and magnesium, indicating its strong mineral richness.
In terms of microminerals, the study assessed manganese, iron, chromium, silver, nickel, cobalt, vanadium, barium, molybdenum, selenium, and copper. Iron and manganese were the most prevalent trace elements among the examined profiles, as Table 2 illustrates. KH2 recorded the highest manganese content, whereas TUF had the highest Fe concentration. Meanwhile, molybdenum, selenium, and copper were not detected in any of the samples. For potentially toxic elements, Pb, As, and Cd were evaluated. In KH1 to KH2, levels of Pb varied between 0.702 ± 0.008 µg/g and 1.967 ± 0.058 µg/g, respectively. In contrast, As was found in TUF (Pahang) at a concentration of 0.003 ± 0.001 µg/g, Cd levels varied from 0.015 ± 0.003 µg/g to 0.050 ± 0.002 µg/g, with KH2 showing the highest concentration. Notwithstanding their presence, these elements remained beneath the acceptable thresholds established by WHO and JECFA, signifying that the honey samples comply with safe consumption requirements.
Table 2: Mineral contents of the honey samples (KH1, KH2, TUW and TUF).
|
Element (µg/g) |
KH1 | KH2 | TUW | TUF |
| Macromineral | ||||
| Potassium | 136.97±2.30a | 5162.93±23.17d | 501.50±9.00c |
193.33±2.85b |
|
Sodium |
497.00±4.94b | 489.50±3.50b | 406.63±3.33a | 514.70±6.27c |
|
Calcium |
37.03±1.84a | 214.80±2.76d | 137.63±2.90c | 76.37±2.82b |
| Magnesium | 1.53±0.06a | 364.23±2.8b | 2.00 ±0.00a |
3.70±0.10a |
|
Micromineral |
||||
| Manganese | 0.100±0.000a | 14.967±0.153d | 1.533±0.058c |
0.800±0.000b |
|
Iron |
0.400±0.000a | 26.833±0.058b | 0.600±0.173a | 30.233±0.321c |
| Chromium | 0.031±0.006a | 0.043±0.006a | 0.034±0.004a |
0.079±0.012b |
|
Vanadium |
0.003±0.001a | 0.006±0.001b | 0.005±0.000b | 0.009±0.001c |
| Silver | 0.107±0.071a | 0.041±0.021a | 0.261±0.045b |
0.599±0.074c |
|
Nickel |
0.143±0.002b | 0.209±0.004c | 0.078±0.004a | 0.309±0.003d |
| Cobalt | 0.166±0.007a | 0.328±0.009c | 0.197±0.005b |
0.202±0.003b |
|
Barium |
0.097±0.006a | 0.845±0.003d | 0.244±0.004c | 0.187±0.008b |
| Molybdenum | – | – | – |
– |
|
Selenium |
– | – | – | – |
| Copper | – | – | – |
– |
|
Toxic element |
||||
|
Lead |
0.702±0.008a | 1.967±0.058d | 0.891±0.001c |
0.795±0.012b |
| Cadmium | 0.015±0.003a | 0.050±0.002b | 0.021±0.001a |
0.020±0.001a |
|
Arsenic |
– | – | – |
0.003±0.001 |
– = not detected. Results are presented as mean ± SD from triplicate measurements. Denoted by different superscript letters (a, b, c, and d), there are significant variations in means (p < 0.05). Kelulut honey from Kedah is denoted as KH1, while Kelulut honey from Kelantan is denoted as KH2. Wild Tualang honey from Pahang is abbreviated as TUW, while cultivated Tualang honey from Pahang is abbreviated as TUF.
Physical properties
The physical properties of KH1, KH2, TUW and TUF samples are depicted in Table 3. A wide variation in colour was observed, ranging from water white to amber, dark amber, and in some instances approaching black. In general, darker honeys are commonly associated with higher mineral content and a more intense flavour profile. Honey colour was quantified using the Pfund scale, where KH2 (Kelantan) recorded the highest value, followed by TUW, TUF, and KH1 (p < 0.05). Based on Pfund classification, KH1 was categorised as water white (<8 mm Pfund), whereas KH2, TUW, and TUF were classified as dark amber (>114 mm Pfund). pH analysis was also performed to evaluate acidity levels. KH1 exhibited the lowest pH, significantly lower than KH2, TUW, and TUF (p < 0.05). In contrast, TUW and TUF showed higher pH values compared to the Kelulut honey samples (KH1 and KH2). The generally low pH of honey contributes to its antimicrobial properties by inhibiting microbial growth, suggesting that Kelulut honey may have a lower susceptibility to spoilage compared to Tualang honey.
One important aspect of honey that influences its microbiological stability, texture, and shelf life is its water activity. The honey samples in this study had water activity readings ranging from 0.675 ± 0.002 to 0.755 ± 0.001. Among them, TUW showed a significantly lower water activity compared to the other samples, suggesting it may have a relatively longer shelf life. The lower water activity observed in TUW contributes to its thicker and more viscous consistency. In contrast, KH1 demonstrated the highest water activity, suggesting that Kelulut honey may possess a shorter shelf life and a less viscous, more fluid texture, which could increase its susceptibility to microbial growth.
TSS is primarily measuring the concentration of dissolved sugars such as fructose and glucose. Unusually low or high °Brix values can suggest possible adulteration or improper processing. The honey samples examined in this study had °Brix values that varied between 67.967 ± 0.058 and 76.267 ± 0.058 °Brix, as shown in Table 3. As compared to Tualang honey (TUW and TUF), Kelulut honey (KH1 and KH2) had significantly lower °Brix values (p < 0.05). These differences may be attributed to varying sugar concentrations in the honey, with Kelulut honey containing lower sugar levels than Tualang honey. Since higher sugar content results in higher °Brix values, this supports the observed variation.
EC is an essential parameter that directly link to the honey’s ability to conduct an electric current. In this study, KH2 recorded the highest EC value among all samples (p < 0.05), indicating a higher presence of minerals and bioactive compounds. This aligns with its mineral-rich composition, as KH2 contained the highest manganese and significantly greater amounts of potassium, calcium, and magnesium compared to KH1, TUW, and TUF.
Table 3: Honey samples (KH1, KH2, TUW, and TUF) and their physical characteristics.
|
Parameter |
KH1 | KH2 | TUW | TUF |
| Color (mm Pfund) | 7.476±1.135a | 672.883±13.64c | 141.053±8.271b |
136.225±1.486b |
|
pH |
3.080±0.020a | 3.610±0.010b | 3.730±0.026c | 4.037±0.030d |
| Water activity (aw) | 0.708±0.002b | 0.755±0.001d | 0.675±0.002a |
0.747±0.003c |
|
Total soluble solid (°Brix) |
72.300±0.000b | 67.967±0.058a | 75.033±0.058c | 76.267±0.058d |
| Electric conductivity (mS/cm) | 0.3358±0.002b | 1.473±0.018d | 0.483±0.003c |
0.197±0.005a |
The mean ± standard deviation (SD) is computed using three separate sets of data. Statistically significant differences (p < 0.05) are shown by means within the same row that have unique superscript letters. TUW stands for wild Tualang honey gathered in Pahang, TUF for cultivated Tualang honey from Pahang, KH1 for Kelulut honey from Kedah, and KH2 for Kelantan.
Antioxidant compounds
Additionally, important phytochemical components, such as carotenoids, flavonoids, and phenolics, were analyzed to determine the honey samples’ antioxidant capabilities. The results are summarised in Table 4. TPC showed considerable variation among the samples, ranging from 3.480 ± 0.660 to 33.711 ± 0.590 mg gallic acid equivalent (GAE)/100 g of honey, indicating notable differences in phenolic composition. Significantly higher than KH1, TUW, and TUF (p < 0.05), KH2 showed the greatest TPC, indicating a stronger potential antioxidant capability and an increased content of phenolic substances. But when comparing KH1 and TUF, no statistically significant change (p > 0.05) was found, indicating similar phenolic levels between these two honey types.
Similarly, variations in TFC were observed across the samples, with values ranging from 1.417 ± 0.076 to 2.217 ± 0.126 mg quercetin equivalents (QE)/100 g. KH2 exhibited the highest TFC (2.217 ± 0.126 mg QE/100 g), which aligns with its significantly elevated TPC, reinforcing the correlation between these polyphenolic compounds in determining honey’s antioxidant capacity. Furthermore, the lack of significant differences in TFC between KH1 and TUW reflects a similar trend in TPC, further highlighting the interdependence of these bioactive compounds.
In addition to TPC and TFC, TCC was also analyzed to assess its contribution to the honey samples’ overall antioxidant potential. The results showed a wide variation in TCC values, ranging from 2.631 ± 0.588 to 13.324 ± 0.778 µg ß-carotene equivalence (BC)/100 g honey. Significant variations were observed in all four honey samples (p<0.05). Notably, KH1 from Kedah exhibited the highest TCC compared to KH2, TUW, and TUF (p < 0.05), suggesting a higher abundance of carotenoid pigments in this sample. Additionally, TCC values for stingless bee honey (KH1 and KH2) were higher than those for Tualang honey (TUW and TUF), suggesting that Kelulut honey tends to possess greater antioxidant potential due to its enriched phytochemical profile.
Antioxidant activities and correlation analysis
DPPH and FRAP assays were performed to complement the TPC, TFC, and TCC results. As shown in Table 4, RSA values ranged from 64.866 ± 1.435% to 84.521 ± 1.859% among the honey samples. KH2 (Kelulut honey from Kelantan) exhibited the highest DPPH inhibition, significantly surpassing all other samples (p < 0.05). In contrast, TUW and TUF showed no significant difference (p > 0.05), indicating comparable free radical-scavenging abilities.
KH2 also exhibited the highest FRAP value (368.472 ± 0.939 µM Trolox/100 g), significantly exceeding those of KH1, TUW, and TUF (p < 0.05). Interestingly, KH2’s FRAP value was about 20 times more than KH1’s, further emphasizing its strong reducing power and antioxidant capacity. According to Pearson correlation analysis, which showed a substantial positive connection between these two parameters, the results show a strong association between TPC and FRAP activity (r = 0.924). Additionally, TPC and DPPH showed moderate positive correlations (r = 0.504).. Similarly, TFC showed moderate positive correlations with both DPPH (r = 0.585) and FRAP (r = 0.675). TCC exhibited a moderate positive correlation with DPPH activity (r = 0.646), but only a very weak negative correlation with FRAP (r = –0.113). Furthermore, between DPPH and FRAP assays, a moderate positive correlation was found (r = 0.664), indicating partial agreement between these antioxidant assessment methods.
Table 4: Honey samples (KH1, KH2, TUW, and TUF) and their antioxidant activities.
|
Parameter |
KH1 | KH2 | TUW |
TUF |
|
TPC (mg GAE/100g) |
4.378±0.655a | 33.711±0.590c | 28.405±0.531b | 3.480±0.660a |
| TFC
(mg QE/100g) |
1.533±0.0764a | 2.217±0.126c | 1.417±0.0764a |
1.817±0.0764b |
|
TCC (µg BC/100g) |
13.324±0.778d | 7.893±0.509c | 4.328±0.509b | 2.631±0.588a |
| DPPH (%) | 76.623±1.772b | 84.521±1.859c | 68.860±1.908a |
64.866±1.435a |
|
FRAP (µM TE/100g) |
18.750±0.955a | 368.472±0.939d | 176.111±1.796c |
47.222±1.049b |
The mean ± standard deviation (SD) derived from three replicates is used to express all values. Significant differences (p < 0.05) are shown in the same row by means that have unique superscript characters. TUW stands for wild Tualang honey gathered in Pahang, TUF for cultivated Tualang honey from Pahang, KH1 for Kelulut honey from Kedah, and KH2 for Kelulut honey from Kelantan.
Discussion
The compositional differences observed between Kelulut (KH1, KH2) and Tualang (TUW, TUF) honeys clearly demonstrate the strong influence of bee species, botanical origin, and geographical environment on honey quality parameters. The elevated moisture content in KH2 aligns with established characteristics of stingless bee honey in tropical regions.14 Unlike A. mellifera honey regulated under Codex standards,15 stingless bee honey naturally exhibits higher moisture due to differences in hive structure, nectar processing behavior, and storage in cerumen pots rather than wax combs. This structural difference may limit dehydration efficiency, thereby contributing to elevated water activity and potential fermentation susceptibility. Therefore, the higher moisture in Kelulut honey should be interpreted as a biological trait rather than a quality defect.
KH2 demonstrated high ash and mineral contents, particularly potassium, magnesium, calcium, and manganese. The predominance of potassium is consistent with global observations across honey types, reinforcing its role as the main mineral marker of botanical origin.16-18 However, the magnitude of potassium detected in KH2 (over 5000 µg/g) is substantially higher than many international reports, suggesting a strong regional geochemical influence or unique floral sources in Kelantan. Elevated magnesium and manganese further support the hypothesis that soil composition and nectar mineral uptake significantly influence stingless bee honey composition.19,20
The close association between darker color, higher electrical conductivity, and mineral richness observed in KH2 is mechanistically coherent. Electrical conductivity reflects ionic concentration derived from minerals and organic acids,21 and darker honeys have consistently been linked to greater mineral and phenolic densities.22 The high Pfund value recorded for KH2 supports the proposition that Kelulut honey from Kelantan may represent a mineral-dense functional honey subtype. This characteristic enhances not only its nutritional value but also its commercial differentiation potential.7
Importantly, although trace levels of Pb, Cd, and As were detected, all values remained well below WHO safety thresholds.23,24 The absence of arsenic in most samples suggests minimal environmental contamination, reinforcing the suitability of these honey-producing regions as relatively unpolluted ecosystems. Given that honey is often used as a bioindicator of environmental quality, these findings have ecological as well as nutritional implications.25
Antioxidant profile identified KH2 as the most bioactive sample from a functional standpoint. It was assumed that phenolic compounds are important in mediating the radical scavenging and lowering capability of the honey samples due to the substantial association between increased TPC and higher FRAP activity.25 The result is consistent with previous studies reporting that phenolic compounds possess strong electron-donating ability and play an important role in reducing ferric ions, thereby enhancing antioxidant capacity.1,6 The magnitude of FRAP activity in KH2 (approximately 20-fold higher than KH1) is particularly striking and suggests a highly concentrated pool of redox-active compounds. Comparable TPC levels have been reported in premium monofloral honeys such as Sider honey, indicating that Malaysian Kelulut honey may possess antioxidant capacity competitive with internationally recognized high-value honeys.26
Interestingly, KH1 exhibited the highest total carotenoid content but only moderate antioxidant activity. This divergence highlights the mechanistic distinction between carotenoids and polyphenols. While phenolic compounds exert direct electron-donating and hydrogen atom transfer activities detectable in DPPH and FRAP assays, carotenoids primarily function through singlet oxygen quenching and lipid-phase antioxidant mechanisms.27 Thus, carotenoid-rich honey may demonstrate protective effects not fully captured by conventional radical-scavenging assays. This finding underscores the importance of employing multiple antioxidant evaluation systems when characterizing honey bioactivity.
The substantial variation in sugar composition further differentiates the honey types. KH1 displayed the highest F+G content, approaching values reported in Nigerian honey, whereas KH2 showed significantly lower monosaccharide levels.28 Reduced F+G content in stingless bee honey may reflect higher proportions of other sugars such as maltose or oligosaccharides, which have been reported in Meliponini honey. This compositional complexity could influence glycemic response and warrants further targeted carbohydrate profiling.28 With the exception of glucose, the sugar profiles of honey samples taken from several locations in Tanzania revealed notable differences in the majority of sugar components.29 These differences may be influenced by factors such as floral source, environmental conditions, bee species, and regional climatic variations. The analysis of sugar composition is an important parameter in honey quality evaluation, as the proportions of major sugars such as fructose and glucose directly affect the physicochemical properties, sweetness, viscosity, and crystallization behavior of honey. Furthermore, sugar profiling serves as a reliable approach for detecting honey adulteration, particularly the addition of commercial sugars or sugar syrups, thereby ensuring the authenticity, purity, and safety of honey products for consumers.30
Collectively, these findings position KH2 (Kelulut honey from Kelantan) as a mineral-rich, phenolic-dense, high-antioxidant honey with distinctive physicochemical characteristics. In contrast, TUF demonstrated superior carbohydrate and energy values, suggesting potential use as a rapid natural energy source. The data clearly illustrate that Malaysian honey varieties cannot be evaluated under a single compositional framework, as bee species biology, ecological conditions, and floral diversity exert synergistic effects on physicochemical and functional attributes.
The findings reveal that Kelulut honey from Kelantan (KH2) possesses a uniquely enriched mineral matrix and exceptionally high polyphenolic density, translating into markedly superior antioxidant capacity compared to the other varieties examined. This integrative evidence not only distinguishes stingless bee honey as a functionally distinct category from Tualang honey but also highlights the significant influence of geographical and botanical origin on compositional quality. By demonstrating strong associations between mineral richness, phenolic content, electrical conductivity, color intensity, and antioxidant activity, this work advances current understanding of honey functionality beyond conventional compositional reporting. These insights position Malaysian Kelulut honey, particularly KH2 as a promising candidate for high-value functional food and nutraceutical applications, while providing a scientific basis for authentication, quality differentiation, and commercial valorization in the global honey market.
Conclusion
The comprehensive analysis of Kelulut and Tualang honeys from various regions has yielded valuable insights that have improved our fundamental comprehension of these nutritious foods. The honey samples analyzed in this study were found to be rich in carbohydrates and energy, while their protein, ash, and fiber contents were comparatively low. Sample KH1 exhibited the highest glucose concentration (40.983 ± 0.941 g/100g) as determined by chromatographic analysis, whereas TUF had the lowest among the four samples (22.857 ± 2.192 g/100g). KH2 stood out with the highest concentrations of three macrominerals (potassium, calcium, and magnesium) as well as three trace minerals (manganese, cobalt, and barium). According to WHO recommendations, toxic element analysis verified that the analyzed honey samples in this study are safe to consume. Physical characteristics varied among samples, with KH2 displaying higher electrical conductivity (EC) and mm Pfund values. Moreover, according to TPC (33.711±0.590 mg GAE/100g) and TFC (2.217±0.126 mg QE/100g), KH2 had the highest antioxidant values as well as the strongest antioxidant activities, as indicated by DPPH (84.521±1.859 %) and FRAP (368.472±0.939 µM TE/100g) assays. Based on the findings, KH2 honey is a viable option for functional food applications, health supplements, and natural cosmetic formulations due to its excellent nutritional and antioxidant characteristics. Future study should concentrate on the long-term health consequences, underlying molecular mechanisms of its antioxidant activities, and bioavailability and metabolomic profiling of its bioactive substances.
Acknowledgement
The authors would like to thank Kulliyyah of Allied Health Sciences, International Islamic
University Malaysia (IIUM) for the facilities provided.
Funding Sources
The author(s) received no financial support for the research, authorship, and/or publication of this article.
Conflict of Interest
The author(s) do not have any conflict of interest.
Data Availability Statement
This statement does not apply to this article.
Ethics Statement
This research did not involve human participants, animal subjects, or any material that requires ethical approval.
Informed Consent Statement
This study did not involve human participants, and therefore, informed consent was not required.
Clinical Trial Registration
This research does not involve any clinical trials.
Permission to Reproduce Material from Other Sources
Not Applicable
Author Contributions
- Badr Eddin Kharsa: Investigation, Formal Analysis, Writing – Original Draft
- Nor Hafizah Zakaria : Writing-Review and Editing
- Muhammad Ibrahim: Conceptualization, Supervision, Project Administration
- Mohd Nur Nasyriq Anuar: Data Collection
- Fadzilah Adibah Abdul Majid: Validation
- Nur Maizatul Idayu Othman: Writing-Review and Editing
- Abdullah Hagar: Visualization
References
- Wang J., Hao J., Wang J., et al. Preparation of Functional Food with Enhanced Antioxidant Properties by Adding Aronia melanocarpa Polyphenol Honey. 2024;13(23):3852. https://doi.org/10.3390/foods13233852
CrossRef - Sakika K. A., Saiman M. Z., Zamakshshari N. H., et al. Analysis of Antioxidant Properties and Volatile Compounds of Honey from Different Botanical and Geographical Origins. Sains Malay. 2022;51(4):1111–1121. https://doi.org/10.17576/jsm-2022-5104-13
CrossRef - Al-Kafaween M. A., Alwahsh M., Mohd Hilmi A. B., et al. Physicochemical Characteristics and Bioactive Compounds of Different Types of Honey and Their Biological and Therapeutic Properties: A Comprehensive Review. Antibiotics. 2023;12(2):337. https://doi.org/10.3390/antibiotics12020337
CrossRef - Kek S. P., Chin N. L., Yusof Y. A., et al. Classification of entomological origin of honey based on its physicochemical and antioxidant properties. Int J Food Prop. 2017;20:S2723–S2738. https://doi.org/10.1080/10942912.2017.1359185
CrossRef - Anuar M. N. N., Ibrahim M., Zakaria N. H., et al. The Antioxidant Activity and Induction of Apoptotic Cell Death by Musa paradisiaca and Trigona Honey Jelly in ORL115 and ORL188 Cells. Malays J Med Sci. 2023;30(1):82-91. http://doi:10.21315/mjms2023.30.1.7
CrossRef - Abdul Rafa A. A., Ibrahim M., Zakaria N. H., et al. Physicochemical and Sensory Attributes of Trihoney Blend (Trigona, Apis mellifera, and Apis dorsata) for Enhanced Antioxidant Optimization using Response Surface Methodology (RSM). IIUM Med J Malay. 2024;23(03). https://doi.org/10.31436/imjm.v23i03.2521
CrossRef - Mohd Kamal D. A., Ibrahim S. F., Kamal H., et al. Physicochemical and Medicinal Properties of Tualang, Gelam and Kelulut Honeys: A Comprehensive Review. 2021;13(1):197. https://doi.org/10.3390/nu13010197
CrossRef - Association of Official Analytical Chemists. Official Methods of Analysis (16th). USA: AOAC Inc. 1997.
- Barreiros J., Cepeda A., Franco C., et al. Analysis of minerals in honey and their nutritional implications. J Food Compos Anal. 2024;136:106733. https://doi.org/10.1016/j.jfca.2024.106733
CrossRef - Paula V. B., Sousa-Dias M. L., Seixas N. L., et al. Phenolic Class Analysis in Honey: Comparison of Classical and Single UV Spectrum Methodologies. Processes. 2024;12(10):2297. https://doi.org/10.3390/pr12102297
CrossRef - Rysha A., Kastrati G., Biber L., et al. Evaluating the Physicochemical Properties of Some Kosovo’s and Imported Honey Samples. Appl Sci. 2022;12(2):629. https://doi.org/10.3390/app12020629
CrossRef - Anuar M. N. N., Zakaria N. H., Ibrahim M., et al. Physicochemical, Phytochemical, and Shelf-Life Studies of a Functional Jelly from Banana (Musa paradisiaca) and Malaysian Stingless Bee Honey (Trigona). Curr Res Nutr Food Sci. 2022;10(2). doi : http://dx.doi.org/10.12944/CRNFSJ.10.2.24
CrossRef - Boussaid A., Chouaibi M., Rezig L., et al. Physicochemical and bioactive properties of six honey samples from various floral origins from Tunisia. Arab J Chem. 2018;10:265-274. http://doi:10.1016/j.arabjc.2014.08.011
CrossRef - Chuttong B., Chanbang Y., Sringarm K., et al. Physicochemical profiles of stingless bee (Apidae: Meliponini) honey from South East Asia (Thailand). Food Chem. 2016;192:149–155. https://doi.org/10.1016/j.foodchem.2015.06.089
CrossRef - Codex Alimentarius Commission. Codex Alimentarius Commission Standards. CODEX STAN 12-1981, 2001;1–8.
- Alqarni AS, Owayss AA, Mahmoud AA, Hannan MA. Mineral content and physical properties of local and imported honeys in Saudi Arabia. J Saudi Chem Soc 2014;18(5):618–625. https://doi.org/10.1016/j.jscs.2012.11.009
CrossRef - Rodríguez-Ramos F., Marcano E., Aguiar G., et al. Mineral composition of artisanal and commercial honeys from Venezuela: a comparison of sample pre-treatment strategies. SN Appl Sci. 2020;2:2080. https://doi.org/10.1007/s42452-020-03917-2
CrossRef - Haider Z., Qamer S., Kanwal S., et al. Assessment of essential minerals and physico-chemical analysis of floral origins fresh honey produced by Apis mellifera. Brazil J Biol. 2024;84:e263534. https://doi.org/10.1590/1519-6984.263534
CrossRef - Batista B. L., da Silva L. R. S., Rocha B. A., et al. Multi-element determination in Brazilian honey samples by inductively coupled plasma mass spectrometry and estimation of geographic origin with data mining techniques. Food Res Int. 2012;49(1):209–215. https://doi.org/10.1016/j.foodres.2012.07.015
CrossRef - Czipa N., Andrási D., Kovács B. Determination of essential and toxic elements in Hungarian honeys. Food Chem. 2015;175:536–42. https://doi.org/10.1016/j.foodchem.2014.12.018
CrossRef - Filipe M. S., Kowalczyk T., Kukula-Koch W., et al. Evaluating the quality, physicochemical properties, and biological activities of Centauri® honey from Turkey. Food Biosci. 2024;3(62):105028. https://doi.org/10.1016/j.fbio.2024.105028
CrossRef - Otmani A., Amessis-Ouchemoukh N., Birinci C., et al. Phenolic Compounds and Antioxidant and Antibacterial Activities of Algerian Honeys. Food Biosci. 2021;42:101070. http://doi:10.1016/j.fbio.2021.101070
CrossRef - World Health Organization (WHO). Evaluation of certain food additives and contaminants. Fort. Fourty-First Report of the Joint FAO/WHO Expert Committee on Food Additives (JECFA).Technical Report Series 896. Geneva. 1999.
- World Health Orgaization (WHO). Evaluation of certain food additives and contaminants: Seventy-Seventh Report of the Joint FAO/WHO Expert Committee on Food Additives.Technical Report Series 983.Geneva. 2013;896:1–128.
- Becerril-Sánchez A. L., Quintero-Salazar B., Dublán-García O., et al. Phenolic Compounds in Honey and Their Relationship with Antioxidant Activity, Botanical Origin, and Color. 2021;10(11):1700. https://doi.org/10.3390/antiox10111700
CrossRef - Smetanska I., Alharthi S. S., Selim K. A. Physicochemical, antioxidant capacity and color analysis of six honeys from different origin. J King Saud Univ Sci. 2021;33(5): 101447. https://doi.org/10.1016/j.jksus.2021.101447
CrossRef - Pérez-Gálvez A., Viera I., Roca M. Carotenoids and Chlorophylls as Antioxidants. 2020;9(6):505. https://doi.org/10.3390/antiox9060505
CrossRef - Buba F., Gidado A., Shugaba A. Analysis of Biochemical Composition of Honey Samples from North-East Nigeria. Biochem Anal Biochem. 2013;2(3):1-7. http://doi.org/4172/2161-1009.1000139
CrossRef - Mongi R. J., Ruhembe C. C. Sugar profile and sensory properties of honey from different geographical zones and botanical origins in Tanzania. Heliyon. 2024;10(18):e38094. http://doi.10.1016/j.heliyon.2024.e38094
CrossRef - Al-Hetlani E., D’Cruz B., Hayssam M., et al. Evaluating Honey Adulteration Through Physicochemical Characterization and Liquid Chromatography-Mass Spectrometry-Based Sugar Profiling. Foods. 2026;15(6):1038. http://doi.10.3390/foods15061038.
CrossRef
Abbreviations
DPPH: 2,2-Diphenyl-picrylhydrazyl
EC: Electrical conductivity
FRAP: Ferric reducing antioxidant power assay
ICP-MS: Inductively coupled plasma mass spectrometer
KH1: Kelulut honey from Kedah
KH2: Kelulut honey from Kelantan
TCC: Total carotenoid content
TFC: Total flavonoid content
TPC: Total phenolic content
TSS: Total soluble solids
TUF: Tualang honey (farmed)
TUW: Tualang honey (wild)
 PlumX:
 Views: 2070
  PDF Downloads:
267
PDF Downloads:
267 
Accepted on: 17 Jun 2026
Second Review by: Sani Jirasatid
Final Approval by: Dr. Shih-Min Hsia





Web of Science Coverage
Emerging Sources Citation Index (ESCI)
2024 Journal Impact Factor: 1.1
Scopus Journal Metrics
CiteScore 2025: 2.6
CiteScore Details
Sustainable Nutrition: Food Systems, Nutrient Retention, and Public Health Impact
This journal is a member of, and subscribes to the principles of, the Committee on Publication Ethics (COPE)