Assessment of Food and Nutrition Insecurity Using Food Consumption Data in Central Sudan
 and Raga M. Elzaki 1, 3
 1Department of Agribusiness and Consumer Sciences, College of Agricultural and Food Sciences - King Faisal University, Al-hsa, Al Hofuf, Saudi Arabia.
2Agricultural Research Corporation (ARC) - Agricultural Economics and Policy Research Centre (AEPRC) - Shambat, Sudan.
3Department of Rural Economics and Development - Faculty of Animal Production- University of Gezira, Sudan.
Corresponding Author Email: ssabdalla@kfu.edu.sa
DOI : http://dx.doi.org/10.12944/CRNFSJ.10.3.25
Download this article as:
![]()
This study aims to assess the food and nutrition insecurity among different income quintiles in Central Sudan. Particularly, it seeks to determine the level of dietary energy consumption (DEC) and other macronutrients intake. In addition, it estimates the Engel ratios and income elasticity of food demand. A sample of about 668 households was selected from Khartoum State to collect the primary data during the year 2017. Primary data was collected through two types of questionnaires, the structured household questionnaire, and the 24-hour food recall questionnaire. The data was analyzed using descriptive statistics and One-way ANOVA Table. The outcomes prove that income contributes extensively to DEC as well as intakes of protein, carbohydrates, and fat. The households in the lowest income quintile spend a high monetary value to purchase foods when compared with households in other income quintiles. The Engel ratios exhibit that the share of food consumption from the total income for the lowest income quintile is about 62%, which is higher relative to the highest income quintile (43.6%). In addition, Engel ratios varies significantly among the income quintiles at level 1%. The income elasticity of food demand in dietary energy consumption is higher for the lowest income quintile (0.49) than the highest income quintile (0.23). This indicates that a little increase in income will contribute significantly to better nutritional status for the lowest income quintile. Eventually, the paper recommends improving income earnings through income-based policies to reduce the level of food deprivation. The government should adopt specific market policies that focus on the low-income level to enhance access to nutritious foods.
KEYWORDS:Dietary Energy Consumption; Elasticity of Food Demand; Engel Ratio; Income Quintiles; Monetary Value; Nutrients Intake
Introduction
Many definitions that reflect/ describe the main concepts of food security have been launched during the last decade. The term food security has been defined as follows: “Food security exists when all people, at all times, have physical and economic access to sufficient, safe and nutritious food to meet their dietary needs and food preferences for an active and healthy life.”1 Lately, the term of nutrition has been widely used together with food security. Accordingly, many definitions have revealed the real and big overlap between nutrition security and food security. Therefore, food and nutrition security can be described as “a condition under which adequate food (quantity, quality, safety, and socio-cultural acceptability) is available and accessible for and satisfactorily utilized by all individuals at all times to live a healthy and happy life.”2 Nowadays, food and nutrition security has become an important and hot issue. Food and nutrition security is essential to ensure that people live with an adequate level of nutrition with zero hunger levels.3 Thus, to achieve such a level, there is a need to consider the four dimensions of food and nutrition security. These are namely availability, accessibility, utilization, and food stability. Consequently, any buckle in any one of the four pillars will eventually cause food and nutrition insecurity.
Due to different complicated issues, food and nutrition insecurity remains an important dilemma worldwide. In developing countries, food insecurity is causing different forms of malnutrition. About 9.2 percent of the world population was exposed to severe levels of food insecurity in 2018, due to fewer quantities of food consumed that might have lead directly to hunger. The prevalence of undernourishment in Africa increased from 18.3% in 2015 to 19.8% in 2018.4
In Sudan, like in many other developing countries, the agriculture and livestock sectors are playing an important role in supporting and sustaining the economy. Sudan’s economy is based fundamentally on the agricultural sector that offers food and jobs for the majority of the population. However, the agricultural production remains undeveloped due to different factors such as frequent droughts caused by climate change, inadequate infrastructure, misuse of economic resources, and ineffective agricultural policies.5 Thus, Sudan has been classified as a low-income country, according to World Bank. Low-income households exhibit a higher income elasticity of food demand than high-income households.6 Moreover, Sudan has also suffered from the unequal distribution of economic resources within the country, which has created a high variation in wealth and living conditions among the states. Consequently, Sudan has been recorded as a food and nutrition insecurity country7.
Culturally, food consumption in Sudan depends mainly on energy foods. The main staple Sudanese foods consist of sorghum, wheat, and millet. Thus, a diet depending on energy foods as well as inappropriate methods of food preparation may lead to an imbalance in foods intake. This creates nutrition diseases and health problems.8 Statistical nutrition data showed that the prevalence of undernourishment in Sudan is about 31% and 34% for urban and rural populations, respectively, with considerable variation among the states. This is mainly due to inadequate food consumption and insufficient foods to meet the dietary energy requirements. Alternatively, the depth of hunger was recorded as 344 Kcal at the national level with 343 Kcal and 344 Kcal in urban and rural areas, respectively.9 Moreover, about 2.2 million children less than five years old were affected by stunted growth.10 These figures gave a good sign that food and nutrition insecurity is widespread in the country.
Therefore, the overall objective of this paper is to assess food and nutrition insecurity in Central Sudan. Specifically, the paper aims to determine the level of food consumption groups, as well as the monetary value of food consumption. It seeks to estimate the average level of dietary energy consumption (DEC) as well as the macronutrients intake of protein, carbohydrates, and fat. Additionally, the paper also intends to analyze the Engel ratio and income elasticity of food demand. Moreover, the paper proposes some effective policies that are expected to solve the problems of food and nutrition insecurity in Khartoum State and Sudan as a whole.
Research methodology
Study area
Sudan is the third-largest country in Africa with an area of approximately 1,88 square kilometers.11 Sudan consists of 18 states. Each state is divided into localities and administrative units. Khartoum State is located in the central part of the country and it represents the capital of Sudan. It consists of three main localities; these are Bahari, Omdurman, and Khartoum. Khartoum State is a more civilized city compared with other states. The numbers of population in Khartoum State were estimated to be more than eight million inhabitants.12 The majority of the population in Khartoum State works in the government offices and the private sector. The State’s population came from many parts of the country and this reflects their diversity in customs and norms. The current diversity in Khartoum’s population contributed significantly to the variation in both food consumption patterns and level of food intake. In late 1980, Khartoum city received a large number of migrants from the rural areas, due to poor conditions in their places of origin. Additionally, large numbers of internally displaced people (IDPs) came to Khartoum to search for jobs and better living conditions due to the conflict and inadequate situations in their states. Therefore, Khartoum became an inhabited area. This dilemma affected the food patterns and habits and resulted into higher food consumption levels.13
Consequently, all these factors have had an impact on food and nutrition security status. Khartoum State was selected as the case study because the literature highlights a greater food insecurity in the urban areas.14, 15, 16, 17
Household sampling and data collection
The total number of households in Khartoum State was obtained from the Central Bureau of Statistics (CBS) to select the sample in the year 2017. The random sampling technique was applied to select the sample of 668 households from the three main localities that constitute Khartoum State. In Sudan, the head of the households responsible from food purchase and food cooking for their household’s members. Therefore, it would be benefit to make the interview with them. Accordingly, the numbers of male and female-headed households in the sample were about 350 and 318, respectively. The study essentially depended on the comprehensive primary data set using the household survey. The primary data was collected by using two types of questionnaires which are the structured household questionnaire and the 24-hour food recall questionnaire. The structured questionnaire applied to collect the data was related to the household size, household income, food consumption as well as household food and non-food expenditures. On the other hand, the food recall questionnaire was designed to gather the daily food consumption data by asking the household members to record the quality and quantity of foods that they had eaten during the last 24 hours. The 24-hour food recall questionnaire was also used to assemble the costs of food consumed by household members besides the food eaten outside the home. Additionally, the study also depended on secondary data taken from relevant sources.
Data analysis
The total sample of the households was divided into five groups based on the total income earned by the households per month. Accordingly, these groups are the lowest income quintile ≤ 2000 Sudanese Pound (SDG), the low-income quintile 2001-3000 SDG, the middle-income quintile 3001-4000 SDG, the high-income quintile 4001-5000SDG, and the highest income quintile ≥ 5000 SDG. The household income is a major determinant of food accessibility. Thus, the income is one of the non-spatial factors of access to food.18
The 24-hour food recall questionnaire was used to collect the data about food quality and quantities of daily food consumed by household members. All quantities of consumed food recorded in the questionnaire were transformed from the local measure units into standard measure units in grams (g). Thus, due to the variations in the household size, ages, gender, and physiological status, there is a need to apply the adult male equivalent. The adult male equivalent is used to provide a standard measurement that accounts for heterogeneous households.19 Therefore, all household members in the sample were converted into adult male equivalent to calculate the average daily food consumption per person, the dietary energy intake and other nutrients intake as well as the costs of daily food consumption. The quantities of daily food consumed by the households were converted into energy intake (Kcal/ person/day) and other nutrients intake (protein, carbohydrates, fat) (g/ person/day) by using the West Africa food composition table. For every 100 grams of edible food, the food composition table comprised the information on the edible portion and energy and nutrients content of each food item.20
Estimation of energy and macronutrients intake
The estimation of daily energy and macronutrients intake (protein, carbohydrates, fat) per capita basis was calculated by using the following equation 21:
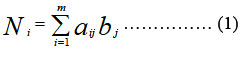
Where
N i : The daily nutrients intake (energy, protein, carbohydrates, fat) for ith individual in the study.
a ij : The weight in grams of the average daily food commodity j by ith individual
b j : The standardized food energy (kcal), protein (g), carbohydrates (g), and fat (g) content in the 100 grams for each jth food commodity
Estimation of Engel ratio
The Engel ratio expresses the relationship between budgets allocated for a particular commodity (i.e. food) and total income where there are no price effects. The following model depicts the estimation of the Engel ratio.22:
![]()
w i : Represents the budget share of food commodity
Where Yi is the total income, the intercept coefficient, and is the income coefficient.
Income elasticity of food demand
In general, the income elasticity of demand is defined as the percentage change in the quantity demanded when income approximately changes by 1% and other factors remain constant.23The income elasticity of demand for any commodity is measured by using the following equation.24
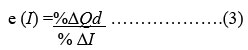
Where: e (I): represents the income elasticity of demand
%∆ Qd: the percentage change in the quantity demanded
% ∆I: the percentage change in income
The income elasticity of food demand measures the response for the food demand to a change in income. Based on equation No. 3, the following three models are applied to determine the income elasticity of food demand.
Income elasticity of food demand in dietary energy consumption (DEC):
The following formula expresses the relationship between the quantity of food in dietary energy consumption (fdeci) and income (Ii)
![]()
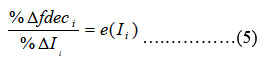
The income elasticity of food demand in dietary energy consumption (fdeci) is estimated by using the following equation:
Income elasticity of food demand in monetary value:
The below formula describes the relation between food in monetary value (fcmvi) and income (Ii)
![]()
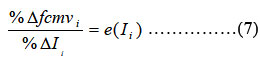
The income elasticity of food demand in monetary value was estimated by using the following equation:
Income elasticity of demand share of food consumption in monetary value:
The below function revealed the relationship between the share of food consumption in monetary value (sfcmvi) and income (Ii)
![]()
The income elasticity of demand share of food consumption in monetary value was calculated by this equation:
Moreover, the descriptive statistics such as frequency distributions, means, and percentages were calculated to provide a comprehensive picture about the income of households, food groups, dietary energy and nutrients intake, nutrients contribution to DEC, the monetary value of food consumption, Engel ratio, and income elasticity of food demand. Likewise , the analysis was also used the One-way ANOVA table (F-test) to assess if the dietary energy and nutrients intake, and Engel ratios are varies statistically among the income quintiles. Therefore, to analyze the data, the SPSS software program version 25 was applied.
Results
Households characteristics
Table 1 depicts the distribution of sampled households and household size among different income quintiles. The percentage of the households in the lowest income quintile is about 5.2% of the total households. In contrast, the households in the highest income quintile are about 40% of the total households. The average household size in the lowest income quintile is 10 persons, which is large relative to the average household size in the highest income quintile, (about six persons)
Table 1: Number of sampled households and household size (persons) among different income quintiles in Khartoum State, 2017
| Quintiles of income | Number of sampled households | Average household size (persons) |
| Lowest quintile | 35 (5.2%) | 10.0 |
| Low quintile | 94 (14.1%) | 8.9 |
| Middle quintile | 102(15.3%) | 8.1 |
| High quintile | 169 (25.3%) | 7.5 |
| Highest quintile | 268 (40.1%) | 6.1 |
| Total =668 (100) | Average =7.4 |
Food consumption by food commodity groups
The quantities of different food consumed depended on how much money the household or the person paid to get adequate and nutritious foods. Table 2 shows the average food consumption in monetary value (SDG/person/day) for different food groups. The monetary values paid to purchase cereal and cereal-derived products, vegetable products, and meat are about 0.51 SDG/person/day, 0.61 SDG/person/day, and 0.52 SDG/person/day, respectively. Alternatively, the monetary values paid to purchase pulses as well as sugars and syrups are about 0.32 SDG /person/day, and 0.17 SDG /person/day, respectively. Table 2 also reveals the contribution of different food groups to dietary energy consumption (DEC) (kcal/person/day), protein intake (g/person/day), carbohydrates intake (g/person/day), and fat intake (g/person/day). The averages DEC in cereal and cereal-derived products, as well as sugars, and syrups are about 933 kcal/person/day and 222 kcal/person/day, respectively. Likewise, the average energy in vegetable oils and fats is about 163 kcal/person/day. The average protein consumption in cereal and cereal-derived products is about 28.9 g/person/day. One the other hand, the average carbohydrates consumption in cereal and cereal-derived products is about 173.5 g/person/day. The average contribution of sugars and syrups to carbohydrates consumption is equal to 55.3 g/person/day. Alternatively, vegetable oils and fats contribute about 18.1 g/person/day to average fat consumption.
Table 2: Average food consumption in monetary value (SDG /person/day) and average consumption of DEC (kcal/person/day), protein (g/person/day), carbohydrate (g/person/day), and fat (g/person/day) by food commodity groups in Khartoum State, 2017
| Food groups | Average food consumption in monetary value (SDG /person/day) | Average dietary energy consumption (kcal/person/day) |
Average protein consumption (g/person/day) |
Average carbohydrates consumption (g/person/day) |
Average fat consumption (g/person/day) |
| Cereal and cereal-derived products | 0.51 | 933 | 28.9 | 173.5 | 9.3 |
| Sugars and syrups | 0.17 | 222 | 0.1 | 55.3 | 0.0 |
| Pulses | 0.32 | 26 | 1.8 | 2.1 | 1.1 |
| Oil crops | 0.04 | 16 | 0.9 | 0.7 | 1.0 |
| Vegetables and products | 0.61 | 21 | 1.1 | 3.1 | 0.2 |
| Fruits and fruit products | 0.08 | 6 | 0.1 | 1.4 | 0.0 |
| Spices & additives | 0.06 | 3 | 0.1 | 0.6 | 0.0 |
| Meat | 0.52 | 50 | 4.6 | 0.2 | 3.4 |
| Eggs | 0.02 | 7 | 0.5 | 0.1 | 0.5 |
| Fish and fish products | 0.04 | 1 | 0.1 | 0.0 | 0.0 |
| Milk and cheese | 0.09 | 54 | 2.2 | 6.4 | 2.2 |
| Vegetable oils and fats | 0.15 | 163 | 0.0 | 0.0 | 18.1 |
| Non-alcoholic beverages | 0.00 | 1 | 0.0 | 0.1 | 0.0 |
| Purchased food is eaten away from home | 0.01 | 4 | 0.1 | 0.5 | 0.1 |
Average dietary energy and nutrients intake
Table 3 depicts the average DEC (kcal/person/day) and other nutrient intakes (g/ person/ day) among different income quintiles. The averages DEC among the lowest and low-income quintiles are about 1506 kcal/person/day and 1984 kcal/person/day, respectively. The average DEC among the middle-income quintiles is around 2188 kcal/person/day. Generally, the average DEC for the total sample is about 2472 kcal/person/day. The averages of protein consumption for the highest and lowest income quintiles are about 90.42 g/person/day and 40.47 g/person/day, respectively. The average fat consumption for the highest income quintile is equal to 88.18 g/person/day, which is high relative to other income quintiles. The averages of carbohydrates intake for the highest income quintile and lowest income quintile are equal to 495.89 g/person/day and 244.10 g/person/day, correspondingly.
Table 3: Dietary energy consumption (DEC) (kcal/person/day) and nutrients intake (g/person/day) by income quintiles in Khartoum State, 2017
| Income quintiles | Number of sampled households | Average dietary energyconsumption (kcal/person/day) | Averageprotein intake (g/person/day) | Averagefat intake (g/person/day) | Average carbohydratesintake (g/person/day) |
| Lowest quintile | 35 (5.2%) | 1506 | 40.47 | 36.00 | 244.10 |
| Low quintile | 94 (14.1%) | 1984 | 54.85 | 40.11 | 335.72 |
| Middle quintile | 102(15.3%) | 2188 | 57.29 | 48.06 | 364.59 |
| High quintile | 169 (25.3%) | 2401 | 62.63 | 60.71 | 385.96 |
| Highest quintile | 268 (40.1%) | 3220 | 90.42 | 88.18 | 495.89 |
| Total | 668 (100) | 2472 | 67.19 | 61.33 | 396.18 |
| F-values | 86.05*** | 55.42*** | 12.93*** | 39.65*** |
Note: *** indicates the significant level at 1%
Nevertheless, Table 4 reveals the percentage share of protein, fat, and carbohydrates to DEC among different income quintiles. The shares of protein to DEC for the highest income quintile and lowest income quintile are about 11.27% and 10.73%, respectively. The share of protein to DEC in the total sample is approximately 10.78%. The shares of fat intake to DEC intake for the highest income quintile and lowest income quintile are about 25.59% and 21.98%, correspondingly. The share of carbohydrates and alcohol to DEC is high for the lowest income quintile (67.29%) compared to the highest income quintile (63.15%)
Table 4: Nutrients contribution to DEC at different income quintiles in Khartoum State, 2017
| Income quintiles | Number of sampled households | Share of protein to DEC (%) | Share of fat to DEC (%) | Share of total carbohydrates and alcohol to DEC (%) |
| Lowest quintile | 35 (5.2%) | 10.73 | 21.98 | 67.29 |
| Low quintile | 94 (14.1%) | 10.87 | 20.71 | 68.42 |
| Middle quintile | 102(15.3%) | 10.31 | 21.47 | 68.21 |
| High quintile | 169 (25.3%) | 10.45 | 22.68 | 66.87 |
| Highest quintile | 268 (40.1%) | 11.27 | 25.59 | 63.15 |
| Total | 668 (100) | 10.78 | 22.96 | 66.26 |
Average food consumption and total consumption
The households spend their income to purchase food and non-food commodities. Table 5 exposes the average food consumption in monetary value among different income quintiles. The average food consumption among the lowest income quintile is about 3.04 SDG/person/day whereas the average food consumption among the highest income quintile is about 18.17 SDG/person/day. Table 5 also depicts the average total consumption (foods and non-foods) in monetary value (SDG /person/day) and share of food consumption from total consumption. The average total consumption for the lowest income quintile is equal to 4.78 SDG /person/day and the average total consumption for the highest income quintile is about 47.23 SDG /person/day. On the other hand, the share of food consumption from the total consumption in the lowest income quintile is a concerning 63.6%. Nevertheless, the share of food consumption from the total consumption in the highest income quintile is about 38.5%.
Table 5: Average food consumption and average total consumption in monetary value by different income quintiles in Khartoum State, 2017
| Income Quintiles | Number of sampled households | Average food consumption in monetary value (SDG/person/day) | Average total consumption (food and non-food) in monetary value (SDG/person/day) | % share of food consumption from the total consumption |
| Lowest quintile | 35 (5.2%) | 3.04 | 4.78 | 63.6 |
| Low quintile | 94 (14.1%) | 4.80 | 8.21 | 58.5 |
| Middle quintile | 102(15.3%) | 6.29 | 12.36 | 50.9 |
| High quintile | 169 (25.3%) | 10.05 | 19.06 | 52.7 |
| Highest quintile | 268 (40.1%) | 18.17 | 47.23 | 38.5 |
| Total | Total =668 (100) | 10.40 | 23.55 | 44.16 |
| F- values | 33.36*** | 17.88*** | 21.20** |
Note: *** indicate the significant level at 1%
Share of food sources among the income quintiles
Table 6 presents the share of food consumption (in both dietary energy and monetary value) from different food sources by income quintiles in Khartoum State, 2017. For the lowest income quintile, the shares of purchased food are about 97.59% and 96.44% in total food consumption to energy intake and monetary value, respectively. Likewise, for the highest income quintile, the shares of purchased food in total food consumption are approximately 95.09% and 93.89% to energy intake and monetary value, respectively. Conversely, for the same income quintile, the shares of own-produced food in total food consumption are around 2.15% and 2.92% to energy intake and monetary value, respectively as shown in Table 6. At the same time, in the highest income quintile, approximately 2.67% of energy intake comes from food consumed away from home
Table 6: Share of food consumption in dietary energy and monetary values from different sources by income quintiles in Khartoum State, 2017
| Incomequintiles | Number of sampled households | Share of foodPurchased in total food consumption (%) | Share of own-produced food in the total food consumption (%) | Share of food consumed away from home in the total food consumption (%) | Share of foodConsumed from other sources in the total food consumption (%) | ||||
| Energy intake | Monetary value | Energy intake | Monetary value | Energy intake | Monetary value | Energy intake | Monetary value | ||
| Lowest quintile | 35(5.2%) | 97.59 | 96.44 | 2.15 | 2.92 | 0.23 | 0.23 | 0.03 | 0.41 |
| Low quintile | 94(14.1%) | 96.53 | 97.50 | 2.73 | 1.02 | 0.71 | 0.87 | 0.03 | 0.61 |
| Middle quintile | 102(15.3%) | 97.51 | 96.56 | 1.40 | 0.91 | 0.80 | 0.79 | 0.30 | 1.74 |
| High quintile | 169 (25.3%) | 95.87 | 94.83 | 1.95 | 2.83 | 1.41 | 1.29 | 0.77 | 1.06 |
| Highest quintile | 268 (40.1%) | 95.09 | 93.89 | 1.53 | 2.36 | 2.67 | 2.55 | 0.70 | 1.20 |
| Total | 668 (100) | 96.17 | 95.46 | 1.88 | 2.02 | 1.47 | 1.43 | 0.47 | 1.09 |
| F-values | 39.02*** | 16.28*** | 1.95 | 1.15 | 1.25 | 2.02 | 3.99* | 5.36** | |
Note:*, **, and *** indicates the significant level at 10%, 5% and 1%, respectively
Total income and Engel ratio
Table 7 displays the average income (SDG/person/day) and average dietary energy unit values (SDG/1000 kcals). The average income for the lowest income quintile and low-income quintile is 4.61 SDG /person/day and 8.04 SDG /person/day, correspondingly. The households in the lowest income quintile pay 2.15 SDG for 1000kcals, while the households in the highest income quintile pay 5.98 SDG for 1000kcals. Moreover, the table also depicts the share of food consumption in total income (Engel ratio). The Engel ratios for the lowest income quintile and highest income quintile are about 62% and 43.6%, respectively
Table 7: Average income (SDG/person/day), average dietary energy unit values (SDG/1000 kcals), and Engel ratio by income quintiles in Khartoum State, 2017
| Income Quintiles | Number of sampled households | Average income (SDG /person/day) | Averagedietary energy unit value (SDG /1000 kcals) | Share of food consumption in total income (%) (Engel ratio) |
| Lowest quintile | 35 (5.2%) | 4.61 | 2.15 | 62 |
| Low quintile | 94 (14.1%) | 8.04 | 3.28 | 58.8 |
| Middle quintile | 102(15.3%) | 12.23 | 3.52 | 50.8 |
| High quintile | 169 (25.3%) | 18.96 | 4.59 | 52.5 |
| Highest quintile | 268 (40.1%) | 47.03 | 5.98 | 43.6 |
| F-values | 22.49*** | 15.04*** | 33.87*** |
Note: *** indicates the significant level at 1%
Income elasticity of food demand
Table 8 presents the income elasticity of food demand in dietary energy consumption and monetary value. The income elasticity of food demand in dietary energy consumption for the lowest income quintile is equal to 0.49. In contrast, the income elasticity of food demand in monetary value for the lowest quintile income is equal to -7.06. The income elasticity of food demand in monetary value for the low-income quintile is about 1.35. Furthermore, the table also reveals the income elasticity of food demand in a share of food consumption in monetary value (Engel ratio). The shares of food consumption in monetary value (Engel ratio) are 0.85%, 0.84%, 0.83%, and 0.82%, for the lowest, low, middle, and high-income quintiles, respectively.
Table 8: Income elasticity of food demand in dietary energy consumption, monetary value, and share of food consumption in monetary value in Khartoum State, 2017
| Income Quintiles | Number of sampled households | Elasticity of food demand in dietary energy consumption (%) | Elasticity of food demand in monetary value (%) | Elasticity of food demand in a share of food consumption in monetary value (%) |
| Lowest quintile | 35 (5.2%) | 0.49 | -7.06 | 0.85 |
| Low quintile | 94 (14.1%) | 0.38 | 1.35 | 0.84 |
| Middle quintile | 102(15.3%) | 0.33 | 0.86 | 0.83 |
| High quintile | 169 (25.3%) | 0.28 | 0.62 | 0.82 |
| Highest quintile | 268 (40.1%) | 0.23 | 0.42 | 0.78 |
Discussion
Households characteristics
A previous study showed that the household income is a key determinant of household food expenditures. The household size has a significant impact on food expenditures.25 This implies that the large household size that is suffering from very low income may experience a lack of access to adequate foods and hence raises food insecurity troubles. Generally, the average household size in Khartoum State is approximately 7.0 persons (as shown in Table 1). A similar result found that small household size is characterized by higher income.26
Food consumption by food commodity groups
The results in Table 2 exhibits that cereal and cereal-derived products are the most important foods for the households. In contrast, the households paid less money to consume fruit and fruit products, spices and additives, and other food groups. Low costs of food eaten away from home indicate that the household mostly depends on food prepared at home.
The value of DEC implies that cereal and cereal-derived products, as well as sugars, and syrups contain a higher value of energy and therefore, they contribute a greater share to DEC. Also, cereal and cereal-derived products add high value to protein consumption. Conversely, cereal and cereal-derived products contribute a high amount of carbohydrates compared with other food groups. An analogous study mentioned that cereals are the major sources of energy and protein intake and that they are the dominant source of carbohydrates in the human diet.27
Table 2 also indicates that a high quantity of carbohydrates in the food’s diet is attributed to cereal and cereal-derived products as well as sugars and syrups. The vegetable oils and fats contribute to high fat intake compared with other food groups.
Average dietary energy and nutrients intake
The minimum dietary energy requirement is defined as “the state of having a food consumption level that is below the needed by an average individual to maintain the minimum acceptable body weight and performing physical activity.”28 The minimum dietary energy intake for Sudanese people is equal to 2180 kcal/ person/ day.9 Table 3 show that the households in the lowest, low, and middle-income quintiles have less energy intake than the minimum energy requirement of 2180 kcal/ person/ day. The inadequate level of DEC in Central Sudan causes food deprivation. Moreover, the lower cost of energy in the low-income quintile might be due to the low nutritional quality of consumed food.28
The averages of consumption protein, fat and carbohydrates are high for the highest income quintile in compared to the lowest income quintile. Additionally, the F-values point out that the average dietary energy intake (86.05***), average protein intake (55.42***), average fat intake (12.93***) and average carbohydrates intakes (39.65***) are varies significantly among the income quintiles at level 1%. This proves that the households in the highest income quintile consumed a high amount of energy, protein, fat, and carbohydrates relative to households in other income quintiles counterparts. Therefore, income significantly contributed to DEC and other nutrient intakes.
According to Table 4, the nutrients contribution to DEC proves that the households in the lowest income quintile consume foods that contain a higher quantity of carbohydrates. Conversely, households in the highest income quintile consume foods that contain a higher amount of fat.
Average food consumption and total consumption
Table 5 depict that the households in the highest income quintile paid a high monetary value for food consumption relative to households in the lowest income quintile. This means that the lowest income quintile may be more sensitive to any change in food prices. Similar research discussed that the lower-income group broke and was susceptible to any increase in food prices due to high food expenditure in the future in Riyadh city.29
Likewise, the results of Table 5 also implies a big variation in total consumption among these income quintiles. Also, the share of food consumption from total consumption for the households in the lowest income quintile is high compared to the households in other income quintiles. The F-values for the average food consumption (SDG/person/day), average total consumption (food and non-food) (SDG/person/day) and share of food consumption from the total consumption are about 33.36***, 17.88***, and 21.20*** respectively. This proves that the food and non-food expenditures varies significantly among the income quintiles at level 1%. A parallel study found that the expenditures on animal source food (ASF) for the households in the lowest quintiles is greater compared to households in the highest quintiles.30
Share of food sources among the income quintiles
The shares of purchased food in total food consumption are higher in both energy intake and monetary value for all income quintiles. This indicates that all households in Khartoum State depend on the market to support their food security, as Khartoum is an urban area. The outcome underscores the importance of the market in accessing foods. The F-values show that the share of food purchased in total food consumption (%) significantly varies among the income quintiles in both energy intake (39.02***) and monetary value (16.28***) at 1% level as shown in Table 6.
The share of own-produced food in total food consumption and the share of food consumed away from home in the total food consumption are statistically insignificant among the income quintiles in both energy intake and monetary value. The share of food consumed from other sources in total food consumption is slightly low in both energy intake and monetary value for all households in different income quintiles. Moreover, the outcomes of F-value indicate that the shares of food consumed from other sources in the total food consumption in both energy intake and monetary value are significantly differs among the income quintiles at level 10% and 5%, respectively (See Table 6).
Total income and Engel ratio
It appears from the table 7 that the average income is very low, which is less than one dollar/day (One USD$ equal to 12SDG during survey time). This proves that a part of the population in Khartoum State is under the poverty line (i.e. poverty income). The F-value exposes that the average income (SDG /person/day) varies significantly among the income quintiles (22.49***) at level 1%. On the other hand, the discrepancies in the average dietary energy between the highest and the lowest income quintiles may be due to the quality and quantity of food consumed. This fact can be proved by the value of F-Test which shows that the average dietary energy unit value (SDG /1000 kcals) differs significantly among the income quintiles (15.04***) at level 1%. According to Engel’s law, the share of food expenditure in total expenditure decreases with increasing income. Thus, by increasing the average income, the Engel ratio is reducing. Likewise, the F-value shows that the share of Engel ratio varies significantly among the income quintiles (33.87***) at level 1%. A similar study in Mozambique discussed that the Engel ratio is higher for the population group with the lowest income and lower for the population group with the highest income.31
Income elasticity of food demand
Table 8 explains that if the income increases by 1%, this will contribute significantly towards improving the nutrition of the poor by 0.49%. However, the income elasticity of food demand in dietary energy consumption reduces when moving from the lowest income quintile to the highest income quintile. This prove that the income elasticity of food demand in dietary energy consumption is inelastic (less than one) for all households in all income quintiles. This coincides with the economic theory and confirms that food is a necessary commodity. An analogous study of food insecurity in Tajikistan found that the income elasticity values of food demand in dietary energy consumption is reduced when moving from lower-income decile to the higher income decile.32
The result of income elasticity of food demand in monetary value for the lowest quintile income indicates that the households in the lowest income quintile consumed inferior goods. Thus, the increase in income by 1% will drastically reduce the food expenditure by 7.06%. The outcome of income elasticity of food demand in monetary value for the low-income quintile means that by increasing the income by 1%, the food expenditure raises by 1.35% for the low-income quintile. This underlines the high sensitivity of this group to any change in income. On the contrary, the increase in the household income by 1% will lead to changing the food expenditure by 0.86%, 0.62%, 0.42% for the middle, high, and highest income quintiles, correspondingly. The income elasticity of food demand in dietary energy consumption is lower than the income elasticity of food demand in monetary value. A parallel study of food insecurity in Tajikistan found that the demand elasticity of food consumption in terms of monetary value is greater than the elasticity of food demand in dietary energy consumption.32
Furthermore, if income increase by 1% this contributes to a change in the share of food consumption in monetary value (Engel ratio) by 0.85%, 0.84%, 0.83%, and 0.82%, for the lowest, low, middle, and high-income quintiles, respectively. However, the demand elasticity of the share food consumption in monetary value for the highest income quintile is equal to 0.78. This means the increase in the income by 1% contributes a little change in the share of food consumption in monetary value (0.78%) compared with other income quintiles. Similar outcomes found that the demand elasticity of the food consumption share in monetary value in Tajikistan almost stabilized and disclosed little sensitivity with higher income.32 On the other hand; another study argued that the expenditure elasticity of food declined from 1996 to 2011 in Nepal. They also found that the elasticity of food demand was lower for the high expenditure group compared to that of the low expenditure group during the two periods.22
Conclusion and recommendation
The outcomes of this study depicted that the households paid a high monetary value to purchase cereals and cereal-derived products. This emphasized the fact that the majority of households depend chiefly on cereal foods. Thus, depending on such type of foods will create an imbalance nutrients intake since such types of foods lack of fat, vitamins and some of minerals. On the other hand, the income levels reflected big variations in DEC and other nutrient intakes among the households. This highlights the importance of income in enhancing the household’s food security in central Sudan. Thus, a little increase in the income will substantially improve the level of macronutrients intakes. Therefore, increasing the average household income among the income quintiles, the share of food consumption in total income is reduced (Engel ratio). Additionally, the income elasticity of food demand underscored the importance of increasing the income for the lowest income quintile. The income also has a positive impact on the demand of healthy foods and therefore, improving the nutrition status at the household’s level. Consequently, all these outcomes focused on the importance and dynamic role of income at the household’s level. On the other hand, the households depend predominately on the market to purchase and support their foods. Likewise, the market also is playing a chief role in enhancing the food accessibility and hence achieving food security.
Ultimately, the study suggests increasing the household income since it is playing a vital role in enhancing the household food and nutrition security. This condition can be realized through income-based policies that seek to reduce the level of food deprivation and hunger. The study also recommends supporting the market. This could be conducted via executing specific policies that target the low-income level. Besides income and market polices it is also important to encourage the consumption of nutritious food through spreading the knowledge and information regarding food contents and its nutrition values. Nutrition education is required to achieve food and nutrition security by different programs that promote the importance of nutritionally valuable and healthy foods.
Acknowledgment
The authors would like to thank all who contributed to the survey.
Conflict of Interest:
The authors declare no conflict of interest.
Funding Sources
The authors received no financial support for the research and publication of this article.
References
- World Food Summit Plan of Action. Rome Declaration on World Food Security. World Food Summit: FAO; 1996. Italy, Rome. http://www.fao.org/3/w3613e/w3613e00.htm.Accessed date 10.12.2021
- Weingärtner, The Concept of Food and Nutrition Security in K. Klennert (ed.). Achieving Food and Nutrition Security: actions to meet the global challenge – A training course reader (3rd Edition). Germany. In Went – International Weiterbildung gGmbH. 2009:21-48. https://wocatpedia.net/images/f/f3/ Inwent_%282009%29_Achieving_Food_and_Nutrition_Security.pdf
- Ghattas, H. Food security and nutrition in the context of the global nutrition transition. Technical Paper. FAO, Rome 2014. https://www.fao.org/3/i3862e/i3862e.pdf.
- FAO, IFAD, UNICEF, WFP and The state of food and nutrition security in the world. Safeguarding against economic Slowdowns and downturns. Rome, FAO, 2019. ISBN 978-92-5-131570-5. http://www.fao.org/3/ca5162en/CA5162EN.pdf.
- International Organization for Migration. Migration in Sudan: A Country Profile 2011, Khartoum (Sudan) 2011-ISBN 978-92-9068-595-1. https://reliefweb .int/sites/reliefweb.int/files/resources/D2ECC0D6226DF41DC1257842003973F1-Full_Report.pdf.
- Hymans, S. H., and Shapiro, H. T. The allocation of household income to food consumption. Journal of Econometrics,1976; 4(2): 167-188. https://doi.org/10.1016/0304-4076(76)90011-7
CrossRef
- Sudan Nutrition Profile. Sudan, FAO Food and Nutrition Division: FAO; 2005. http://bvsper.paho.org/texcom/nutricion/sdn.pdf.
- Abdalla, S. Food and nutrition security among the rural farm households in the dry land sector of Sudan. Vol 131- Farming and Rural System Economics. Germany; Margraf publishers GMBH. 2012- ISBN 978-3-8236-1631-3.
- CBS, SSCCSE, and SIFSIA. Food and nutrition security assessment in Sudan- analysis of 2009 National baseline household survey. Khartoum, Sudan; 2010. http://www.fao.org/fileadmin/templates/ess/ess_test_folder/Food_security/FS_reports/ Sudan_food_Insecurity.pdf.
- Sudan National S3M. Executive Summary: Simple Spatial Surveying Method (S3M) survey in Sudan. Khartoum, Sudan. Federal Ministry of Health; 2013. https://www.coverage-monitoring.org/wp-content/uploads/2014/12/Sudan_S3M-_2013_FINAL-Endorsed-EXECUTIVE-SUMMARY_25Nov2014.pdf.
- Food and Agricultural Organization (FAO). AQUASTAT Country Profile – Sudan. 2015. Rome, Italy. FAO. http://www.fao.org/3/i9808en/I9808EN.pdf
- Central Bureau of Statistics (CBS). Population projected by State-Khartoum State, Sudan; 2016. website: http://cbs.gov.sd/.
- A.M., Adil M.A. S. and Iman M. H. Review on Food Safety System With Reference To Meat Operations in Khartoum State, Sudan. RA Journal of Applied Research 2016; 2 (07); 491-504. http://www.rajournals.in/index.php/rajar/article/view/326/327
- United Nation International Children’s Emergency Fund (UNICEF). Population growth and rapid urbanization: Food insecurity on the rise in urban settings. Proceedings of the Joint Meeting of the Executive Boards of UNDP/UNFPA, UNICEF, and WFP. UNICEF ; 2009, New York. https://sites.unicef.org/about/execboard/files/B-8713E-JMB_Jan_09_-_population_growth.pdf.
- Zezza, A., and Tasciotti, L. Urban agriculture, poverty, and food security: Empirical evidence from a sample of developing countries. Food policy.2010; 35(4): 265-273. https://doi.org/10.1016/j.foodpol.2010.04.007
CrossRef - Diehl, J. A., Oviatt, K., Chandra, A. J., and Kaur, H. Household food consumption patterns and food security among low-income migrant urban farmers in Delhi, Jakarta, and Quito. Sustainability. 2019; 11(5):02-18. https://doi.org/10.3390/su11051378
CrossRef - Singh, D. R., Ghimire, S., Upadhayay, S. R., Singh, S., and Ghimire, U. Food insecurity and dietary diversity among lactating mothers in the urban municipality in the mountains of Nepal. PloS one. 2020; 15(1). https://doi.org/10.1371/journal.pone.0227873
CrossRef - Wang, Fahui, and Luo, Assessing Spatial and Non-spatial Factors for Healthcare access: Towards an Integrated Approach to Defining Health Professional Shortage Areas. Health and Place Journal. 2005; 11(2):131-46. https://doi.org/10.1016/j.healthplace.2004.02.003
CrossRef - Mwangi, D. M., John L. F., and Celeste S. Imputing Nutrient Intake from Foods Prepared and Consumed Away from Home and Other Composite Foods, Bangladesh: IFPRI; 2017. http://ebrary.ifpri.org/utils/getfile/collection/p15738coll2/id/131036/filename/131247.pdf.
- Stadlmayr, B., Charrondiere, U.R., Enujiugha, V.N., Bayili, R.G., Fagbohoun, E.G., Samb, B., Addy, P., Barikmo, I., Ouattara, F., Oshaug, O., Akinyele, I., Amponsah Annor, G., Bomfeh, K., Ene-Obong, H., Smith, I.F., Thiam, I., and Burlingame. B. West African Food Composition Table. 2012. Food and Agriculture Organization of the United Nations (FAO), Rome, (Italy). ISBN 978-92-5-007207-4. https://www.bioversityinternational.org/fileadmin/_ migrated/uploads/tx_news/West_African_ food_composition_table___ Table_de_composition_ des_aliments_d%E2%80%99Afrique_de_ l%E2%80%99Ouest_1522.pdf.
- Iyangbe C.O. and Orewa S. I. Determinants of daily protein intake among the rural and low-income urban Households in Nigeria. American-Eurasian Journals of Scientific Research.2009; 4(4):290-301 .http://www.idosi.org/aejsr/4(4)09/13.pdf
- Bishu Khanal, Kamal Banskota, and Dhiraj Giri. Comparative Analysis of Food Expenditure Pattern of Nepalese Households Using Engel Curves. Journal of Business and Social Sciences Research (JBSSR).2017; 2(1–2): 27-46. https://doi.org/10.3126/jbssr.v2i1-2.20956
CrossRef - Anwarul Huq A.S.M., and Arshad F.M. Demand Elasticities for Different Food Items in Bangladesh. Journal of Applied Sciences.2010;10 (20): 2369-2378. https://doi.org/10.3923/jas.2010.2369.2378
CrossRef - Hutchinson, E. Principles of Microeconomics. Victoria University of Victoria; 2017. https://pressbooks.bccampus.ca/uvicecon103/.
- Morgan, K. J. Socioeconomic Factors Affecting Dietary Status: An Appraisal. American Journal of Agricultural Economics.1968; 8(5): 1241-1246. https://doi.org/10.2307/1241884
CrossRef - Schwabe, C. Fact sheet poverty in South Africa. Pretoria: human science research council. 2004. https://sarpn.org/documents/d0000990/.
- Lafiandra D, Riccardi G, and Shewry Improving cereal grain carbohydrates for diet and health. J Cereal Sci. 2014; 59(3):312‐326. https://doi:10.1016/j.jcs.2014.01.001
CrossRef - FAO Methodology for the measurement of food deprivation – Updating the minimum dietary energy requirements. Rome: FAO; 2008. http://www.fao.org/ fileadmin/templates/ess/documents/food_security_statistics/ metadata/undernourishment_methodology.pdf.
- Imad E. Abdel Karim Yousif, Safar Hussein Al-Kahtani. Effects of high food prices on consumption pattern of Saudi consumers: A case study of Al Riyadh city. Journal of Saudi Society of Agricultural Sciences.2013;13 (2): 169-173. https://doi.org/10.1016/j.jssas.2013.05.003
- Humphries DL., Behrman JR., Crookston BT., Dearden KA., Schott W., and Penny ME. Households across All Income Quintiles, Especially the Poorest, Increased Animal Source Food Expenditures Substantially during Recent Peruvian Economic Growth. PLoS ONE.2014; 9 (11):1-13. https://doi.org/10.1371/journal.pone.0110961
CrossRef - Food insecurity assessment based on food consumption statistics derived from the 2002/03 Mozambique household budget survey. Maputo, Mozambique: FAO; 2008. http://www.fao.org/fileadmin/templates/ess/documents/food_security_statistics/food _insecurity_assessment_reports/FoodInsecurity AssessmentReport_Mozambique_2002-03.pdf .
- Food Insecurity Assessment based on food consumption statistics derived from Tajikistan 2005 Household Budget Survey. Dushanbe, Tajikistan: FAO; 2007. http://www.fao.org/3/ak520e/ak520e.pdf.
Accepted on: 23 Sep 2022
Second Review by: Zoobi Khanam India
Final Approval by: Dr. Neha Sanwalka


Web of Science Coverage
Emerging Sources Citation Index (ESCI)
2024 Journal Impact Factor: 1.1
Scopus Journal Metrics
CiteScore 2025: 2.6
CiteScore Details
Sustainable Nutrition: Food Systems, Nutrient Retention, and Public Health Impact
![]()
This journal is a member of, and subscribes to the principles of, the Committee on Publication Ethics (COPE)


