The Role of Pepsin in Improving the Quality of Surimi of Red Tilapia (Orechromis niloticus)
Nurhayati T1*
, , 2, 1Department of Aquatic Product Technology, Faculty of Fisheries and Marine Sciences, IPB University, Jl Agatis Kampus IPB Dramaga, Bogor, West Java, Indonesia.
2Center for Coastal and Marine Resources Studies (PKSPL), IPB University, Bogor, Indonesia.
Corresponding Author Email: nurhayati7870@yahoo.com
DOI : http://dx.doi.org/10.12944/CRNFSJ.10.2.15
Download this article as:
![]()
Pepsin is a proteolytic enzyme that is commonly used in the food industry. Pepsin can be extracted from the stomach of tuna fish. Tilapia has a high protein content. Thus, it can be used as an alternative for surimi paste raw materials. This study aimed to determine the concentration of pepsin enzyme from tuna stomachs that could improve the quality of red tilapia surimi paste. The concentrations of pepsin added to surimi were 0%, 2.5%, 5.0% and 7.5% (v/w). The effect of adding pepsin was examined by salt soluble protein, pH, chemical and physical characteristics, whiteness degree, and the sensory acceptances of the generated tilapia surimi. The results showed that the addition of pepsin to surimi paste significantly increased the strength of surimi gel, folding test, and salt-soluble protein. Surimi with the addition of 2.5% pepsin showed the most acceptable results compared to 0% pepsin with 77.99% moisture content, 14.88% protein content, pH 7.01, salt-soluble protein 0.833 mg/mL, gel strength 2,030.04 g/cm2, whiteness 88.3%. The sensory test of tilapia surimi with the addition of 2.5% pepsin revealed the appearance value of 7.80, the folding test of 5.57, and the bite test of 6.4.
KEYWORDS:Enzyme Concentration; Pepsin; Protein; Strength of Surimi Gel; Tuna Stomach
Introduction
Surimi is stabilized salt soluble protein concentrate made from deboned and washed fish meat. Industrially, fresh white flesh fishes, including threadfin bream, Pacific hake, and Alaska pollock, are widely utilized in the production of surimi-based products. Because the overexploitation affect the decrease of these stocks1 thus, requiring inexpensive raw materials from the freshwater fish can be used realistically by seafood manufacturers for more sustainable production of surimi. Currently, the use of freshwater fish can unravel the stock crises of the surimi industry, including tilapia, which has been successfully cultivated commercially.
Globally, tilapia has become the second-most-farmed fish after carp. Tilapia production has multiplied during the last few decades because of the ease of the farming system, low production cost, and good market demand2. Tilapia has thick flesh with a meat yield of up to 40%, and it has a protein content of up to 15.36%3. These characteristics allow ample room for the utilization of tilapia as an alternative source of surimi. Nevertheless, the weak gel-forming capacity and high pigment content of tilapia is a concern4. Myofibrillar content in surimi has an important functional requirement on the gel formation and sensory preference of surimi-based products. Hence, there is a demand to advance the textural properties of surimi generated from freshwater fish. Several strategies have been performed to enhance the grade of surimi from freshwater, such as increasing the washing cycle of surimi, adding starch, and increasing salt concentration. However, the last two options severely impair the flavour of their corresponding surimi gel. Moreover, raising the washing cycle will increase the water quantity and washing time in surimi production. The addition of a small amount of functional protein, peptide, or enzyme in surimi production is emerging to increase the quality of surimi without diminishing its sensory property.
To improve the textural properties of surimi gel, several food additives are used, for instance, pepsin. Pepsin is a proteolytic enzyme that can accelerate the hydrolysis of proteins into smaller amino acids and peptides under acidic conditions by splitting the peptide bonds between hydrophobic and aromatic proteins5. Pepsin which is commonly used in food, usually originates from pork or porcine pepsin. However, pork as a raw material for pepsin has caused the rejection of certain products in several communities and countries concerning health and religious issues. The raw material source of pepsin that can be used as a substitute for porcine pepsin is fish offal. The previous research has been explored maximizing marine products to generate pepsin, such as tuna stomach waste included as a raw material for protease sources6, tuna pepsin7, yellowfin tuna gastric tract pepsin8, 9, and pepsin catfish and milkfish10. Another source of pepsin raw material is tuna gastric tract, most of which can be obtained from tuna processing waste. Tuna stomach pepsin is an alternative that has the potential to replace porcine pepsin in the food sector; for example, surimi offers an alternative halal pepsin source.
The surimi gelation process occurs when the protein is unfolded into uncoiled polypeptide segments and then reacts at a certain point to form a three-dimensional cross-network. Unfolded protein folding can be influenced by heating factors and acid or alkaline treatment11. The protease enzyme is thought to play a role in the transformation of surimi proteins from folded into unbound polypeptides, and then surimi will fold again after going through the cooking stage. The tuna gastric enzyme is an economical marine resource to generate surimi. Nevertheless, it lacks information about the role of pepsin in the quality of surimi from freshwater fish. Herein, in this study, we examined further research to determine the right concentration of pepsin enzyme from tuna stomachs to improve the quality of red tilapia surimi paste.
Materials and Methods
Materials
The materials used in this study included the stomach of yellowfin tuna (Thunnus albacares), red tilapia (Oreochromis niloticus), trichloroacetic acid (TCA) (Ensure, for analysis), tris base (Sigma-Aldrich), hydrochloric acid (Merck., for analysis), natrium hydrogen carbonate (Merck, for analysis), bovine hemoglobin (Sigma), sorbitol, sucrose, coomassie brilliant blue (Merck), 95% ethanol (Merck), 85% orthophosphoric acid (Merck, for analysis), bovine serum albumin (Sigma), protein marker (Bio-Rad). The tools used in the research include analytical scales (Quattro), homogenizer (Nissei Am-Series), centrifuge (Beckman Coulter Model J2-21), pH meter (HANNA instruments), spectrophotometer (UV-Vis Genesys 10 Thermo), water bath shaker (18-one digital water bath), colour meter RGB-1002 (Lutron Electronic Enterprise), texture analyzer (Stable Micro System type TA-xt2i), and particle size analyzer (VASCO).
Methods
The research was carried out in two stages: 1) characterization and extraction of pepsin from yellowfin tuna stomach, 2) processing surimi pastes of red tilapia fish induced by the pepsin.
Chemical composition and gastric pepsin extraction of yellowfin tuna
The sample used was the stomach of yellowfin tuna (Thunnus albacares) obtained from Gorontalo, Indonesia. The hulls were shipped using Styrofoam containers added with ice to keep the stomach temperature low. Arriving at the laboratory, the stomach was stored in the freeze (-20°C). Tuna stomach preparation followed the previous method12, and the proximate of the tuna gastric was determined according to AOAC13. The extraction of gastric pepsin was conducted according to the method of Bougatef14. Tuna gastric pepsin was analyzed for their enzyme activity15, protein concentration16 and molecular weight17.
Processing and characterization of red tilapia surimi paste
The raw material used for processing surimi was red tilapia (Oreochromis niloticus) obtained from the Aquaculture Experimental Pond, Faculty of Fisheries and Marine Science, IPB University, Indonesia. The processing of red tilapia surimi paste refers to Indonesian National Standard of surimi SNI 2694: 201318. The surimi paste was made by with homogenizing red tilapia fillet. The fish meat was washed with cold water (1:4 (w/v)) to maintain the temperature at 0-5°C for 10 minutes. The washing step was done twice. The meat of the fish was squeezed using a calico cloth so that no water is dripping. The surimi paste was then separated from the remaining scales, fish tendons, and spines until a suitable meat was obtained. Lubricate the meat plus cryoprotectant in the form of 2% (v/w) sorbitol and 2% (w/w) sucrose and mixed until evenly distributed.
Surimi paste is added with crude extract of tuna stomach pepsin with concentrations of 0%, 2.5%, 5%, and 7.5% (v/w). Surimi paste was tested for moisture content, ash content, fat content, protein content13, pH19, White degrees were objectively assessed using the RGB-1002 whiteness meter19, and salt-soluble protein16. Surimi heating referred to the previous method20. Surimi paste was heated at 40°C for 90 minutes then heated again at 90°C for 30 minutes. The resulting kamaboko was then cooled for 10 minutes using ice water and then tested for gel strength21 and sensory analysis according SNI 2694: 201318. Surimi sensory consisted of 3 parts, namely appearance, fold test and bite test with a sensory value of minimal 718. The appearance test is carried out to assess the amount of fibers and surface appearance of the surimi. The folding test is carried out to assess cracks in the kamaboko. The bite test was carried out to assess the strength of the gelation in the form of elasticity in the kamaboko. The gel strength is evaluated by texture analysis, where gel strength is calculated based on the value of gel strength (g.force) to expand the probe used (cm2).
Data analysis
The data obtained were then tested for normality using the Shapori-Wilk test to determine whether the error distributes normally or not. The data is said to be distributed normally if the p-value is ≥ α (α = 0.05). Analysis of variance used to analyze and mean comparison was performed by Duncan`s multiple range tests22. All the data were represented as mean ± SD. Error bars in Figure results denote standard deviation with the mean of triplicate data.
Results
Crude Extract and Molecular Weight of Gastric Pepsin of Yellowfin Tuna
Crude pepsin extract of yellowfin tuna stomach had an activity value of 523.5 U/mL. The protein concentration of crude extract of pepsin obtained was 0.29 mg/mL. Spesific activity of the enzyme was 1,805.17 U/mg. The molecular weights of pepsinogen and crude extracts of tuna gastric pepsin were observed using sodium dodecyl sulphate polyacrylamide gel electrophoresis (SDS-PAGE). The results of the analysis of the molecular weight of pepsinogen and crude extract of pepsin were measured using markers with known molecular weight (20-150 kDa). The measurement results reveal that pepsinogen had a molecular weight of 35.64 kDa, while the crude extract of pepsin had a molecular weight of 31.84 kDa.
Chemical composition of red tilapia surimi
Analysis of the chemical content of surimi observed included moisture content, ash content, fat content, and protein content. The addition of pepsin shows no effects on the chemical composition of red tilapia surimi (p>0.05). The results of the chemical content analysis of surimi with the addition of different pepsin concentrations can be seen in Table 1. Table 1 shows that the moisture content of surimi is ~78% and protein content ~14%. As the pepsin concentration increased, there was no change in surimi’s moisture, ash, lipid, and protein content. Importantly, the overall parameter of the chemical composition of surimi red tilapia met the standard of commercial surimi.
Table 1: Chemical composition of surimi from red tilapia.
| Chemical composition (%) | Treatment | |||
| Pepsin 0% | Pepsin 2.5% | Pepsin 5% | Pepsin 7.5% | |
| Moisture | 78.60±0.17ab | 77.99±0.24a | 79.08±0.65b | 78.62±0.49ab |
| Ash | 0.34±0.05a | 0.28±0.02a | 0.28±0.04a | 0.22±0.01a |
| Lipid | 0.31±0.22a | 0.46±0.18a | 0.45±0.16a | 0.50±0.06a |
| Protein | 14.48±1.51a | 14.88±0.39a | 14.44±0.32a | 15.87±0.87a |
Superscript with different letters in the same row indicates significant difference (p <0.05).
pH value of red tilapia surimi
The pH value is an indicator used to measure the acidity level of a material. The pH value is an important factor because it is related to the speed of denaturation of myofibrils protein in a surimi-based product. The optimum pH value in producing surimi gel which is elastic and chewy is 6.5-7.5. The addition of pepsin can cause changes in the acidity level of red tilapia surimi. The results of the analysis of the pH value of surimi with the addition of different pepsin concentrations can be seen in Figure 1.
Figure 1 showed that the pH value of surimi decreases as the increasing concentration of pepsin is added (0, 2.5, 5, and 7.5%)—the tilapia surimi without adding pepsin exhibited normal pH (7.16±0.01) than other surimi with the inclusion of pepsin. The addition of 2.5% pepsin exhibited decreased pH value (7.01±0.01). The pH value of tilapia surimi with the addition of 5 and 7.5% showed a similar decreasing trend, where the pH of those surimi showed 6.65 and 6.50, respectively. After 7.5% of pepsin was included in surimi, the pH decreased by 9.12% compared to surimi with 0% pepsin. This finding indicates that the increase of 2.5% concentration on each level induced the decrease of pH of about ~0.1 per treatment.
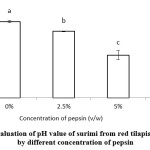 |
Figure 1: Evaluation of pH value of surimi from red tilapia induced by different concentration of pepsin. |
Different letters indicate a significant difference (p<0.05); The error bars denote the standard deviation (n = 3).
Salt soluble protein of surimi from red tilapia
Salt soluble protein or myofibril protein is an important factor in determining the gel-forming ability of fish meat. The addition of pepsin to surimi paste causes changes in the value of salt-soluble protein. The results of the analysis of salt soluble protein surimi with the addition of pepsin with different concentrations can be seen in Figure 2. The addition of pepsin had a significant effect on the salt soluble protein of surimi (p<0.05).
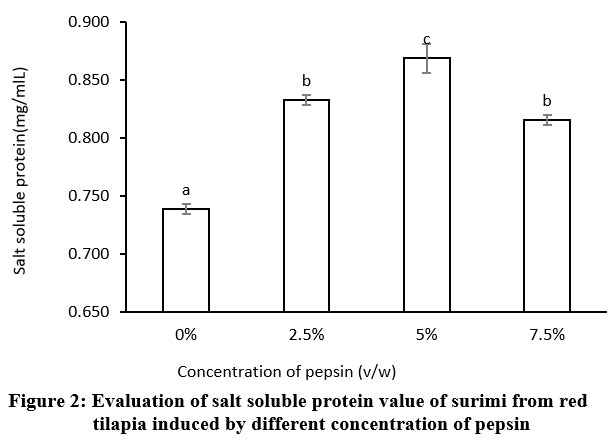 |
Figure 2: Evaluation of salt soluble protein value of surimi from red tilapia induced by different concentration of pepsin. |
Different letters indicate a significant difference (p<0.05); The error bars denote the standard deviation (n = 3).
The salt soluble protein or myofibril content showed a similar increasing trend as the concentration of pepsin increased from 0, 2.5, and 5%. Surimi with 0% of pepsin exhibited the lowest myofibril content (0.739 mg/mL) than that surimi with 2.5 and 5 % of pepsin (0.833-0.869 mg/mL). Conversely, the surimi with the 7.5% pepsin displayed a decrease in myofibril than the surimi with 5% pepsin. Additionally, the surimi with 7.5% showed no significant value with the surimi with 2.5% of pepsin. The decrease of salt soluble protein indicates that the highest concentration of pepsin could increase the cleavage of protein, thus making it denature to a small molecule of protein monomer.
Gel strength
The gel strength indicates the success of the gelation process in making surimi. Gel strength analysis was carried out on kamaboko tilapia. The results of the analysis of the strength of kamaboko gel with the addition of different pepsin concentrations can be seen in Figure 3.
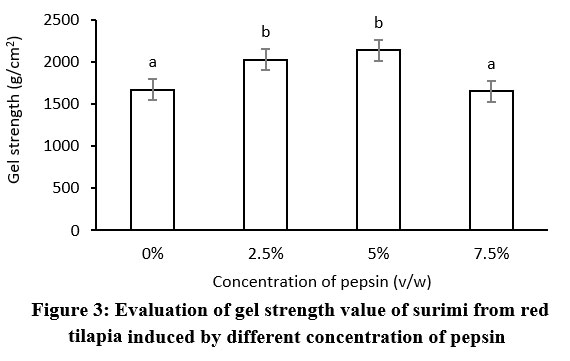 |
Figure 3: Evaluation of gel strength value of surimi from red tilapia induced by different concentration of pepsin. |
Different letters indicate a significant difference (p<0.05); The error bars denote the standard deviation (n = 3).
Gel strength is a critical factor in surimi. Technically, it was measured to evaluate the minimum standard of surimi-based products and predict the acceptance of consumer preferences. The gel strength of surimi shows an increasing trend as the concentration of pepsin increases, where the surimi with 0% of pepsin displayed the lowest gel strength (1761 g/cm2) compared to that surimi with 2.5% and 5% of pepsin (2030 – 2143 g/cm2). In contrast, the surimi with 7.5% pepsin showed a decreased gel strength compared to the 5% surimi gel strength. Interestingly, these results revealed a similar trend to the previous myofibril profile, where the highest concentration of pepsin shows an adverse effect on the gel strength surimi. Surprisingly, surimi with the addition of 2.5 and 5% of pepsin showed no significant difference (p<0.05), indicating the different myofibril content accomplishes not affect the gel strength of surimi, particularly between 2.5 and 5% of pepsin.
The whiteness of surimi from the red tilapia
The whiteness of the product indicates the loss of lipids, blood, and other pigments from the washing process. The good quality of surimi is characterized by its high gel strength and whiteness. The addition of pepsin affects the whiteness of the surimi. The results of the analysis of the white degree of surimi with the addition of different pepsin concentrations can be seen in Figure 4.
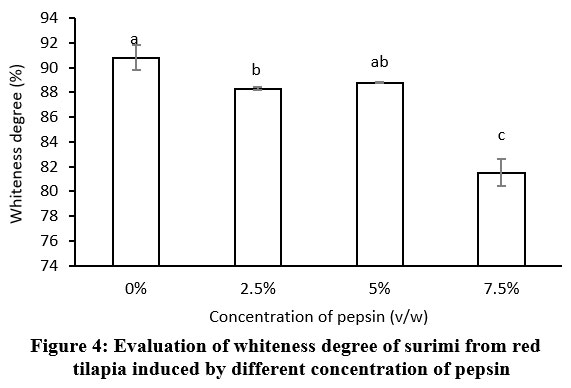 |
Figure 4: Evaluation of whiteness degree of surimi from red tilapia induced by different concentration of pepsin. |
Different letters indicate a significant difference (p<0.05); The error bars denote the standard deviation (n = 3).
The whiteness of the surimi is a significant indicator of the final surimi-based product. Figure 4 showed the decreasing trend of whiteness as the concentration of pepsin increases in the surimi. Surimi without pepsin (0%) showed the highest level of whiteness (90.8%), revealing the surimi from red tilapia have a high quality of generated product of surimi. In contrast, surimi with 2.5 and 5% pepsin exhibited a decreased level of whiteness of surimi. Surimi with 2.5 and 5% pepsin addition showed 88.3 and 88.8% whiteness degrees, respectively. Both concentrations revealed no significant whiteness degree of generated surimi. This finding indicates that 2.5 and 5% gave a similar response to the quality of surimi. Conversely, the addition of 7.5% pepsin displayed a significant decrease of whiteness degree to 81.5%.
Sensory of kamaboko from red tilapia surimi
The results of the sensory surimi test with the addition of different pepsin concentrations can be seen in Table 2. There is no significant effect on the overall appearance and the bite test result of surimi. The increase of sensory value is only revealed from the folding test, where the addition of 5% had a higher acceptance of sensory value than those other concentrations. The result is in line with the gel strength of surimi, which shows the highest gel strength with 5% pepsin, but there is no significant value of those parameters between 2.5 and 5% (p>0.05). Thus, the lowest concentration of pepsin (2.5%) shows a comparable result to the surimi with 5% pepsin.
Table 2: Sensory performance of surimi from red tilapia.
| Parameter | Treatment/ Sensory value* | |||
| Pepsin 0% | Pepsin 2.5% | Pepsin 5% | Pepsin 7.5% | |
| Appearance | 7.67±1.02a | 7.80±1.01a | 8.00±1.13a | 8.07±1.09a |
| Folding test | 5.07±1.53a | 5.57±1,38ab | 6.20±1.13b | 4.93±1.23a |
| Bite test | 6.13±1.46a | 6.47±1.38a | 6.60±1.61a | 6.00±1.36a |
*The range of sensory value = 1-9.
Superscript with different letters in the same row indicates significant difference (p <0.05).
Table 2 is currently showing the sensory characteristic induced by different concentrations of pepsin. Since pepsin is categorized as a food additive, only a small amount is required to significantly affect the sensory parameter. The sensory testing using a 9-point scale exhibited that the appearance of the surimi is similar (7-8). This finding first displays that the red tilapia surimi has a suitable mark property that meets the standard of commercial surimi. The overall visual appeal of surimi is categorized as ‘like moderately’ on the scale of 9 points sensory scale. The biting test exhibited ‘slightly strong’ test score categories due to the inclusion of pepsin. In contrast, the addition of 2.5 and 5% shows a significant folding test parameter value (p<0.05). The range of the folding test is ~6 indicates that no crack occurs of surimi if folded in two, but a crack occurs if folded in four. As the folding test is one of the most important functional and sensory properties of surimi, therefore 2.5% of pepsin is selected due to its gentle performance of the generated surimi.
Discussions
With the increase in global demand for the surimi-based product, a significant effort has been addressed to develop surimi ingredients, particularly to enhance the quality of surimi either from the nutritional aspect or from the physicochemical properties and sensory parameters. One emerging technology in the surimi industry is to insert a small amount of food additive to increase their quality. Instead of increasing the washing cycle of surimi or adding the additional flour, which will affect the economic consideration of the industry of surimi, the addition of enzymes shows a promising result in expanding the properties of surimi without dismissing the native properties of the product. Pepsin is one of the digestive protease enzymes that serve a beneficial function in the surimi industry. However, with the increase of sustainable issues in the world, the source of pepsin is argued, and many researchers are attempting to uncover a new source, especially from the unexplored marine resource.
Yellowfin tuna (Thunnus albacares) hull has more value as an alternative source of protease enzymes. Chemical composition of yellowfin tuna of gastric was moisture content 76.20±0.42%, ash 0.63±0.13 %, lipid 0.42±0.15%, and carbohydrate (by difference) 18.44±1.07%. Crude pepsin extract of yellowfin tuna stomach had an activity value of 523.5 U/mL. The pepsinogen of yellowfin tuna had a molecular weight of 35.64 kDa, while the crude extract of pepsin had a molecular weight of 31.84 kDa. Those characteristics show an excellent potency of protease enzymes from the gastric of Yellowfin Tuna, the results were similar with the previous report7, 23-26. The addition of pepsin in surimi production is thought to increase the quality value of surimi. Pepsin plays a role in protein denaturation in the surimi gelation process so that the unfolded protein becomes uncoiled and reacts at a certain point to form a strong three-dimensional cross-network11.
Firstly Table 1 revealed that the addition of pepsin had no effect on the chemical content of tilapia surimi (p>0.05). In fact, the initial testing of chemical content is beneficial to confirm that the small part of an enzyme as the food additives does not affect surimi’s chemical or nutritional value; instead, it will be expected only to affect the physical preference of surimi. This information is useful for the manufacturer and the regulatory policy for the following assessment of using this enzyme commercially in the surimi industry. Generally, the chemical content of tilapia surimi is in accordance with the Indonesia Standard of surimi (SNI 2694: 2013) which requires that the minimum surimi protein is 12% and the maximum moisture of surimi is 80%18.
Physical and chemical characteristics of red tilapia surimi were observed, consisting of pH value, salt soluble protein, gel strength, and whiteness degree, while the sensory test was carried out on kamaboko from surimi paste. Figure 1 shows that the pH value of surimi decreases with the increasing concentration of pepsin added. The decrease in pH value is due to the pepsin used having a pH of ±2.5. Jurado15 reported that the tuna gastric pepsinogen is activated using HCl up to a pH of 2.5 so that the resulting pepsin has a low pH. Myofibril protein is unstable at pH values below 6.527. Decreasing the pH value will affect the stability of the surimi protein. The pH value is an important factor because it is related to the speed of denaturation of myofibrils protein. Notably, the overall pH value of generated surimi with the obtainment of pepsin is still at the proper pH to produce the good mechanical properties of surimi (pH 6.5-7).
The obtainment of pepsin had a significant result on the salt soluble protein of surimi (p <0.05). Figure 2 shows that the addition of pepsin at a concentration of 2.5% and 5% causes an increase and a concentration of 7.5% causes a decrease in myofibril levels. This increase was since pepsin is a protease enzyme that acts as a biocatalyst in protein hydrolysis reactions. Purwaningsih28 stated that the protein content of tofu, which was hydrolyzed with the enzyme bromelain, was 50% greater than 30%. The addition of pepsin caused a decrease in salt-soluble protein content at a concentration of 7.50%. The decrease in myofibril levels correlated with the pH value. Shimizu29 stated that myofibril protein was less stable at acidic pH. This finding indicates that the high concentration of pepsin can force the over degrade of the protein to evolve smaller moieties of protein monomer.
Figure 3 indicated that the addition of pepsin had a significant effect on the gel strength value of kamaboko gel (p<0.05). The increase in the gel strength value at a concentration of 2.5% and 5% was due to the influence of pepsin in the surimi gelation process. Surimi gelation generally consists of two stages: the protein denaturation stage and the protein aggregation stage to form a three-dimensional network19. Pepsin has a role in helping the denaturation process in the early stages of gelation. Pepsin specifically cleaves the peptide bonds between hydrophobic and aromatic in proteins5. It has two aspartic acid residues as an active site (Asp 32 and Asp 215)30. The cutting of the peptide bonds causes the unfolded protein folds to become uncoiled.
The formation of a three-dimensional network occurs when surimi undergoes a heating process. Tilapia surimi heating is carried out in two stages. The first heating uses a temperature of 40°C for 90 minutes and the second heating uses a temperature of 90°C for 30 minutes. Heating with this temperature obtained the best gel strength value in red tilapia surimi (1,083.51 g.cm)20. The decrease in gel strength with the addition of 7.5% pepsin was thought to be due to the further denaturation of proteins to amino acids. Further denaturation causes an increase in the amount of hydrolyzed protein, thereby reducing the ability to form three-dimensional structures. The decrease in the value of gel strength at a concentration of 7.5% correlated with myofibril levels. Ramadhan and coworkers31 stated that catfish surimi had myofibril levels of 7.17% with a gel strength of 482.30 g/cm2, decreased to 4.74% with a gel strength of 208.00 g/cm2. The strength value of tilapia surimi gel with various treatments meets the standard of SNI 2694: 2013, which requires that the minimum gel strength value for surimi is 600 g/cm2. Red tilapia surimi has a gel strength value higher than 600 g/cm2; thus, it is classified as AA grade for tropical fish species (itoyori)32. Although the addition of pepsin 5 % showed a little bit higher gel value than that of surimi gel strength with 2.5%, however, statistically, the gel strength values were not significant; therefore, for the industrially use, the smaller percentage of 2.5% is favorable.
The inclusion of 2.5% and 7.5% pepsin had a significant effect on the whiteness of the surimi (Figure 4). The decrease in whiteness value was due to the added tuna stomach pepsin having a brownish color. Uju33 showed that the whiteness value of tilapia surimi decreased with the high concentration of carrageenan added. The decrease in the whiteness of tilapia surimi is due to the brownish color of carrageenan used. Latifa34 stated that the whiteness degree value of surimi is influenced by the addition of the materials used. Similar to using carrageenan, pepsin is also negatively affected in high concentrations, where obtaining 7.5% pepsin induced the whiteness by decreasing the value by around ~9% than surimi with 0% pepsin. Nevertheless, all surimi showed a range of whiteness degrees still exceeding 80%, which meets the standard of commercial surimi.
Lastly, Table 2 indicated that the addition of pepsin had no effect on the appearance of the surimi (p>0.05). Indicating the important results that the additional enzymes as a food additive had no longer altered the visual and appearance of the final surimi product. The results of the surimi folding test show a significant difference in the addition of 5% pepsin (p <0.05). The inclusion of pepsin can increase the value of the surimi fold test from 4.93 to 6.20. This result indicates the generated surimi experiences a slight crack when folded in half until it is close to a slight crack when folded in four18 or the grade ranges from B to close to A (Lee 1894). The surimi fold test value is related to the gel strength so that it affects the texture of the kamaboko. In contrast, the addition of pepsin had no effect on the surimi bite test (p>0.05). The obtained surimi that is close to the specific strength of the standard for commercial products ranges from 5-6 (Indonesian Fisheries Product Quality Control and Development Center 2001). In fact, the range of freshwater-based surimi invariably demonstrates a level of lower gel value than the commercial resources, for instance, surimi generated from Pacific whiting or Alaska pollock. Therefore, comprising a kind of starch enables the increase of the overall quality of the surimi seafood product that meets the level ‘A’ grade surimi.
Overall, the determination of the final quality of the surimi-based product can refer to the Codex standards based on their value of gel strength, whiteness, folding test, and biting test35. The results showed that the addition of pepsin at a concentration of 2.5% and 5% did not indicate a significant difference in those four parameters. The addition of yellowfin tuna stomach pepsin at a concentration of 2.5% in improving the surimi quality of red tilapia is an adequate treatment with due regard to economic aspects.
Conclusion
The addition of 2.5% pepsin showed the most reasonable results in tilapia surimi based on salt-soluble protein, gel strength, whiteness degree, and sensory for folding test. It is necessary to do further research on the evaluation of frozen storage of tilapia surimi and its utilization to generate the kind of surimi-based food products.
Acknowledgement
The authors gratefully acknowledge the Research Grant from the Indonesian Ministry of Higher Education and Technology.
Conflict of Interest
The author(s) declares no conflict of interest.
Funding Sources
The funding has been provided by the Research Grant from the Indonesian Ministry of Higher Education and Technology Postgraduate Grants 2019 (Assignment agreement Number: 3/E1/KP.PTNBH/2019) and College Leading Applied Research 2020 (Assignment Agreement Number: 1/E1/KP.PTNBH/2020 and Contract Amendment Number: 1/AMD/E1.KP.PTNBH/2020).
References
- FAO. The State of World Fisheries and Aquaculture 2020; Food and Agriculture Organization of the United Nations: Rome, Italy, 2020; pp. 1–206.
- Wang M. and Lu M. 2016. Tilapia polyculture: a global review. Aquac Res, 47: 2363-2374.
- Dewi EN, Ibrahim R. 2008. The Quality and Shelf-Life Dried Spiced Nile Tilapia Fillet Packed by House Scale Vacuum Sealer. Jurnal Saintek Perikanan. 4(1): 69-75.
- Priyadarshini B., Xavier M., Bhusan B. Nayak, Apang T., Balange A.K. 2018. Quality characteristics of tilapia surimi: Effect of single washing cycle and different washing media, Journal of Aquatic Food Product Technology. 27(5): 643-655.
CrossRef - Newton KC, Wraith J, Dickson KA. 2015. Digestive enzyme activities are higher in the shortfin mako shark, Isurus oxyrinchus, than in ectothermic sharks as a result of visceral endothermy. Fish Physiol Biochem. 41(4): 887-898.
CrossRef - Nalinanon S, Benjakul S, Visessanguan W, dan Kishimura H. 2009. Partitioning of preotease from stomach of albakor tuna (Thunnus alalunga) by aqueous two-phase systems. Process Biochem. 44 (4): 471-476.
CrossRef - Nalinanon S, Benjakul S, Kishimura H. 2010. Biochemical properties of pepsinogen and pepsin from the stomach of albakor tuna (Thunnus alalunga). Food Chem. 121(1): 49-55.
- Pasaribu E, Tati N, Nurilmala M. 2018. Extraction and Characterization of Pepsin Enzyme from Tuna (Thunnus albacares) Gastric. JPHPI. 21(3): 486-496.
CrossRef - Soleh MM, Ambarsari L, Nurcholis W, Nurhayati T. 2020. Characterization of ammonium sulphate fraction of pepsin from fish stomach. IOP Conf. Series: Earth and Environmental Science. 404-012039. IOP Publishing. doi:10.1088/1755-1315/404/1/012039.
CrossRef - Nurhayati T, Ambarsari L, Nurilmala M, Abdullah A, Rakhmawati IAI, Yuniasih. 2020. Pepsin activity from gastric of milkfish and catfish in Indonesian Waters. IOP Conf. Series: Earth and Environmental Science. 404. 012060. IOP Publishing. doi:10.1088/1755-1315/404/1/012060.
CrossRef - Zayas JF. 1997. Solubility of Proteins: Functionality of Protein in Food. Berlin (UK): Springer-Verlag.
- Wald M, Rehbein H, Beermann C, Bubmann B, Schwarz K. 2016. Purification and characterization of pepsinogen and pepsin from the stomach of rainbow trout (Oncorhynchus mykiss). Eur Food Res Technol. 242(11): 1925-1935
- [AOAC] Association of Official Analytical Chemyst. 2005. Official Method of Analysis of The Association of Official Analytical of Chemist. Arlington (US): The Association of Official Analytical Chemist, Inc.
- Bougatef A, Balti R, Zaeid SB, Souissi N, Nasri M. 2008. Pepsinogen and pepsin from the stomach of smooth hound (Mustelus mustelus): Purification, characterization, and amino acid terminal sequences. Food Chem. 107 (2): 777-784.
CrossRef - Jurado E, Vicaria JM, Lechuga M, Moya-Ramirez I. 2012. Pepsin extraction process from swine wastes. Procedia Eng. 42: 1346-1350.
- Bradford M.M. 1976. A rapid and sensitive method for the quantitation of microgram quantities of protein utilizing the principle of protein-dye binding. Anal Biochem. 72: 248-254.
- LaemmLi UK. 1970. Cleavage of structural proteins during the assembly of the head of bacteriophage T4. Nature. 227(10): 680-685.
- [BSN] National Standard Board. 2013. Indonesian National Standard SNI 2694.2013: Surimi. Jakarta (ID): National Standard Board
- Lanier TC, Carvajal P, Yongsawatdigul J. 2005. Surimi and Surimi Seafood, Second Edition, Chapter: Surimi Gelation Chemistry. Florida (US): CRC Press. 435-489.
- Mahawanich T. 2010. Preparation and properties of surimi gels from tilapia and red tilapia. NUJST. 16(2): 105-111.
- Liu J, Wang x, Ding Y. 2013. Optimization of adding konjac glucomannan to improve gel properties of low-quality surimi. Carbohydr Polym. 92(1): 484-489.
CrossRef - Walpole and Ronald E. 1968. Introduction of Statistic. New York (USA): McMillan.
- Jatmiko PD. 2018. Characteristics of Crude Pepsin Yellowfin Tuna (Thunnus albacares) [thesis]. Bogor (ID): IPB University.
- Klomklao S, Benjakul S. 2016. Utilization of tuna processing byproducts: protein hydrolysate from skipjack tuna (Katsuwonus pelamis) viscera. J Food Process Pres. 41(3): 1-8.
- Tanji M, Yekabe E, Kageyama T, Yokobori S, Ichinose M, Miki M, Ito H, Takahashi K. 2007. Purification and characterization od pepsinogen from the gastric mucosa of african coelacath (Latimeria chalumnae) and properties of major pepsins. Comp Biochem Physiol. 146(3): 412-420.
- Wu T, Sun L, Du C, Cai Q, Zhang Q, Su W, Cao M. 2009. Identification of pepsinogens and pepsins from the stomach of European eel (Anguilla anguilla). Food Chem. 115 (1): 137-142.
- Suvanich V, Jahnke ML, Marshall DL. 2000. Changes in selected chemical quality characteristics of channel catfish frame minced during chill and frozen storage. Food Chem and Toxicol. 65(1): 24-29.
- Purwaningsih I. 2017. Potensi enzim bromelin sari buah nanas (Ananas comosus I.) dalam meningkatkan kadar protein pada tahu. Jurnal Teknologi Laboratorium. 6(1): 39-46,
- Shimizu Y, Toyhara H, Lanier TC. 1992. Surimi production from fatty and dark fleshed fish spesies. Di dalam Lanier TC, Lee CM. Surimi Technology. New York (USA): Marcel Dekker Inc.
- Fruton JS. 2002. A history of pepsin and related enzymes. Q Rev Biol. 77(2): 127-147.
CrossRef - Ramadhan W, Santoso J, Trilaksani W. 2014. Effect of Defatting, Washing Cycle and Dryoprotectant Type on the Quality of Freeze Dried Catfish Surimi Powder. JTIP. 25(1): 47-56.
CrossRef - [CAC]. Codex Alimentarius Commission. 2009. Code of Practice for Fish and Fisheries Products: First Edition. Rome (IT): Food and Agriculture Organization/World Health Organization.
- Uju, Maryana F, Santoso J. 2007. Ulitilization of Refined Carrageenan as Cryoprotectant on Nila Frozen Surimi. Buletin teknologi Hasil Perikanan. 10(2): 48-59.
- Latifa BN, Darmanto YS, Riyadi PH. 2014. The Effect of Carrageenan, Egg White and Soy Protein Isolate Addition on Gel Forming Ability of Threadfin Bream (Nemipterus nematophorus) Surimi JPBHP. 3(40): 89-97.
- Park JW. 2013. Surimi and Surimi Seafood: third edition. Florida (US): CRC Press.
Accepted on: 26 Jun 2022
Second Review by: Rashmi Poojara India
Final Approval by: Dr Gabriel O. Adegoke


Web of Science Coverage
Emerging Sources Citation Index (ESCI)
2024 Journal Impact Factor: 1.1
Scopus Journal Metrics
CiteScore 2025: 2.6
CiteScore Details
Sustainable Nutrition: Food Systems, Nutrient Retention, and Public Health Impact
![]()
This journal is a member of, and subscribes to the principles of, the Committee on Publication Ethics (COPE)


