

Introduction
Wood apple (Limonia acidissima L.) is a tropical fruit plant native to India, Myanmar, and Sri Lanka that belongs to the Rutaceae family. It is cultivated throughout South Asia and is recognized by several names such as monkey apple, elephant apple, and kaitha1. Polyphenolics, phytosterols, flavonoids, saponin, tannins, coumarins, amino acids, vitamins, and minerals are all abundant in its fruit.2,3,4,5. Its fruit possessed pharmacological properties such as anti-diabetic, anti-tumour, antibacterial6, antimicrobial7, antioxidant and antimutagenic properties, that are used for treating diuretics, liver tonic, cardiotonic, stomachic, lunges problem, and gastrointestinal disorders8. Traditionally, its fruit pulp is consumed as raw, mature fruit pulp blended with cardamom, pepper, honey or cumin, and commercially its pulp is used as a major ingredient in jam, fruit bar, jelly9,10, wine, chutney11, and seeds used as flour for functional food formulation12.
The extraction of phenolic compounds using various solvents and their antioxidant capabilities from wood apple fruit pulp is the major focus of this study. Nowadays, food industries have preferred natural phytochemicals over synthetic and chemical ingredients due to the adverse effects of chemicals on human health. For obtained phytochemicals, extraction of these compounds from a complex plant matrix is the main process, thus, optimization of extraction conditions is important to provide maximum results of targeted compounds (total phenolic content and antioxidant activities)13,14. Many factors influence extraction processes, including extraction techniques, solvent type, solvent concentration, extraction duration, temperature, and solid-solvent ratio15. Extraction of phenolic compounds with various solvents is complicated because of release of bounded phenolic compounds which are strongly bound to the insoluble cell-matrix of plants. Various solvents such as ethanol, methanol, acetone and ethyl acetate are used for extraction due to different solubility, polarity and they were responsible for extracting particular compounds from cell-matrix. Polar phenolic compounds such as cinnamic or benzoic acid are not completely extracted with pure organic solvent thus, organic solvent conjugation with aqueous has been recommended for effective extraction16. As a result, optimizing the extraction conditions was necessary for optimal recovery of total phenolic content and antioxidant capacity. For this purpose, Response surface methodology and desirability analysis were applied to standardize and optimize extraction variables and factors. The advantages of RSM are to provide a low numbers of experimental runs that than can be easily handle, advance operating of data interpretation, interaction and correlation of variables3,17. Therefore, this research aimed to optimize the effect of extraction parameters such as solvent concentration, extraction duration and temperature on the yield, total phenolic content, and antioxidant activities of wood apple fruit powder using various solvents (ethanol, methanol, acetone and ethyl acetate).
Materials and Methods
Sample Preparation
The matured wood apple fruits were collected from the local market of Rewa city, Madhya Pradesh, India. The shell was broken using hummer manually and scooped the pulp was sieved over mesh to separate seed and fibrous part, which was freeze-dried (Lark, M-Penguin classic/ BANCHTOP, India) for 24 hrs at -65 oC/50 Mpa. Freeze-dried samples were grounded to obtain 40-mesh fine powder using analytical mill (IKA-A11 Basic, Germany).
2 gm of freeze powdered wood apple was extracted using solvent (methanol, ethanol, acetone and ethyl acetate) concentration (50-100%), temperature (30-60oC), and time (2-5 hrs) according to the experimental design obtained from response surface methodology (RSM) (Table 1). The extraction solution’s pH was then brought down to 2 using diluted HCl, and the process was carried out at 150 rpm in an orbital shaking incubator (REMI RIS 24 Plus Orbital Shaking Incubator, Maharashtra). The mixture was centrifuged (1500 rpm, 10 min) and filtered through whatman filter paper No. 1 and stored at -4oC till further analysis with some modifications3.
Extraction Yield
The extraction yield of dried extracts was calculated using the following equation18 on their dry weight basis:
Where W1 was the weight of extract after the evaporation of solvent and W2 was the weight of dry plant material. All the values were taken in triplicates with standard deviation (SD).
Determination of Phenolics Content
Total phenolic content (TPC) was determined by using Foline Ciocalteu method19. Briefly, 0.1 ml of the sample extract was mixed with 3 ml of distilled water. After adding 2 ml of 20 percent sodium carbonate, the Foline Ciocalteu reagent (0.5 ml) was added. After thorough mixing, incubated in boiling water bath for exactly 1 min and then it was cooled and absorbance was measured at 650 nm using UV-spectrophotometer (Thermo Scientific, GENESYS™ 10S UV-Vis, Germany) against the reagent blank. The result was expressed as mg GAE per gram sample dry weight. The data were presented on average ± SD for the triplicates.
Determination of Radical Scavenging DPPH Activity
The radical scavenging 2,2-diphenyl-1-picrylhydrazyl (DPPH) activity was determined according to the method by Brand-Williams20. Briefly, 1 ml of a 1mM methanolic solution of DPPH was added to 3 ml of sample extract. The solution was mixed vigorously and left undisturbed for 30 min at room temperature in the dark. The data were presented on average ± SD for the triplicates. The absorbance was measured at 517 nm by UV-spectrophotometry and scavenging activity was expressed using the equation:
UHPLC Analysis
The extract of phenolics and separation of compound was analyzed using ultra high performance liquid chromatography (UHPLC) with wavelength of 280, 320 and 370 nm. Operating conditions: UPLC BEH C18 column (2.1 mm x 100 mm, 1.8µm, Waters India Pvt. Ltd., Bengaluru) was utilized including mobile phase A was a mixture of water and methanol (in a ratio of 10:90, v/v), and mobile phase B was made by the mix of methanol and water (in a ratio of 90:10, v/v) with 0.1% formic acid in both mobile phases, followed by 15 min degassing at 21 oC for both phases. The injection volume of the sample was to be 5 µl and the flow rate of 10 µl per minute21. The identification and peak assignment of phenolic compounds was based on the retention time and spectral data with those of standards, further identification was quantified based on standard calibration curves.
Experimental Design
Response surface methodology (RSM) with central composite design (CCD) was adopted in present study for the finest arrangement of variables selected for extrication of phenolic compounds from wood apple. The Design Expert 11.0 software was applied to minimize the experiment or run in the best technique. In this study, solvent concentration % (X1), extraction temperature oC (X2), extraction time hr (X3) were select as independent factors and dependent factors were yield of extraction, TPC, and DPPH activity (Table 1) with various solvent solutions such as ethanol, methanol, acetone and ethyl acetate. Following the execution of experiments, data were fitted using the following second-order polynomial equation in accordance with response surface analysis.
Y = β0 + β1 A+ β2B + β3C +β12AB + β13AC + β23BC + β11AA + β22BB + β33CC
Where, Y is the predicted responses (yield, TPC, DPPH), βo is model constant, β1, β2 and β3 are model linear and quadratic coefficients, β12, β13, β23, β11,22,33 are interaction coefficients and A, B and C are coded values of independent variables.
Table 1: Central composite design with independent variables and their actual values
| Std. | Run | Factor A | Factor B | Factor C |
| % | oC | hr | ||
| 1 | 7 | -1 | -1 | -1 |
| 2 | 10 | 1 | -1 | -1 |
| 3 | 17 | -1 | 1 | -1 |
| 4 | 8 | 1 | 1 | -1 |
| 5 | 5 | -1 | -1 | 1 |
| 6 | 3 | 1 | -1 | 1 |
| 7 | 14 | -1 | 1 | 1 |
| 8 | 11 | 1 | 1 | 1 |
| 9 | 13 | -1 | 0 | 0 |
| 10 | 12 | 1 | 0 | 0 |
| 11 | 1 | 0 | -1 | 0 |
| 12 | 9 | 0 | 1 | 0 |
| 13 | 6 | 0 | 0 | -1 |
| 14 | 15 | 0 | 0 | 1 |
| 15 | 19 | 0 | 0 | 0 |
| 16 | 20 | 0 | 0 | 0 |
| 17 | 2 | 0 | 0 | 0 |
| 18 | 18 | 0 | 0 | 0 |
| 19 | 4 | 0 | 0 | 0 |
| 20 | 16 | 0 | 0 | 0 |
| Actual values | ||||
| -1 | 50 | 30 | 2 | |
| 0 | 75 | 45 | 3.5 | |
| +1 | 100 | 60 | 5 |
Where, Std. = Standard run, A = Solvent Concentration, B = Temperature, C= Time.
Data Analysis and Model Validation
Using Design-expert software (version 11.0), the data were analyzed and responses were predicted. All the experiments were completed in triplicates and statistical analysis of data was allowed to fitted toward significant and non-significant were removed to obtain the reduced model. Model was predicated on the regression analysis (R2) and ANOVA analysis (p<0.05). Based on the regression analysis and response surface plots, the extraction conditions for yield, total phenolic content, and antioxidant activity were numerically optimized for the maximum. In order to validate the model, the experimental and predicted values were furthermore compared.
Results and Discussion
Fitting the Response Surface Model
The experimental values of response variables were used in response surface analysis to fit the second-order polynomial equations. It was observed that there was no significant difference between the experimental and predicted values of the response variables, shows a positive model. Through analysis of the coefficients of regression (R2), adjusted R2, probability value, and lack-of-fit value (Table 3), which demonstrate the model’s suitability and accuracy in responding to predicted variation, the fitness of the second-order polynomial model was evaluated. On this basis, the model was significantly confirmed at 0.001% level of probability concerning R2 and adjusted R2 of >90%.
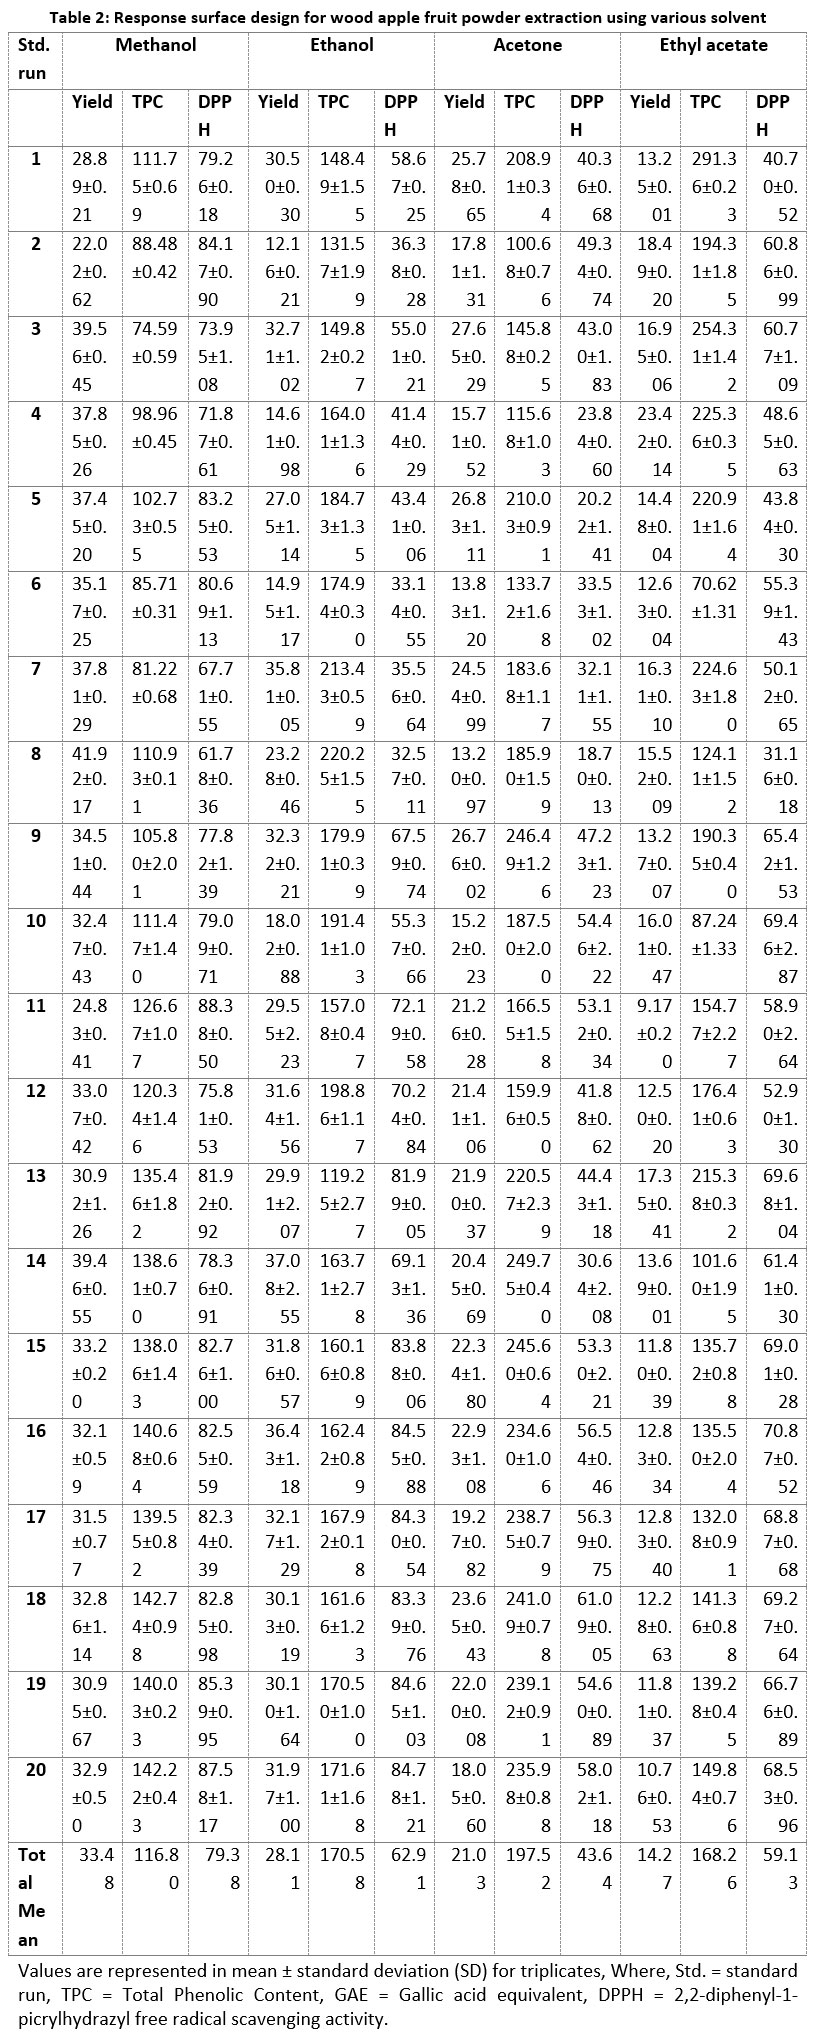 |
Table 2: Response surface design for wood apple fruit powder extraction using various solvent. |
Table 3: Quadratic model in terms of coded variables for wood apple fruit powder extraction
| Regression coefficient | Second order polynomial equation | R2 | R2 (adjusted) | Lack of fit | |
| Methanol | Yield | 31.917-0.901X1+4.19B+3.27C +1.45AB+1.31AC-2.47BC+ 1.90AA-2.54BB+3.64CC |
0.9596 | 0.9233 | 0.1564 |
| TPC | 139.29+1.92A-2.95B+1.05C+ 11.88AB+1.48AC+3.66BC -29.96AA-14.39BB-0.944CC |
0.9912 | 0.9833 | 0.1295 | |
| DPPH | 83.56-0.54A-6.46B-2.03C- 1.28AB-1.38AC-2.06BC -4.72AA-1.07BB-2.62CC |
0.9266 | 0.8606 | 0.6391 | |
| Ethanol | Yield | 32.26-7.53A+2.38B+1.81C -0.02AB-1.47AC-1.55BC -7.33AA-1.91BB+0.91CC |
0.9280 | 0.8633 | 0.2673 |
| TPC | 165.79-0.02A+14.81B+24.18C +6.09AB-0.09AC+4.90BC +19.37AA+12.42BB-24.31CC |
0.9668 | 0.9369 | 0.1891 | |
| DPPH | 83.91-6.13A-0.89B-5.97C+ 2.00AB+2.82AC-1.22BC -21.94AA-12.21BB-7.86CC |
0.9976 | 0.9854 | 0.2140 | |
| Acetone | Yield | 21.06-5.67A-0.4B-1.1C | 0.8366 | 0.8060 | 0.9450 |
| TPC | 235.30-26.65A-2.68B+17.38+ 19.44AB+8.16AC+9.35BC -12.57AA-67.31BB-4.33CC |
0.9908 | 0.9826 | 0.1012 | |
| DPPH | 54.86-0.60A-3.45B-6.58C -6.85AB+1.6AC+2.49BC -1.37AA-4.96BB-16.18CC |
0.9451 | 0.8958 | 0.1358 | |
| Ethyl acetate | Yield | 12.07+1.18A+1.67B-1.68C +0.28AB-1.79AC-0.48BC +2.42AA-1.38BB+3.30CC |
0.8723 | 0.8474 | 0.8801 |
| TPC | 136.34-47A+7.28B-43.58C+ 15.29AB-15.29AC+7.58BC+ 5.78AA+32.32BB+25.22CC |
0.9849 | 0.9713 | 0.8093 | |
| DPPH | 69.20+0.46A-1.61B-3.87C -7.84AB-193AC-3.22BC -2.2AA-13.78BB-4.13CC |
0.9739 | 0.9504 | 0.0523 |
Where, TPC = Total Phenolic Content, DPPH = 2,2-diphenyl-1-picrylhydrazyl free radical scavenging activity, R2 = Coefficients of Regression.
Effect of Extraction Conditions Yield
In this study, the effect of various solvents for efficient extraction yield of phenolic content and DPPH activity from wood apple was investigated. The yield of extract is majorly influenced by various factors such as type and solvent concentration, their boiling point, the particle size of sample, temperature and time of extraction process16. The extract yield was optimized using methanol, ethanol, acetone and ethyl acetate solvent shown in table 2. The yield of various solvent extracts from wood apple ranged from 9.17±0.20 (ethyl acetate extract) to 41.92±0.17 (methanol extract). The outcome reveals that adopting a different solvent significantly altered the extraction yield. Methanol recorded the maximum yield (33.48%) among the different solvents, followed by ethanol (28.11%), acetone (21.03%), and ethyl acetate (14.27%). Different solvent shows different extraction yield because of the polarity difference of solvent and also time-temperature combination during the extraction process. Methanolic and ethanolic extracts showed higher extraction yields than acetone and ethyl acetate extracts, results indicate that the polarity of the solvent influences yield. Results depicted that at a higher temperature (<45oC) for a long-time extraction (above 3 hr) with methanol solvent resulted in higher extractability, due to higher polarity of methanolic extract or ethanolic extract which favour enhancing the yield with high temperature. The result of ANOVA indicated that a combination of water and solvent increases the extraction yield as compared to a concentrated solvent. The solvent concentration from 50-75% shows maximum yield and beyond 80% solvent concentration extraction yield trends found downstream. The Isatis tinctoria extraction yield was greatly affected by solvent polarity which is mainly increased by an increase in polarity index22. Solvents with high polarity form more bonds through plant matrix and result increase in yield of extraction therefore for extraction type of solvent and polarity were important13,23,24. The extraction also depends on temperature and time parameters. The results depicted that mass transfer is initially lesser at a lower temperature (near 30-40oC), with acceleration in temperature increasing the diffusion and extraction yields. Indeed, it was observed that yield or mass transfer into the solvent improved by increasing in temperature from 45-60oC and maximum found at 60oC. A positive significant effect was shown in methanol extraction (Fig 1a), in the case of acetone, linear or negative interaction between solvent and temperature was found (Fig1c). The same behaviour was observed by other researcher, for efficient yield from pomegranate peel extract showing that extraction was temperature dependent, at higher temperature solubility and diffusion of compounds was increased25. Similarly, mass transfer increases with time, and more solubilization or partition of outer surface promotes mass transfer diffusibility hence increased yield. The yield was improved by increasing extraction time duration from 2 hr to 5 hr, for higher time of extraction with high temperature shows a negative quadratic effect26,27,28,29. Table 3, indicated that the value of R2 of methanolic extract has found higher (0.9596) followed by ethanolic (0.9280), ethyl acetate (0.8723) and acetone extract (0.8366). This result depicted that methanolic extraction supports maximum yield as compared to other solvents used for extraction.
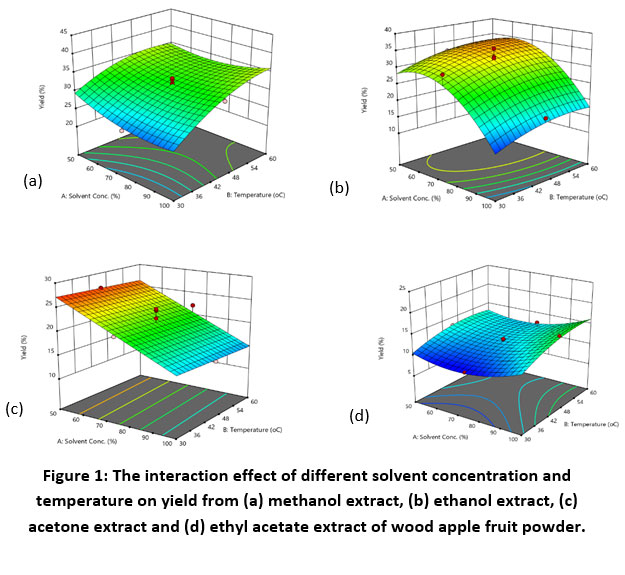 |
Figure 1: The interaction effect of different solvent concentration and temperature on yield from (a) methanol extract, (b) ethanol extract. |
Effect of Extraction Conditions on TPC
Phenolic compounds found in broad-spectrum and extraction are critical due to complex chemical structures or functional groups. Thus, the selection of solvents, their polarity and concentration of solvent is quite crucial for efficient extraction and, they have a significant effect on the rate of extraction of phenolic compounds15,17,30. The ANOVA data shows in table 2, that various solvents had a significant impact on the phenolic extract from wood apple fruit pulp. The TPC of the various solvent extracts varied significantly, with acetone extract having the highest TPC (197.52 mg GAE/g), followed by ethanolic (170.58 mg GAE/g), ethyl acetate (168.26 mg GAE/g), and methanolic extract (116.80 mg GAE/g) in terms of total mean. Table 2 indicated that concentrated solvent extract exhibited a lower value of TPC than aqua-solvent extract, due to polarity of extracting solvent being responsible for phenolic extraction. The range of TPC value for methanolic extract (74.59±0.59 – 142.74±0.98 mg GAE/g), ethanolic extract (119.25±2.77 – 220.25±1.55 mg GAE/g), acetone extract (100.68±0.76 – 249.75±0.40 mg GAE/g) and ethyl acetate extract (70.62±1.31 – 291.36±0.23 mg GAE/g). Based on the results of multiple regression analysis, we selected the most suitable mathematical model for experimental data obtained. The second-order polynomial equation (p < 0.05) for total phenolic content and DPPH activity in dry matter extract is represented in Table 3. From Table 3 it was confirmed that the values of the regression coefficient, adjusted coefficient of determination (adj.-R2), and results of lack of fit were the adapted range for TPC of wood apple fruit pulp extract. The effect of solvent concentration and temperature have a significant impact on TPC, an increase in temperature during extraction exhibits more effect on the extractability of phenolic compounds. High temperature enhanced cell wall solubility and release of bounded phenolic compounds during extraction16,30. 3D response surface plot at intermediate level of solvent concentration, temperature and time, and interaction between different variables as depicted in Figs 1,2,3a-d. Additionally, higher temperature leads to expansion of the pores of the fruit powder matrix thus solvent could easily diffuse into pores which helps in easy wrenching out of the phenolic compounds13. For all solvents, higher TPC values were reported at a temperature of 54 oC, and as the temperature was increased further, TPC subsequently declined. This happened due to the induced thermal effect that decreases thermal sensitive compounds of phenols. In relative aspects to other solvents, the mean value of acetone extract has a greater solvation energy, which may be because more hydrogen bonds are being formed between the polar groups of polyphenolic molecules.31. The results stated that extraction duration has no significant effect on the phenolic content extraction. It was observed that an increase in time led to slight increase in phenolic content. During the extraction practices, the cumulative effect of temperature and time has a negative influence on the phenolic extract; in particular, at the temperatures above 60 oC for 5 hrs extraction process attributes degradation of phenolic compounds32. This happens due to higher temperatures for a long-time frail the cell walls and greatly disintegrate or oxidize the phenols33.
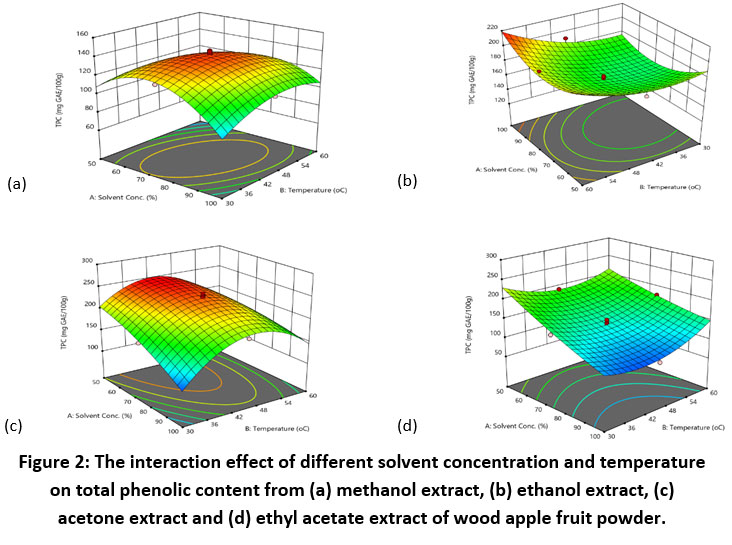 |
Figure 2: The interaction effect of different solvent concentration and temperature on total phenolic content from (a) methanol extract, (b) ethanol extract. |
Effect of Extraction on DPPH Activity
Antioxidant activity has numerous health benefits by scavenging the free radicals and restricting oxidative chain reactions that may otherwise cause cell proliferation, ageing of cells, production of cancer cells and other chronic diseases34. DPPH activities of extracts were found to be significantly correlated to the type and concentration of solvent and temperature of extraction25,33. Results of the current study depicted that DPPH activity for methanolic extract has been found to have higher values than other solvent extracts. Range of DPPH activity for methanolic extract (61.78±0.36 – 88.38±0.50), ethanolic extract (32.57±0.11 – 84.78±1.21), acetone extract (18.70±0.13 – 61.09±0.05) and ethyl acetate (31.16±0.18 – 70.87±0.52). Table 3, depicted that all solvents were positively correlated with each other. DPPH activity is mostly associated with the ability of the targeted compounds to donate hydrogen and scavenge proton radicals. The current study showed that a solvent concentration above 75% leads lower value of DPPH activity. Similarly, a study shows that the antioxidant activity increased to 80% methanolic concentration and a further increase in solvent concentration resulted in declined activity due to low solubility and weak polarity behavior of pure solvent30. Another major influencing factor on DPPH activity was temperature, it was observed in table 2 that, with the rise in temperature particularly above the 50 oC, there was a decrease in radical scavenging activity. The interactive effect of solvent and temperature demonstrated by the response surface plot has a synergetic action, it depicting the increasing of antioxidant activity initially and declining thereafter32. The quadratic model has shown that antioxidant activity was positively correlated with solvent concentration and extraction temperature (Table 2). Higher temperature (above 50oC) exposure for an extended time (more than 3.5 hr) will increase the extraction speed but degrade and oxidase the extracted cell tissues35,36.
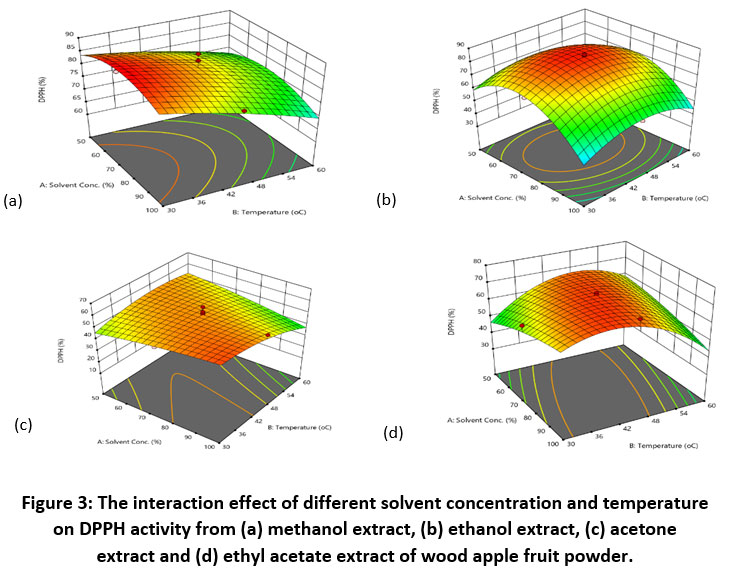 |
Figure 3: The interaction effect of different solvent concentration and temperature on DPPH activity from (a) methanol extract, (b) ethanol extract. |
Optimization of Responses
The solvent extraction conditions were optimized using the Design-Expert version 11, for wood apple fruit powder for higher yield, TPC and DPPH activity. The optimized conditions obtained for methanolic solvent extraction were 72.99 % solvent concentration, 39.56oC temperature and 4.9 hr time giving predicated values of yield 37.90%, TPC 137.14 mg GAE/g and 81.94% of DPPH activity; corresponds to these value experimental values were 38.14% yield, 135.78 mg GAE/g TPC and 80.85% DPPH activity (Fig 1). For ethanolic solvent extraction, 67.72% solvent concentration, 55.81oC temperature and 3.9 hr time with 35.46% yield, 189.63 mg GAE/g TPC and 73.21% DPPH activity of predicted value; and its experimental values were 36.01% yield, 188. 58 mg GAE/g TPC and 72.93% DPPH activity (Fig 2). Optimized conditions of acetone were 50.00% solvent concentration, 43.48oC temperature and 3.06 hr time; showing 27.10% yield, 248.89 mg GAE/g TPC and 54.68% DPPH activity of predicated values and its experimental values were 27.98% yield, 250.74 mg GAE/g TPC and 59.34% DPPH activity (Fig 3). For ethyl acetate extract optimized conditions were 99.99% solvent concentration, 49.50oC temperature and 2.00 hr time, its predicted values were 23.06% yield, 185.70 mg GAE/g TPC and 65.99% DPPH activity; and its experimental values were 24.97% yield, 183.57 mg GAE/g TPC and 65.04% DPPH activity.
The value of desirability for methanolic extract was 0.814, ethanolic extract 0.775, acetone extract 0.929 and ethyl acetate was 0.760. The range value of desirability lies between 0 to 1, where a value toward 0 indicated undesirable responses while toward 1 reflected those responses were completely favourable30. At the higher temperature for longer time extraction, values for phenol and antioxidant gradually increase in the beginning, thereafter declines along with higher temperature above the 55oC and longer time of more than 3.5 hr; because this will result in oxidation and degradation of phenolic and antioxidant content.
UHPLC Quantification of Individual Phenolic Compounds Present in Optimized Wood Apple Fruit Extract
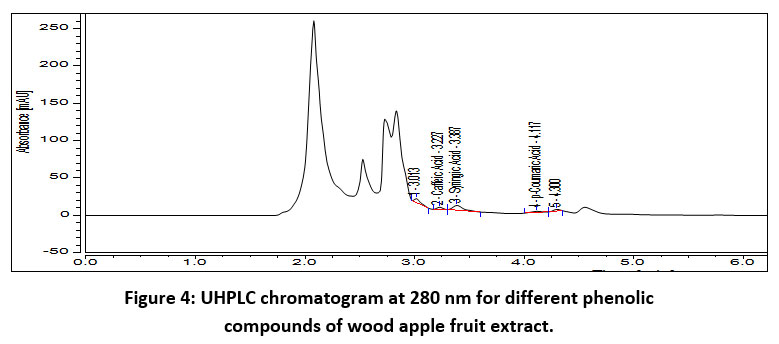 |
Figure 4: UHPLC chromatogram at 280 nm for different phenolic compounds of wood apple fruit extract. |
It was observed from the optimization condition that acetone extract contains higher values for phenolics, therefore acetone optimized extract was submitted to UHPLC for quantification of individual phenolic compounds present in wood apple Fig 4, present the UHPLC chromatogram of the optimized extract for different phenolic compounds. Gallic acid, caffeic acid, syringic acid, vanillic acid, p-coumaric acid, and chlorogenic acid were the phenolic naturally occurring substances presented in the extract. The retention time and concentrations of particular phenolic compounds in fruit extract was presented in table 4. According to obtained results, the highest level of the phenolic compound was caffeic acid (12.81 mg/g fruit extract), followed by syringic acid (4.56 mg/g fruit extract), gallic acid (2.21 mg/g fruit extract), vanillic acid (1.78 mg/g fruit extract), and p-coumaric acid (1.31 mg/g fruit extract)21.
Table 4: Phenolic profile of optimized wood apple fruit extract using UHPLC method
| Compound name | Wavelength (nm) | Retention time (min) | Area (mAU*min) | Concentration (mg/g) |
| Gallic acid | 280 | 2.367 | 1.04 | 2.21 |
| Caffeic acid | 280 | 3.137 | 5.32 | 12.81 |
| Syringic Acid | 280 | 3.387 | 2.70 | 4.56 |
| Vanillic acid | 280 | 4.027 | 6.70 | 1.78 |
| p-Coumaric Acid | 280 | 4.117 | 4.36 | 1.31 |
| Chlorogenic acid | 280 | 4.263 | 8.50 | n.a |
n.a – not available.
Correlation Between Solvent and Other Variables
The result was calculated by summarizing the effect of solvent on yield, TPC and DPPH. Table 5, depicted the correlation between solvents (methanol. ethanol, acetone and ethyl acetate) of yield, TPC and DPPH were performed with a Person’s correlation test. A positive correlation between methanol, ethanol and acetone was observed with a correlation coefficient. In terms of yield, ethanol and acetone were shown to have a highly significant positive correlation (r=0.663, p<0.01) Methanol and acetone have a substantial correlation in the TPC (r=0.748, p<0.01), whereas acetone and ethyl acetate have a considerable positive correlation in the DPPH (r=0.832, p<0.01). There was a negative significant correlation among methanol, ethanol and acetone in yield, methanol, ethyl acetate and acetone in TPC. Solvents have a significant effect on the yield, TPC and DPPH during extraction.
Table 5: Correlation values of Yield, total phenol content (TPC) and DPPH activity.
| Yield | Methanol | Ethanol | Acetone | Ethyl acetate |
| Methanol | 1 | |||
| Ethanol | 0.184655 | 1 | ||
| Acetone | -0.01439 | 0.663697** | 1 | |
| Ethyl acetate | 0.257056* | -0.51708 | -0.20596 | 1 |
| TPC | Methanol | Ethanol | Acetone | Ethyl acetate |
| Methanol | 1 | |||
| Ethanol | -0.1863 | 1 | ||
| Acetone | 0.748794** | 0.30106 | 1 | |
| Ethyl acetate | -0.40372 | -0.27743 | -0.22038 | 1 |
| DPPH activity | Methanol | Ethanol | Acetone | Ethyl acetate |
| Methanol | 1 | |||
| Ethanol | 0.600875* | 1 | ||
| Acetone | 0.671773** | 0.749653** | 1 | |
| Ethyl acetate | 0.637189* | 0.72562** | 0.832871** | 1 |
** Significant correlation with p<0.01, * Significant correlation with p<0.05.
Conclusion
The study concludes that surface response is an effective method to optimize the extraction condition for wood apple fruit powder. The solvent extraction results demonstrate that all independent variables had a significant (p<0.05) effect on all responses. The value of R2 for yield, TPC, and DPPH activity were 0.9596, 0.9912 and 0.9266 for methanolic extract; 0.9280, 0.9668 and 0.9976 for ethanolic extract; 0.8366, 0.9908 and 0.9451 for acetone extract; 0.8723, 0.9849 and 0.9739 for ethyl acetate extraction respectively. The quadratic polynomial model was accurate for analyzing the interaction between all the parameters. The chromatography shows the presence of magnificent phenolic compounds in wood apple fruit which are responsible for antioxidant activity. The overall study suggested that the wood apple fruit extract can be used in food processing industries like beverages or bakery industry and utilize for fortification or supplement in loss nutritional food products as well as in therapeutic treatment, and pharma industries. These bioactive compounds impart various health benefits and help in curing multiple diseases.
Acknowledgement
The author is also grateful to the Guru Jambheshwar University Science and technology, Govt. Institute for help in providing a place their research and chemical work.
Conflict of Interest
The authors declare that they have no known competing financial interests or personal relationships that could have appeared to influence the work reported in this paper.
Funding Sources
The author has no funding and financial support to achieve the aim of this research paper.
References
- Morton, J.F. Wood-apple. In: Fruits of warm climates. 1987. Flare Books, Miami, FL, 190–191. https://hort.purdue.edu/newcrop/morton/wood-apple.html
- Kerkar, S.P., Patil, S., Dabade, S.S.A., Sonawane, S.K. Limonia acidissima: Versatile and Nutritional Fruit of India. J. Fruit Sci., 2020; 1-9. https://doi.org/10.1080/15538362.2020.1737302
CrossRef - Ilaiyaraja, N., Likhith, K.R., Babu, G.S., Khanum, F. Optimisation of extraction of bioactive compounds from Feronia limonia (wood apple) fruit using response surface methodology (RSM). Food Chem., 2015;173, 348-354. https://doi.org/10.1016/j.foodchem.2014.10.035
CrossRef - Darsini, D.T.P., Maheshu, V., Vishnupriya, M., Nishaa, S., Sasikumar, J.M. Antioxidant potential and amino acid analysis of underutilized tropical fruit Limonia acidissima L. Free Radic. Antioxid., 2013; 3, 62-69. https://doi.org/10.1016/j.fra.2013.08.001
CrossRef - Mahour K., Mishra A., Kumar A., Vihan V.S. Preliminary pharmacognostical and phytochemical investigation on Feronia elephantum fruit. J. Pharm. Res., 2008; 1(1): 44-47. https://citeseerx.ist.psu.edu/viewdoc/download?doi=10.1.1.736.5576&rep=rep1&type=pdf
- Pandey, S., Satpathy, G., Gupta, R.K. Evaluation of nutritional, phytochemical, antioxidant and antibacterial activity of exotic fruit” Limonia acidissima“. Pharmacogn. Phytochem., 2014; 3(2).
CrossRef - Neelamadhab, P., Patro, V.J., Jena, B.K., Panda, P. K. Evaluation of phytochemical and anti-microbial activity of ethanolic extract of Limonia acidissima L. Int. J. Herb. Med., 2013; 1(1): 22-27. https://www.florajournal.com/archives/?year=2013&vol=1&issue=1&part=A&ArticleId=5
- Phapale, R., Thakur, S.M. Antioxidant activity and antimutagenic effect of phenolic compounds in Feronia limonia (L) swingle fruit. J. Pharm. Pharm. Sci., 2010; 2(4):68-73. https://hero.epa.gov/hero/index.cfm/reference/details/reference_id/8627163
- Kumar, A., Deen, B. Studies on preparation and preservation of squash from wood apple (Limonia acidissima L.) fruits. J. Chem. Stud., 2018; 6(1): 1513-1516. https://www.chemijournal.com/archives/?year=2018&vol=6&issue=1&ArticleId=1802
- Kumar, A., Deen, B. Studies on preparation and storage of jelly from wood apple (Limonia acidissima) fruits. J.Pharm.Phytochem., 2017; 6 (6): 224-229. https://www.phytojournal.com/archives?year=2017&vol=6&issue=6&ArticleId=2082
- Singhania, N., Kajla, P., Barmanray, A., Bishnoi, S. Development and storage studies of wood apple (Limonia acidissima) chutney. J. Chem. Stud., 2020; 8(1): 2473-2476. https://www.chemijournal.com/archives/?year=2020&vol=8&issue=1&ArticleId=8639&si=false
CrossRef - Sonawane, S.K., Bagul, M.B., LeBlanc, J.G., Arya, S.S. Nutritional, functional, thermal and structural characteristics of Citrullus lanatus and Limonia acidissima seed flours. Food Meas. Charact., 2016; 10(1): 72-79. https://doi.org/10.1007/s11694-015-9278-8
CrossRef - Putnik, P., Lorenzo, J.M., Barba, F.J., Roohinejad, S., Režek Jambrak, A., Granato, D., Montesano, D., Bursać Kovačević, D. Novel food processing and extraction technologies of high-added value compounds from plant materials. Foods, 2018; 7(7): 106. https://doi.org/10.3390/foods7070106
CrossRef - Liyana-Pathirana, C., Shahidi, F. Optimization of extraction of phenolic compounds from wheat using response surface methodology. Food Chem., 2005; 93(1): 47-56. https://doi.org/10.1016/j.foodchem.2004.08.050
CrossRef - Alberti, A., Zielinski, A.A.F., Zardo, D.M., Demiate, I.M., Nogueira, A., Mafra, L.I. Optimization of the extraction of phenolic compounds from apples using response surface methodology. Food Chem., 2014; 149: 151-158. https://doi.org/10.1016/j.foodchem.2013.10.086
CrossRef - Stalikas, C. D. Extraction, separation, and detection methods for phenolic acids and flavonoids. Sep. Sci., 2007; 30(18): 3268-3295. https://doi.org/10.1002/jssc.200700261
CrossRef - Prasad, K.N., Hassan, F.A., Yang, B., Kong, K.W., Ramanan, R.N., Azlan, A., Ismail, A. Response surface optimisation for the extraction of phenolic compounds and antioxidant capacities of underutilised Mangifera pajang Kosterm. peels. Food Chem., 2011; 128(4): 1121-1127. https://doi.org/10.1016/j.foodchem.2011.03.105
CrossRef - Barbouchi, M., Elamrani, K., El Idrissi, M., Choukrad, M. A comparative study on phytochemical screening, quantification of phenolic contents and antioxidant properties of different solvent extracts from various parts of Pistacia lentiscus L. King Saud Univ. Sci., 2020; 32 (1): 302-306. https://doi.org/10.1016/j.jksus.2018.05.010
CrossRef - Singleton, V.L., Orthofer, R., Lamuela-Raventós, R.M. Analysis of total phenols and other oxidation substrates and antioxidants by means of folin-ciocalteu reagent. Enzymol., 1999; 152–178. https://doi.org/10.1016/S0076-6879(99)99017-1
CrossRef - Brand-Williams, W., Cuvelier, M.E., Berset, C. Use of a free radical method to evaluate antioxidant activity. LWT – Food Sci. Technol., 1995; 28(1): 25–30. https://doi.org/10.1016/S0023-6438(95)80008-5
CrossRef - Chen, Z., Zhong, B., Barrow, C., Dunshea, F., Suleria, H. Identification of phenolic compounds in Australian grown dragon fruits by LC-ESI-QTOF-MS/MS and determination of their antioxidant potential. J. Chem., 2021;14(6): 103151. https://doi.org/10.1016/j.arabjc.2021.103151
CrossRef - Wakeel, A., Jan, S.A., Ullah, I., Shinwari, Z.K., Xu, M. Solvent polarity mediates phytochemical yield and antioxidant capacity of Isatis tinctoria. PeerJ, 2019; 7: e7857. https://doi.org/10.7717/peerj.7857
CrossRef - Do, Q.D., Angkawijaya, A.E., Tran-Nguyen, P.L., Huynh, L. H., Soetaredjo, F.E., Ismadji, S., Ju, Y.H. Effect of extraction solvent on total phenol content, total flavonoid content, and antioxidant activity of Limnophila aromatica. Food Drug Anal., 2014; 22 (3): 296-302. https://doi.org/10.1016/j.jfda.2013.11.001
CrossRef - Nayak, P.K., Rayaguru, K., Radha Krishnan, K. Quality comparison of elephant apple juices after high‐pressure processing and thermal treatment. Sci.Food Agric., 2017; 97(5): 1404-1411. https://doi.org/10.1002/jsfa.7878
CrossRef - Kaderides, K., Papaoikonomou, L., Serafim, M., Goula, A.M. Microwave-assisted extraction of phenolics from pomegranate peels: Optimization, kinetics, and comparison with ultrasounds extraction. Eng. Process., 2019; 137: 1-11. https://doi.org/10.1016/j.cep.2019.01.006
CrossRef - Liu, Y., Wei, S., Liao, M. Optimization of ultrasonic extraction of phenolic compounds from Euryale ferox seed shells using response surface methodology. Crops Prod., 2013; 49: 837-843. https://doi.org/10.1016/j.indcrop.2013.07.023
CrossRef - Muhamad, N., Muhmed, S.A., Yusoff, M.M., Gimbun, J. Influence of solvent polarity and conditions on extraction of antioxidant, flavonoids and phenolic content from Averrhoa bilimbi. Food Sci. Eng., 2014; 4: 255-260. https://doi.org/10.17265/2159-5828/2014.05.006
- Meziant, L., Benchikh, Y., Louaileche, H. Deployment of response surface methodology to optimize recovery of dark fresh fig (Ficus carica , var. Azenjar) total phenolic compounds and antioxidant activity. Food Chem., 2014; 162: 277-282. https://doi.org/10.1016/j.foodchem.2014.04.054
CrossRef - Alara, O.R., Abdurahman, N.H., Olalere, O.A. Optimization of microwave-assisted extraction of flavonoids and antioxidants from Vernonia amygdalina leaf using response surface methodology. Food Bioprod. Process., 2018; 107: 36-48. https://doi.org/10.1016/j.fbp.2017.10.007
CrossRef - Ismandari, T., Kumalaningsih, S., Wijana, S., Mustaniroh, S.A.U. Optimization of Bioactive Compound Extraction from Rose Myrtle Fruit (Rhodomyrtus tomentosa, (W. Ait), Myrtaceae) as the Antioxidant Source. World J., 2020. https://doi.org/10.1155/2020/9105847
CrossRef - Sood, A., Gupta, M. Extraction process optimization for bioactive compounds in pomegranate peel. Food Biosci., 2015; 100-106. https://doi.org/10.1016/j.fbio.2015.09.004
CrossRef - Karami, Z., Emam-Djomeh, Z., Mirzaee, H.A., Khomeiri, M., Mahoonak, A.S., Aydani, E. Optimization of microwave assisted extraction (MAE) and soxhlet extraction of phenolic compound from licorice root. Food Sci. Technol., 2015; 52(6): 3242-3253. https://doi.org/10.1007/s13197-014-1384-9
CrossRef - Dai, J., Mumper, R.J. Plant phenolics: extraction, analysis and their antioxidant and anticancer properties. Molecules, 2010; 15(10): 7313-7352. https://doi.org/10.3390/molecules15107313
CrossRef - Chhikara, N., Kushwaha, K., Sharma, P., Gat, Y., Panghal, A. Bioactive compounds of beetroot and utilization in food processing industry: A critical review. Food Chem., 2019; 272: 192-200. https://doi.org/10.1016/j.foodchem.2018.08.022
CrossRef - Patil, S.P., Kalkar, S.A., Kulkarni, A.S. Phytochemical screening, antibacterial and antioxidant activity of Limonia acidissima (L.). Bionano frontier, 2012; 5(2): 131-133. https://www.scitepress.org/Papers/2019/91260/91260.pdf
- Mundaragi, A., Thangadurai, D. Process optimization, physicochemical characterization and antioxidant potential of novel wine from an underutilized fruit Carissa spinarum L. (Apocynaceae). Food Sci.Technol., 2018; 38(3): 428-433. https://doi.org/10.1590/1678-457X.06417
CrossRef

This work is licensed under a Creative Commons Attribution 4.0 International License.