

Introduction
Malnutrition refers to under-nutrition and it happened when important nutrients required for tissue maintenance and repair are not consumed or utilized properly, severely affecting physical health and body functions.1 The retirement age of 65 years to denote an older adult is commonly used. The aging phenomenon is widespread throughout the world, and the aging population continues to grow with time. Between 2015 and 2030, the population is expected to increase by 56%, from 901 million to 1.4 billion, and by 2050, the population will have more than doubled, potentially reaching 2.1 billion.2 Though the number of elderly people in Palestine will rise in the next years, it will remain relatively low, with only 5.0 percent of the population over the next ten years.3 As the world’s population ages, it’s more important than ever to pay attention to issues that affect this group. The elderly’s health, independence, and quality of life are all dependent on their nutritional health.4 Hospitalized elderly patients frequently suffer from malnutrition, and it’s becoming more common all around the world. Unfortunately, malnutrition affects between 11% and 45% of elderly people brought to an acute medical service,5 also, health professionals are frequently ignorant of which of the admitted patients are nutritionally vulnerable, and they make no attempt to avoid additional nutritional deterioration until a major worsening has developed.6 As a result of malnutrition, a patient’s hospital stay could be prolonged, resulting in additional costs for the patient and society.7,8
Despite the difficulties in determining the prevalence of malnutrition, it is estimated that at least one out of every three elderly patients admitted to hospitals in developed countries suffers from malnutrition.9,10 It’s also estimated that 25.9% of patients who are not malnourished at the time of admission may become malnourished throughout their hospital stay.11 In order to delay or prevent the negative consequences of malnutrition, early detection, and nutritional intervention are essential.12
Assessing nutritional status is the first step in the nutritional treatment process since it gives the information needed to diagnose under- or over-nutrition and the underlying cause.13 Nutritional assessment is commonly done with the aid of a nutrition assessment tool, and malnourished individuals detected by the tool are more likely to have various complications and stay in the hospital for longer periods of time.14 Dietitians and medical professionals employ nutritional assessment tools to diagnose malnutrition that should be thoroughly validated to match the population to which they are applied.13
The use of different assessment tools to assess patients’ conditions is highly recommended. However, a gold standard for assessing malnutrition among the elderly does not yet exist, and the use of various tools and indicators might be behind the wide range in the prevalence rate of malnutrition.16 There are a lot of nutritional assessment tools applied to assess the nutritional status of hospitalized elderly patients. It is worth mentioning that any nutritional assessment tool should be valid, sensitive, and specific for the purpose-designed to. This study used the Subjective Global Assessment (SGA), the Mini Nutritional Assessment (MNA), and the Geriatric Nutrition Risk Index (GNRI) as nutritional assessment tools. SGA, MNA, and the GNRI are major nutritional assessment tools for diagnosing malnutrition among hospitalized patients. SGA is considered one of the acceptable validating nutritional assessment tools in hospitals, but it lacks the sensitivity to detect short-term improvements in nutritional status, for example.17 The MNA is designed to provide primary care health professionals with a single tool to efficiently identify elderly patients at nutritional risk who may subsequently need a more extensive nutritional assessment. Though MNA is a valid assessment tool for diagnosing malnutrition among the elderly, its specificity is still questionable.18 The GNRI is a specialized tool in identifying and predicting nutrition-related disorders and complications, rather than diagnosing malnutrition among the elderly.19 No or limited studies were conducted to identify the nutritional status of hospitalized elders. No previous studies had been done to compare the applicability of different nutritional assessment tools in diagnosing malnutrition among hospitalized elderly patients in the Gaza Strip, Palestine. The aim of this study was to assess the prevalence of malnutrition among hospitalized elderly patients and to assess the validity of the GNRI and MNA among elderly hospitalized patients against the SGA.
Methods and materials
Study Design and Subjects
This analytical cross-sectional study involved 150 elderly hospitalized patients, aged 65 years and older who were recruited from main governmental hospitals in the Gaza Strip, Palestine. The patients were selected from both surgical and medical departments using a non-probability purposive sampling method. Elderly patients who were under palliative and intensive care treatment, under nutritional support, had undergone surgery 3 days or less from the day of assessment, had fluid retention, were infected with SARS-COV-2, and were not fit to complete the study protocol were excluded from the study. All participants signed a written informed consent form. This study obtained approval from the local Helsinki Committee (PHRC/HC/721/20).
Nutritional assessment and validation of GNRI and MNA against SGA
Nutritional assessment was performed using three different nutritional assessment tools (SGA, MNA, and GNRI).
SGA categorized the enrolled patients as well-nourished (SGA-A), moderately malnourished (SGA-B), or severely malnourished (SGA-C) based on their nutrition status. MNA consists of 18 self-reported questions based on general, anthropometric, dietary intake, and self-assessment data. The maximum score for this part is equal to 30. Malnutrition is indicated by a score below 17, risk of malnutrition is indicated by a score of 17–23.5, and good nourishment is indicated by a score above 23.5.20 GNRI was calculated using the following formula: GNRI = [1.489 * Albumin (g/L)] + [41.7 * (weight/WLo)]. WLo equals the ideal body weight, and it was calculated from the Lorentz equations. Malnutrition is indicated by a score below 92, risk of malnutrition is indicated by a score of 92–98, and not malnourished is indicated by a score above 98.
Positive predictive value (PPV), negative predictive value (NPV), sensitivity, and specificity were determined to verify the validity of the tools. For each tool, the nutritional status was categorized into either ‘malnourished’ or ‘not malnourished’ (dichotomous variable). Regarding the SGA, patients with SGA-A were classified as well-nourished, while participants with SGA-B & SGA-C were classified as malnourished. Whereas, GNRI score < 92 was classified as malnourished. Malnourished patients were identified as those who had MNA scores < 17.21
Anthropometric and Biochemical Measurements
Height, body weight, BMI, mid upper arm circumference (MAC), and skinfold thickness (SFT) were obtained from all patients. Lean tissue or muscle in the body was measured by measuring the arm muscle area (AMA). This is based on the finding that when an organism is starved of nutrients, it taps into its nutritional reserves, which include adipose tissue, visceral protein, and skeletal protein. A triceps skinfold thickness is used to measure fat storage in the upper arm, while arm muscle size is utilized to measure muscular protein reserves.22 This is because the change in AMA is greater than the change in MAC as the size of the arm muscle varies in response to growth, development, and nutrition status. As a result, changes in upper-arm musculature cannot be recognized as easily by measuring MAC as they can by measuring AMA. Therefore, AMA is the favored nutritional index.22 The following revised equations were constructed by Heymsfield and his coauthors to partially adjust for the overestimation of AMA by subtracting a constant that accounted for the presence of bone and nerve and vascular tissues in the upper arm.23 Corrected AMA (cAMA) equations for men and women were respectively: [(MAC – pi x TSF)2/4 pi] – 10, and [MAC – pi x TSF)2/4 pi] – 6.5. The information about medical diagnoses and dietary intake was taken from patients’ files and from patients themselves. Hemoglobin, albumin, total protein, and lymphocytes % were measured in all participants.
Statistical Analysis
SPSS version 24.0 was used to analyze the data. The quantitative data was given as percentages (%) and means with standard deviations. To differentiate between the nutritional assessment tools groups, an independent sample t-test was performed. To verify the validity of the tools using SGA, their sensitivity, specificity, PPV, and NPV were obtained. The sensitivity of the GNRI and MNA were plotted against the corresponding false-positive rate (1-specificity) at every possible cut-off score to create receiver operating characteristic (ROC) curves. The overall indicator of the GNRI and MNA diagnostic accuracy is shown by the area under the curve (AUC).24 The Youden Index identifies the optimum cut-off point with the optimum sensitivity and specificity using the following formula: Youden Index = sensitivity + specificity – 1. The cut-off point with the highest Youden index was chosen as the new recommended cut-off point of both tools.25 The level of significance was set at less than 0.05.
Results
Out of the 150 elderly patients involved in this study. In addition, no missing data were found for any of the important variables. The general characteristics of respondents are shown in Table 1. As you can see in Table 1, respondents have a wide range of traits. The mean age of the responders was 71.73 years, the ages ranging from 65 to 89 years. The numbers of male and female patients were relatively equal 49.3 and 50.7% respectively. The majority of respondents (74.7%) were recruited from medical departments. Almost, all recruited patients were suffering from one or more chronic conditions, for example, diabetes, hypertension, coronary artery diseases, chronic kidney diseases, etc.). In addition, 27.3%, 48.7%, and 44.0% of all patients experienced a change in taste, decrease in appetite, and decline in food intake in the past 3 months before hospitalization, respectively.
Table 1: Characteristics of All Respondents.
| Variables | Total | |
| n (%) | Mean(SD) | |
| Gender | ||
| Male | 74 (49.3%) | |
| Female | 76 (50.7%) | |
| Age | 71.7 (7.126) | |
| Department | ||
| Medical | 112 (74.7%) | |
| Surgical | 38 (35.3%) | |
| Number of Consumed Drugs | 4.11 (2.373) | |
| Taste Change | ||
| Yes | 41(27.3 %) | |
| No | 109(72.7%) | |
| Ability to Masticate Food | ||
| Yes | 143(95.3%) | |
| No | 7(4.7%) | |
| Change in Food Smell | ||
| Yes | 26(17.3%) | |
| No | 124(82.7%) | |
| Swallowing Difficulties | ||
| Yes | 6(4.0%) | |
| No | 144(96.0%) | |
| Appetite Change | ||
| Normal | 67(44.7%) | |
| Decrease | 73(48.7%) | |
| Increased | 3(2.0%) | |
| Changeable | 7(4.7%) | |
| Food Intake Decline Over the Past 3 Months | ||
| Severe decrease in food intake | 8(5.3%) | |
| Moderate decrease in food intake | 58(38.7%) | |
| No decrease in food intake | 84(56.0%) | |
Table 2: Categorization of Respondents Using Different Nutritional Assessment Tools.
| Variables | Total | |
| n (%) | Mean(SD) | |
| SGA Score | 8.68 (4.673) | |
| SGA Category | ||
| SGA-A | 71 (47.3%) | |
| SGA-B | 75 (50.0%) | |
| SGA-C | 4 (2.7%) | |
| MNA Score | 21.77 (3.889) | |
| MNA Category | ||
| MNA –A | 53 (35.3%) | |
| MNA –B | 66 (44.0%) | |
| MNA –C | 31 (20.7%) | |
| GNRI Score | 116.38 (16.128) | |
| GNRI Category | ||
| GNRI –A | 132 (88.0%) | |
| GNRI –B | 12 (8.0%) | |
| GNRI –C | 6 (4.0%) | |
| A- Not Malnourished, B- Moderate Malnourished for SGA and at risk of malnutrition in MNA and GNRI and C- Sever Malnourished | ||
Table 2 shows the prevalence of malnutrition in all patients. The prevalence of malnutrition varied concerning different assessment tools. The percentages of malnourished patients were 52.7%, 20.7%, and 4.0% based on SGA, MNA, and GNRI, respectively. The mean score of SGA, MNA, and GNRI was 8.68, 21.77, and 116.38, respectively. When nutritional status was categorized as dichotomous variables for all of the tools (Table 3), the GNRI (4.0%), as well as the MNA (20.7%) identified fewer malnourished patients than the SGA (52.7%).
Table 3: Prevalence of Malnourished Hospitalized Elderly Patients According to Nutritional Status as a Binary Variable.
| Variables | Total | |
| N | (%) | |
| SGA | ||
| Not Malnutrition | 71 | (47.3%) |
| Malnutrition | 79 | (52.7%) |
| MNA | ||
| Not Malnutrition | 119 | (79.3%) |
| Malnutrition | 31 | (20.7%) |
| GNRI | ||
| Not Malnutrition | 144 | (96.0%) |
| Malnutrition | 6 | (4.0%) |
Table 4 presented the anthropometric and biochemical measurements of all respondents. The mean BMI was 30.37 (kg/m2). About half of respondents were classified as obese, while 22.0% of patients had normal body weight. The score of CC, MAC, cAMA, and SFT was 36.22, 31.19, 67.04, and 19.26, respectively. The mean level of serum albumin was 3.97 g/dL, and 15.3% of respondents had albumin levels less than the reference range. The mean hemoglobin level was 11.65 g/dL, and 49 out of 150 had hemoglobin levels below normal value.
Table 4: Anthropometric and Biochemical Measurements of All Respondents.
| Variables | Total | |
| n (%) | Mean(SD) | |
| Height | 1.63 (0.102) | |
| Weight | 80.39 (18.311) | |
| BMI (kg/m2) | 30.37 (6.867) | |
| Underweight | 5 (3.3%) | |
| Normal weight | 33 (22.0%) | |
| Overweight | 35 (23.3%) | |
| Obese | 77 (51.3%) | |
| CC | 36.22 (5.144) | |
| Less than 31 cm | 22 (17.7%) | |
| More than 31 cm | 128 (85.3%) | |
| MAC | 31.19(4.430) | |
| cAMA | 67.04(21.833) | |
| SFT | 19.26(8.686) | |
| Total Protein | 6.76 (0.783) | |
| Albumin | 3.97 (0.521) | |
| Normal | 127(84.7%) | |
| Below Normal | 23(15.3%) | |
| Hemoglobin | 11.65 (2.009) | |
| Normal | 96(64.0%) | |
| Below Normal | 49(32.7%) | |
| Above Normal | 5 (3.3%) | |
| Lymphocytes % | 22.28 (10.544) | |
Table 5 indicated that there are significant differences in all anthropometric measurements between SGA, MNA, and GNRI groups. Concerning mean differences, the cAMA in the malnutrition group in all nutritional assessment tools (SGA, MNA, and GNRI) were less than the non-malnutrition group by about 13.4, 10.6, and 27.8, respectively. In addition, hemoglobin level in the malnutrition group in SGA and MNA was statistically significantly less than in the non-malnutrition group, but not in GNRI.
Table 5: Comparison of Anthropometric and Biochemical Measurements between Nutritional Assessment Groups.
| Variables | SGA | MNA | GNRI | |||
| Not Malnourished | Malnutrition | Not Malnourished | Malnutrition | Not Malnourished | Malnutrition | |
| Mean (SD) | Mean (SD) | Mean (SD) | Mean (SD) | Mean (SD) | Mean (SD) | |
| BMI | 33.0 (6.438) | 28.0 (6.397)* | 31.0 (6.294) | 27.9 (8.396)* | 30.7 (6.740) | 21.5 (2.953)* |
| CC | 38.0 (4.810) | 34.6 (4.910)* | 36.9 (4.362) | 33.7 (6.960)* | 36.5 (5.046) | 29.9 (3.262)* |
| MAC | 32.7 (3.930) | 29.8 (4.438)* | 31.7 (4.070) | 29.4 (5.289)* | 31.4 (4.415) | 26.9 (2.083)* |
| cAMA | 74.1 (20.092) | 60.7 (21.481)* | 69.3 (20.015) | 58.4 (26.376)* | 68.2 (21.433) | 40.4 (13.284)* |
| SFT | 21.9 (8.525) | 16.9 (8.168)* | 20.1 (8.615) | 16.1 (8.334)* | 19.7 (8.589) | 9.2 (3.311)* |
| Total Protein | 6.9 (0.801) | 6.7 (0.755) | 6.8 (0.783) | 6.7 (0.789) | 6.8 (0.774) | 6.2 (0.836)* |
| Albumin | 4.1 (0.503) | 3.9 (0.522)* | 3.9 (0.511) | 3.9 (0.566) | 4.0 (0.495) | 3.2 (0.512)* |
| Hemoglobin | 12.1 (1.674) | 11.3 (1.205)* | 11.8 (1.901) | 10.8 (2.228)* | 11.7 (1.972) | 10.5 (2.731) |
| Lymphocyte% | 23.3 (10.248) | 21.4 (10.782) | 22.2 (10.596) | 22.4 (10.513) | 22.6 (10.667) | 15.6 (2.073) |
| Independent t-test was applied to analyses between the groups. The level of significance is < 0.05.*= Significant Differences between the Groups | ||||||
Table 6 shows that the GNRI has lower sensitivity and NPV when compared with MNA. Additionally, the AUC values shown by both the MNA (AUC = 0.860; CI = 0.798 to 0.922) and GNRI (AUC = 0.711; CI = 0.630 to 0.793) implied that both tools have a good diagnostic value in determining malnourished patients. The results show that both malnutrition diagnostic tools have good discriminative power in identifying malnourished elderly patients compared with the criterion SGA.
Table 6: Sensitivity, Specificity, PPV, NPV and AUC of the MNA and GNRI Compared with the SGA.
| Tool | Sensitivity | Specificity | PPV | NPV | AUC (95% CI) |
| MNA | 0.354 | 0.957 | 0.903 | 0.571 | 0.860*** |
| GNRI | 0.075 | 1 | 1 | 0.493 | 0.711*** |
| *** = P value less than 0.001 | |||||
The low sensitivity and high AUC values of both nutritional assessment tools (MNA and GNRI) at the original cutoff points of 18 and 92 suggested a revision of the cutoff points for the diagnosis of malnutrition among the Palestinian elderly population. Thus, the optimal cutoff points for the MNA and GNRI in identifying malnutrition (Table 7 and Table 8) were established at 21.75 and 108.919, with a maximum Youden index value of 0.635 and 0.336, respectively. Figure 1 shows the ROC plots of the GNRI and MNA against the SGA.
Table 7: Sensitivity, Specificity and Youden Index of the MNA at Different Cutoff Values to Identify SGA Determined Malnourished Elderly Patients
| Cutoff Value of MNA | Sensitivity | Specificity | Youden Index |
| 20.25 | 0.519 | 0.958 | 0.477 |
| 20.75 | 0.608 | 0.944 | 0.552 |
| 21.25 | 0.671 | 0.93 | 0.601 |
| 21.75 | 0.734 | 0.901 | 0.635 |
| 22.25 | 0.759 | 0.859 | 0.618 |
| 22.75 | 0.835 | 0.761 | 0.596 |
| 23.25 | 0.861 | 0.732 | 0.593 |
Table 8: Sensitivity, Specificity and Youden Index of the GNRI at Different Cutoff Values to Identify SGA Determined Malnourished Elderly Patients.
| Cutoff Value of GNRI | Sensitivity | Specificity | Youden Index |
| 107.7108 | 0.481 | 0.831 | 0.312 |
| 108.314 | 0.494 | 0.831 | 0.325 |
| 108.4759 | 0.494 | 0.817 | 0.311 |
| 108.6671 | 0.506 | 0.817 | 0.323 |
| 108.919 | 0.519 | 0.817 | 0.336 |
| 109.2059 | 0.519 | 0.803 | 0.322 |
| 109.6748 | 0.519 | 0.789 | 0.308 |
| 110.0016 | 0.532 | 0.789 | 0.321 |
| 110.2361 | 0.532 | 0.775 | 0.307 |
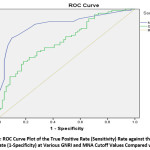 |
Figure 1: ROC Curve Plot of the True Positive Rate (Sensitivity) Rate Against the False Positive Rate (1-Specificity) at Various GNRI and MNA Cutoff Values Compared with SGA. |
Discussion
Several studies have shown that the prevalence of malnutrition amongst elderly hospitalized patients is on the rise around the world. Because malnutrition is under-recognized, the number of malnourished elderly hospitalized patients continues to rise over time. The prevalence of malnutrition was varying across settings, Rehabilitation settings had the highest prevalence of malnutrition, followed by hospitals, nursing homes, and communities.26 Interestingly, the wide range of malnutrition prevalence maybe because of lacking gold standard malnutrition assessment tools.15 Thus, the prevalence of malnutrition has been widely varied in literature, depending on the setting and nutritional assessment tool used.27, 28
According to the criterion SGA, 52.7 % of the Palestinian elderly patients were categorized as malnourished. This malnutrition rate is relatively in line with the previous international report (61.3%), where SGA was used among a similar population.29 On the other hand, the current study reported a higher prevalence of malnutrition among the geriatric population as reported by Harith and her coworkers, where almost one-third (34.7%) of the target population was malnourished.30 It’s worth mentioning that the rate of at-risk of malnourished groups was higher when identified by MNA compared with those identified by the GNRI, and this might be explained by the higher tendency of overestimating of at risk of malnutrition among the elderly population.31,32 Despite the congruence in identifying patients at risk of malnutrition between MNA and SGA, careful consideration is suggested when implementing the MNA to detect the risk of developing malnutrition about adverse health outcomes because the implications of positive screening results are ambiguous.33
According to MNA, the prevalence of malnutrition was lower than the prevalence of other recent Arabic studies conducted in the Saudi Arabia Kingdom (76.6%).34 In contrast, a recent systematic review and meta-analysis of studies using MNA have estimated the prevalence of malnutrition in hospital settings at 22%.35 The length of hospital stay may impact the nutritional status among those age groups, thus the controversy in literature may be explained depending on the admission or discharge day. The prevalence of malnourished according to GNRI when expressed as a binary variable was (4.0%), which was extremely lower than the prevalence indicated by SGA and MNA in this study. The prevalence of malnutrition using GNRI in the recent Malaysian study using GNRI was higher (44.02%) than our study results.36 Another study conducted in Japan indicated that (30.2%) of assessed patients had a moderate to high risk of malnutrition.37 These findings may be because obese patients counted for more than half of investigated patients in this study. Also, body weight is an important component of the GNRI formula (when body weight increases, the score of GNRI increases). As a result, the optimal cutoff point for the GNRI in detecting elderly patients with malnutrition may need to be established at the new cutoff.
The Abed Aziz research group results indicated a statistical association between the MNA and GNRI with the sub-classification of nutritional status by the SGA, particularly for the sub-classification of malnutrition diagnosis.36 Furthermore, the malnourished group identified by the MNA and GNRI in the above-mentioned study36 had poor biochemical and anthropometric measurements, including low MAC and CC values. Muscle mass and subcutaneous fat can be measured using these nutritional markers,38,39 which can be related to mortality risk. Blood biomarkers for malnutrition are no longer recommended by the Academy of Nutrition and Dietetics and American Society for Parenteral and Enteral Nutrition, however biochemical characteristics such as albumin could still be employed to detect a systemic inflammatory response, and so contribute to the identification of the etiologic foundation for malnutrition diagnosis.40-42
Depending on three objective parameters of height, weight and albumin make the GNRI a simpler method than the MNA in assessing the nutritional status of elderly patients. The current study indicated that both MNA and GNRI had high specificity, which is essential in nutritional assessment because a correct diagnosis of malnourished patients will prevent unnecessary treatment and intervention in individuals who do not require it.5
Patients diagnosed with malnutrition require appropriate treatment to prevent further deterioration in nutritional status; thus, the wrong diagnosis of malnutrition will increase the unnecessary cost of medical care.16, 18, 43 The low sensitivity of MNA and GNRI makes them unsuitable for screening purposes. A previous study reported that the GNRI tended to have high specificity (0.717) and low sensitivity (0.545) when compared with the SGA, but it is important to mention that the target population was patients under peritoneal dialysis.44 Another validation study of various nutritional diagnostic tools was in line with our findings and indicated that the GNRI had the lowest sensitivity (0.66) and the highest specificity (0.921) among the other tools.45 The convergence of the results in terms of the AUC value of both MNA and GNRI indicates the ability of the GNRI to differentiate between malnourished and non-malnourished populations. Although using newly emerging GNRI and MNA cutoff values (108.919 and 21.75) will improve sensitivity and specificity of both tools will remain high.
Conclusion and recommendations
Malnutrition among elderly hospitalized patients is still a worrisome issue in Palestine, and our study has highlighted this issue. Despite the improvement in health services, the prevalence of malnutrition among hospitalized elderly patients remains high. Thus, early and accurate diagnosis of malnutrition is essential. This study indicates that the GNRI had comparable validity to the MNA, with both showing high specificity and PPV and low sensitivity.
The high AUC value of the GNRI, similar to that of the MNA and the SGA, implies that its overall diagnostic accuracy in differentiating malnourished elderly patients was still very good. New cutoff points of MNA and GNRI 21.75 and 108.919, respectively, were suggested when using the MNA and GNRI in assessing nutritional status among Palestinian elderly patients. This research can be used as a starting point for a new research topic in Palestine, to recommend a higher-quality approach to nutritional care practice in Palestine. The MNA and GNRI were verified in this study only based on their criterion validity. Thus, more intensive research and in-depth evaluations of the predictive validity of the MNA and GNRI for hospitalization need to be conducted. Based on the newly emerged cutoff points, this study still suggests using the MNA and GNRI for assessing the nutritional status among hospitalized elderly patients in Palestine.
Acknowledgments
To all of the participants in the study as well as the Palestinian Ministry of Health, we would like to convey our gratitude, which permits us to conduct this study in the affiliated hospital. The academic staff of Al-Azhar University-Gaza is thanked for their continuing support and collaboration on this project, as well. We would like to express our sincere gratitude to the ECNAD team for their direction and assistance in completing this study. We would also like to thank Jennifer Kastner for her efforts in English language editing.
Conflict of Interests
The authors declare that they have no conflict of interest.
Funding Sources
This study did not receive a grant from any institution or organization.
References
- White JV, Guenter P, Jensen G, Malone A, Schofield M. Academy of Nutrition and Dietetics and American Society for parenteral and enteral nutrition. J Parenter Enter Nutr, 2012; 36(3): 275-83.
- WHO, World population aging 2019. United Nations. Department of Economic, Social Affairs. Population Division UN, UK distributor: Stationery Office. World poulation ageing highlights. Avalibale at https://www.un.org/en/ development/desa/population/publications/pdf/ageing/WorldPopulationAgeing2019-Highlights.pdf
- PCBS, Palestinian Central Bureau of Statistics (PCBS) On the Eve of World Elderly Day 1/10/2018.
- Phillips MB, Foley AL, Barnard R, Isenring EA, Miller MD. Nutritional screening in community-dwelling older adults: a systematic literature review. Asia Pac J Clin Nutr. 2010;19(3):440-449.
- Abd Aziz NAS, Teng NIMF, Abdul Hamid MR, Ismail NH. Assessing the nutritional status of hospitalized elderly. Clin Interv Aging. 2017;12:1615-1625. doi:10.2147/CIA.S140859
- Van Tonder E, Kelly A, Van Rooyen RM. Views of public hospital professional nurses on adult malnutrition and their role in nutrition-related activities. International Journal of Africa Nursing Sciences. 2021 Jan 1;14:100300.
- Ruiz AJ, Buitrago G, Rodríguez N, Gómez G, Sulo S, Gómez C, Partridge J, Misas J, Dennis R, Alba MJ, Chaves-Santiago W. Clinical and economic outcomes associated with malnutrition in hospitalized patients. Clinical Nutrition. 2019 Jun 1;38(3):1310-6.
- Meneses D, Valero M, Calso M, Martín-Vega A, Gómez-Candela C. Costs associated to disease-related malnutrition and treatment: a literature review. Nutricion Hospitalaria. 2018 Mar 1;35(2):442-60.
- Tappenden KA, Quatrara B, Parkhurst ML, Malone AM, Fanjiang G, Ziegler TR. Critical role of nutrition in improving quality of care: an interdisciplinary call to action to address adult hospital malnutrition. JPEN J Parenter Enteral Nutr. 2013;37(4):482-497. doi:10.1177/0148607113484066
- Lim SL, Ong KC, Chan YH, Loke WC, Ferguson M, Daniels L. Malnutrition and its impact on cost of hospitalization, length of stay, readmission and 3-year mortality. Clin Nutr. 2012;31(3):345-350. doi:10.1016/j.clnu.2011.11.001
- Botero L, Young AM, Banks MD, Bauer J. Incidence and criteria used in the diagnosis of hospital-acquired malnutrition in adults: a systematic review and pooled incidence analysis. European Journal of Clinical Nutrition. 2022 May 2:1-3.
- Guyonnet S, Rolland Y. Screening for Malnutrition in Older People. Clin Geriatr Med. 2015;31(3):429-437. doi:10.1016/j.cger.2015.04.009
- Field LB, Hand RK. Differentiating malnutrition screening and assessment: a nutrition care process perspective. J Acad Nutr Diet. 2015;115(5):824-828. doi:10.1016/j.jand.2014.11.010
- Barker LA, Gout BS, Crowe TC. Hospital malnutrition: prevalence, identification and impact on patients and the healthcare system. Int J Environ Res Public Health. 2011;8(2):514-527. doi:10.3390/ijerph8020514
- Orlandoni P, Venturini C, Jukic Peladic N, et al. Malnutrition upon Hospital Admission in Geriatric Patients: Why Assess It?. Front Nutr. 2017;4:50. Published 2017 Oct 30. doi:10.3389/fnut.2017.00050
- Cederholm T, Bosaeus I, Barazzoni R, et al. Diagnostic criteria for malnutrition – An ESPEN Consensus Statement. Clin Nutr. 2015;34(3):335-340. doi:10.1016/j.clnu.2015.03.001
- Skipper A, Ferguson M, Thompson K, Castellanos VH, Porcari J. Nutrition screening tools: an analysis of the evidence. JPEN J Parenter Enteral Nutr. 2012;36(3):292-298. doi:10.1177/0148607111414023
- Cereda E. Mini nutritional assessment. Curr Opin Clin Nutr Metab Care. 2012;15(1):29-41. doi:10.1097/MCO.0b013e32834d7647
- Riveros C, Jazayeri SB, Chalfant V, Ahmed F, Bandyk M, Balaji KC. The Geriatric Nutritional Risk Index Predicts Postoperative Outcomes in Bladder Cancer: A Propensity Score-Matched Analysis. The Journal of urology. 2022 Apr;207(4):797-804.
- Keller H, Vucea V, Slaughter SE, Jager-Wittenaar H, Lengyel C, Ottery FD, Carrier N. Prevalence of malnutrition or risk in residents in long term care: comparison of four tools. Journal of nutrition in gerontology and geriatrics. 2019 Oct 2;38(4):329-44.
- Guigoz Y, Vellas B, Garry PJ. Assessing the nutritional status of the elderly: The Mini Nutritional Assessment as part of the geriatric evaluation. Nutr Rev. 1996;54(1 Pt 2):S59-S65. doi:10.1111/j.1753-4887.1996.tb03793.x
- Marshall S, Young A, Bauer J, Isenring E. Malnutrition in Geriatric Rehabilitation: Prevalence, Patient Outcomes, and Criterion Validity of the Scored Patient-Generated Subjective Global Assessment and the Mini Nutritional Assessment. J Acad Nutr Diet. 2016;116(5):785-794. doi:10.1016/j.jand.2015.06.013
- Lee, R.D., Nutritional assessment/Robert D. Robert, David C. Nieman. 2010: New York [etc.]: McGraw-Hill, 2003.
- Heymsfield SB, McManus C, Smith J, Stevens V, Nixon DW. Anthropometric measurement of muscle mass: revised equations for calculating bone-free arm muscle area. Am J Clin Nutr. 1982;36(4):680-690. doi:10.1093/ajcn/36.4.680
- Hajian-Tilaki K. Receiver Operating Characteristic (ROC) Curve Analysis for Medical Diagnostic Test Evaluation. Caspian J Intern Med. 2013;4(2):627-635.
- Ge Tan, S.L., Harith, S., Abdullah, H., & Yusuf, W.N. (2016). Re-evaluation of malnutrition risk screening tool-hospital (MRST-H) for geriatric patients: a multicentre study in Peninsular Malaysia. 2016. 45(9): 1311-1317.
- Kaiser MJ, Bauer JM, Rämsch C, et al. Frequency of malnutrition in older adults: a multinational perspective using the mini nutritional assessment. J Am Geriatr Soc. 2010;58(9):1734-1738. doi:10.1111/j.1532-5415.2010.03016.x
- Vischer UM, Frangos E, Graf C, et al. The prognostic significance of malnutrition as assessed by the Mini Nutritional Assessment (MNA) in older hospitalized patients with a heavy disease burden. Clin Nutr. 2012;31(1):113-117. doi:10.1016/j.clnu.2011.09.010
- Sahin S, Tasar PT, Simsek H, et al. Prevalence of anemia and malnutrition and their association in elderly nursing home residents. Aging Clin Exp Res. 2016;28(5):857-862. doi:10.1007/s40520-015-0490-5
- Hanisah R, Suzana S, Lee FS. Validation of screening tools to assess appetite among geriatric patients. J Nutr Health Aging. 2012;16(7):660-665. doi:10.1007/s12603-012-0056-6
- Abd-El-Gawad WM, Abou-Hashem RM, El Maraghy MO, Amin GE. The validity of Geriatric Nutrition Risk Index: simple tool for prediction of nutritional-related complication of hospitalized elderly patients. Comparison with Mini Nutritional Assessment. Clin Nutr. 2014;33(6):1108-1116. doi:10.1016/j.clnu.2013.12.005
- Cereda E, Pusani C, Limonta D, Vanotti A. The ability of the Geriatric Nutritional Risk Index to assess the nutritional status and predict the outcome of home-care resident elderly: a comparison with the Mini Nutritional Assessment. Br J Nutr. 2009;102(4):563-570. doi:10.1017/S0007114509222677
- Durán Alert P, Milà Villarroel R, Formiga F, Virgili Casas N, Vilarasau Farré C. Assessing risk screening methods of malnutrition in geriatric patients: Mini Nutritional Assessment (MNA) versus Geriatric Nutritional Risk Index (GNRI). Nutr Hosp. 2012;27(2):590-598. doi:10.1590/S0212-16112012000200036.
- Beck AM, Holst M, Rasmussen HH. Efficacy of the Mini Nutritional Assessment to predict the risk of developing malnutrition or adverse health outcomes for old people. E – S P E N: the European e-journal of clinical nutrition and metabolism. 2008;3(3):e102-e107. https://doi.org/10.1016/j.eclnm.2008.03.001
- Alzahrani SH, Alamri SH. Prevalence of malnutrition and associated factors among hospitalized elderly patients in King Abdulaziz University Hospital, Jeddah, Saudi Arabia. BMC geriatrics. 2017;17(1):1-7.
- Cereda E, Pedrolli C, Klersy C, et al. Nutritional status in older persons according to healthcare setting: A systematic review and meta-analysis of prevalence data using MNA®. Clin Nutr. 2016;35(6):1282-1290. doi:10.1016/j.clnu.2016.03.008
- Abd Aziz NAS, Mohd Fahmi Teng NI, Kamarul Zaman M. Geriatric Nutrition Risk Index is comparable to the mini nutritional assessment for assessing nutritional status in elderly hospitalized patients. Clin Nutr ESPEN. 2019;29:77-85. doi:10.1016/j.clnesp.2018.12.002
- Matsumura T, Mitani Y, Oki Y, et al. Comparison of Geriatric Nutritional Risk Index scores on physical performance among elderly patients with chronic obstructive pulmonary disease. Heart Lung. 2015;44(6):534-538. doi:10.1016/j.hrtlng.2015.08.004
- Sakinah, H., A. Siti NurAsyura, and S. Suzana, Determination of Calf Circumference Cut-Off Values for Malaysian Elderly and its Predictive Value in Assessing Risk of Malnutrition. J. Nutr. 2016. 22(3) 375-387.
- Suzana S Jr, Siti Saifa H. Validation of nutritional screening tools against anthropometric and functional assessments among elderly people in Selangor. Malays J Nutr. 2007;13(1):29-44.
- White JV, Guenter P, Jensen G, et al. Consensus statement of the Academy of Nutrition and Dietetics/American Society for Parenteral and Enteral Nutrition: characteristics recommended for the identification and documentation of adult malnutrition (undernutrition) [published correction appears in J Acad Nutr Diet. 2012 Nov;112(11):1899] [published correction appears in J Acad Nutr Diet. 2017 Mar;117(3):480]. J Acad Nutr Diet. 2012;112(5):730-738.doi:10.1016/j.jand.2012.03.012
- Zhang Z, Pereira SL, Luo M, Matheson EM. Evaluation of Blood Biomarkers Associated with Risk of Malnutrition in Older Adults: A Systematic Review and Meta-Analysis. Nutrients. 2017;9(8):829. doi:10.3390/nu9080829
- Cederholm T, Barazzoni R, Austin P, et al. ESPEN guidelines on definitions and terminology of clinical nutrition. Clin Nutr. 2017;36(1):49-64. doi:10.1016/j.clnu.2016.09.004
- Nur Fazimah, S., H. Sakinah, and M. Rosminah, Hospitalized geriatric malnutrition: a perspective of prevalence, identification and implications to patient and healthcare cost. Health Environ J. 4(1): 55-67.
- Szeto CC, Kwan BC, Chow KM, Law MC, Li PK. Geriatric nutritional risk index as a screening tool for malnutrition in patients on chronic peritoneal dialysis. J Ren Nutr. 2010;20(1):29-37. doi:10.1053/j.jrn.2009.04.00445.
- Rutstein R, Downes A, Zemel B, Schall J, Stallings V. Vitamin D status in children and young adults with perinatally acquired HIV infection. Clin Nutr. 2011;30(5):624-628. doi:10.1016/j.clnu.2011.02.005.

This work is licensed under a Creative Commons Attribution 4.0 International License.


