The Hypocholesterolemic Effect of Analogue Rice with the Addition of Rice Bran
Feri Kusnandar*
, Nancy Dewi Yuliana, Safrida and Slamet Budijanto Department of Food Science and Technology, Bogor Agricultural University (Ipb University), Bogor, Indonesia.
Corresponding Author Email: Fkusnandar@Apps.Ipb.Ac.Id
DOI : http://dx.doi.org/10.12944/CRNFSJ.10.1.13
Download this article as:
![]()
The objective of this study was to evaluate the hypocholesterolemic effect of analogue rice added with rice bran from three different rice varieties (white, red and black). The Sprague Dawley rats were fed ad libitum with six different chow formulas, i.e. standard diet equal to AIN-93G (C-), high-cholesterol diet (C+), high cholesterol diet plus analogue rice containing 15% coconut dregs flour (AR1), high cholesterol diet plus 10% rice bran from Ciherang white rice (AR2), Cere red rice (AR3), and Campoireng black rice (AR4). The diet intervention was conducted for 28 days. The total cholesterol (TC), high density lipoprotein cholesterol (HDL-C), low density lipoprotein cholesterol (LDL-C) and triglyceride (TG) of rat plasma as well as total fat of rat liver were analyzed. The results showed that rats fed with AR1, AR2, AR3 and AR4 exhibited significant decreases of TC, LDL-C, AI and liver fat, but increased of HDL-C in comparison to those of a high-cholesterol group (C+). This hypocholesterolemic effect is associated with the significant role of dietary fiber and/or -oryzanol. Among groups with diet containing rice bran, AR2 demonstrated the highest hypocholesterolemic effect followed by AR4 and AR3. The AR1 group also gave a significant hypochlolesterolemic effect (p less than 0.05) due to the role of the dietary fiber. As a conclusion, this study indicates that analogue rice added with rice bran and/or coconut dregs flour is a potential functional diet that is beneficial to lower the CHD risk.
KEYWORDS:Analogue Rice; Cholesterol; Function Food; Hypocholesterolemia; Rice Bran
Introduction
Rice bran is the outer layer of rice seed, representing 5.0-8.0% of the grain1, which is usually removed during de-husking and hulling process of paddy. The rice bran is a source of carbohydrate (34-62%), lipids (15-20%), protein (11-15%), dietary fiber (7-11%) and ash (7-10%)2. Rice bran is also a good source of essential fatty acids, such as palmitate (21-26%), linoleate (31-33%) and oleate (37-42%)3. There are a lot of rice varieties in Indonesia, which exhibit different nutrient composition and bioactive compound of their rice brans4,5. The rice pigment concentrates on its bran because of the presence of phenolic compounds and flavonoid6-7. Rice bran also contains phenolic compounds, such as tocopherols and tocotrienols8,9, oryzanols10,11, and phytosterols11-14.
Hypercholesterolemia is the presence of high level cholesterol in the blood as indicated by the elevated concentration of lipid and lipoprotein in blood 15. Hypercholesterolemia has emerged as a strong risk factor for cardiovascular heart disease (CHD)16. Several studies showed anti-hypercholesterolemia or so-called hypocholesterolemic effect of rice bran. Rice bran lowered blood cholesterol of experimental animals17,18 and humans13. Its supplementation in the rat diet reduced body weight, total cholesterol, triglycerides and LDL-C, and increased HDL-C, without changing its blood glucose concentration19. The hypocholesterolemic effects of rice bran occurred through a decrease in liver cholesterol synthesis, i.e. decreasing the activities of acetyl-CoA acetyltransferase 2 (ACAT-2), 3-hydroxy-3-methyl-glutaryl-coenzyme A reductase (HMG-CoA), and sterol-regulatory element-binding protein 2 (SREBP-2), and by increasing liver cholesterol degradation through human cholesterol 7 α-hydroxylase (CYP7a1) and human cholesterol 12 α-hydroxylase (CYP8b1)20.
The phytochemical components available in rice bran, such as g-oryzanol, significantly contributed to hypocholesterolemia13. The g-oryzanol is a phenolic compound composed of ferulic acid esters and triterpene alcohols, which allow lowering total cholesterol and plasma LDL-C in experimental animals18. This is allied to the ability of g-oryzanol to suppress lypogenesis in the liver and increase fecal fat excretion21.
The previous researches also showed the role of dietary fiber to reduce total cholesterol and LDL-C in blood, causing a decrease risk of CHD22-24. The dietary fiber is able to bind bile acids in the small intestine and then excreting them with feces. As a result, the endogenous cholesterol as a constituent of bile acids are breakdown, hence the cholesterol levels decrease. In addition, the fermentation of soluble dietary fiber in colon produces short chain fatty acids (SCFA) such as propionic acid which suppresses the cholesterol formation24.
The previous study provides information of rice bran potency in food processing as a functional ingredient that demonstrates hypocholesterolemic effect. One of the potential food product supplemented by rice bran is analogue rice. Analogue rice has been developed by applying an extrusion technology, which yielded artificial rice with acceptable physical and sensory quality25-29. Our previous study developed a cassava flour and sago starch-based analogue rice with the addition of coconut dregs flour28. In another study, analogue rice was formulated by the addition of rice bran with the aim of increasing nutrition content and health functional benefit30. The analogue rice supplemented by rice bran potentially provides hypocholesterolemic effect, which is beneficial for people to lessen the risk of CHD attack. To provide scientific evidence, the study on hypocholesterolemic effect of analogue rice added by rice bran is required.
This study was aimed at evaluating the hypocholesterolemic effect of cassava flour, sago and coconut dregs flour mixture in analogue rice with the addition of rice bran. This research utilized three rice brans as byproducts of rice milling process, i.e. white, red and black rice. The study used experimental rats, and hypocholesterolemic effect was measured based on plasma profile and total fat of liver rats after diet intervention.
Materials and Method
Materials
The materials used in analogue rice processing were cassava flour, sago flour, rice bran, coconut dregs flour and glycerol monostearate. Cassava flour was made from fresh cassava involving steps of washing, peeling, slicing into very thin shape, drying overnight in an oven and milling with a disc mill27. Sago flour was purchased from a local supplier in Bogor, Indonesia. Coconut dregs flour as a byproduct of coconut milk processing was obtained from a local manufacturer. Rice brans of three local rice varieties in Indonesia, i.e. Ciherang (white rice), Cere (red rice) and Campoireng (black rice), were obtained as a byproduct of rice milling process. Rice grain was milled using a rice miller (Satake) and the brown rice yield was further hulled using a Satake grain huller. The rice bran was initially stabilized by heat treatment using a twin-screw extruder at a barrel temperature of 120°C and a screw speed of 900 rpm in order to inactivate lipase and lipoxygenase enzymes30-31. Glycerol monosterate (GMS) was purchased from Lautan Luas Ltd, Indonesia. Sprague Dawley rats for animal study was obtained from the School of Veterinary Medicine, Bogor Agricultural University. The g-oryzanol standard was purchased from Wako Chemical Industries Co. Ltd., Japan. All chemicals used for chemical and biochemical analyses were of analytical grade.
Analogue Rice Formulation and Processing
The standardized ingredients and method of analogue rice processing referred to Patent # PID20181107932. The ingredients (i.e. cassava flour, sago, coconut dregs flour and rice bran) were mixed gently using a dry mixer. The composition of dry mixture is presented in Table 1. Glycerol monostearate (GMS) (2%) and water (50%) were added into the mixture to form dough (the percentages of GMS and water were calculated as a total amount of dry mixture). The dough was fed into a twin-screw extruder (Berto BEX-DS-2256, Indonesia) at a barrel temperature of 85oC, screw speed of 96.8 rpm, and cutter speed of 71.2 rpm27. The analogue rice had a rice-like shape after passing out the die. The analogue rice was then dried in an oven at 85oC for 1.5 hours (Figure 1). Analogue rice samples were analyzed in terms of chemical composition, g-oryzanol content, and animal study.
Table 1: Formulation of Analogue Rice added with Coconut Dregs Flour and Rice Bran.
| Formula | Cassava flour (%) | Sago starch (%) | Coconut dregs flour (%) | Rice bran (%) | ||
| Ciherang | Cere | Campoireng | ||||
| F1 | 44.0 | 41.0 | 15.0 | – | – | – |
| F2 | 44.0 | 41.0 | 5.0 | 10.0 | – | – |
| F3 | 44.0 | 41.0 | 5.0 | – | 10.0 | – |
| F4 | 44.0 | 41.0 | 5.0 | – | – | 10.0 |
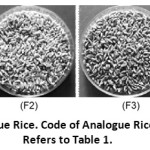 |
Figure 1: Analogue Rice. Code of Analogue Rice Formulation Refers to Table 1. |
Animal Study
The animal study followed strictly the Guidelines for Health Research Ethics and was approved by the Ethical Approval Commission of the Health Research and Development Agency, Ministry of Health, Indonesia (LB.02.01/5.2/KE.288/2015). Sprague-Dawley rats (48 males, 40-60 g each) were housed individually in clean ventilated cages (28-30oC, relative humidity of 75%, and a photo cycle of 12 hours light/12 hours dark). Each rat was handled well to minimize suffering during the experiment.
Adaptation period was performed for a week by feeding the rats with a standard rat chow (AIAN 93G) and water available ad libitum. Rats were divided randomly into six groups (8 rats per group) for diet intervention (Table 2). Group 1 (negative control or C-) was fed by a standard feed. Group 2 (positive control or C+) was fed by standard feed plus cholesterol and sodium cholate in order to make hypercholesterolemic condition of rats33. Groups 3 (AR1) were fed same as C+ plus 15% coconut dregs flour, and Group 4 to 6 were fed by chow same as C+ plus 5% coconut dregs flour and 10% analogue rice (AR2, AR3 and AR4, respectively).
Diet intervention was carried out every day at 9.00 AM for 28 days. Rat diets (20 g each) and water were provided ad libitum to each group. Diet consumption was measured every day by weighing the remaining chow and subtracting this weight from the total diet weight given in the previous day. The rats were weighed every two days. At the end of experiment, body weight gain, total and average food intake were calculated.
After fasting for twelve hours, the treated rats were anaesthetized using diethyl ether, and their blood (approximately 3 mL) was taken through the liver with a direct cardiac puncture. The blood was stored in a refrigerator of 4-6oC before analysis. Rats were then sacrificed and the organs (liver, kidney and adipose tissue) were collected. The organs were cleaned and washed with physiological saline solution, dried with dry tissue paper, and weighed. The organ weight is expressed as relative weight, which is weight of the organ per average body weight of rat. The liver part was analyzed for its total fat.
Table 2: Chow Composition for Each Experimental Rat Group (in g/100 g)
| Components | Group | |||||
| Control – (C-)a |
Control +(C+) | AR1 | AR2 | AR3 | AR4 | |
| Protein (casein) | 20.00 | 20.00 | 18.95 | 18.32 | 18.22 | 17.92 |
| Fat (palm oil) | 7.00 | 7.00 | 3.76 | 4.74 | 4.75 | 4.08 |
| Cellulose | 5.00 | 5.00 | 0.45 | 2.43 | 2.26 | 1.50 |
| Mineral mix | 3.50 | 3.50 | 3.21 | 2.74 | 2.69 | 2.64 |
| Vitamin mix | 1.00 | 1.00 | 1.00 | 1.00 | 1.00 | 1.00 |
| Water | 10.00 | 10.00 | 5.43 | 4.09 | 3.13 | 3.61 |
| Sucrose | 10.00 | 10.00 | 10.00 | 10.00 | 10.00 | 10.00 |
| Carbohydrate (corn starch) | 43.50 | 43.50 | – | – | – | – |
| Sodium cholate | – | 0.125 | 0.125 | 0.125 | 0.125 | 0.125 |
| Cholesterol | – | 0.50 | 0.50 | 0.50 | 0.50 | 0.50 |
| Analogue riceb | – | – | 57.21 | 56.94 | 57.96 | 59.25 |
s Standardized -AIN 93G34
b Analogue rice formulation in Groups F1 to F4 refers to Table 1
Proximate Analysis
Analyses of moisture (gravimetric method), ash (gravimetric method), fat (soxhlet method), and protein (Kjeldahl method) followed the AOAC procedures35. Total dietary fiber (TDF), soluble dietary fiber (SDF) and insoluble dietary fiber (IDF) were analyzed by an enzymatic-gravimetric method35. The total carbohydrate was determined by difference, i.e. 100 – (moisture + ash + fat + protein). The chemical composition was expressed in the percentage of wet basis.
g-Oryzanol Analysis36
Sample (1 g) was reconstituted with 5 mL of distilled water and then added 0.2 g ascorbic acid. The solution was shaken and incubated at 60°C for 30 minutes. Five mL of isopropanol and hexane mixture (50: 50) was added to test tubes and shaken gently for 30 seconds to provide homogenous solution. The solution was centrifuged at 3000 rpm for 15 minutes, and organic layer was collected. The extraction process was repeated for the remaining residue and the organic layer obtained was mixed with the previous layer. The organic layer was washed with 5 mL aquabidest and blasted with nitrogen gas. Rice bran oil extract was diluted in the mobile phase (methanol: acetonitrile : dichloromethane : acetic acid; 50: 44: 3: 3, v/v) and filtered with PTFE membrane (0:45 mm). The sample solution (20μL) was injected into the C-18 HPLC column (Biorad Aminex HPX-87H, USA) with a flow rate of 1.0 mL/min. The g-oryzanol component was detected at a wavelength of 330 nm and quantification was performed using a standard curve of g-oryzanol solution standard.
Total Fat Analysis of Liver37
Rat liver (1 g) was added with 20 mL of chloroform-methanol mixture (2:1). The liver extract was filtered with a free-fat filter paper. A total of 10 mL of liver extract was mixed with 2 mL of 0.9% NaCl solution in a centrifuge tube, and then centrifuged (2400 rpm, 10 minutes) to obtain a clear organic layer. The organic layer was washed twice using 1.5 mL of chloroform: methanol: water (8:4:3), and inserted into the vial. Extract was blasted with nitrogen gas and weighed. The total fat content was expressed as g fat per g liver.
Plasma Lipid Profile Analysis
Blood samples of experimental rats were incorporated into EDTA tubes and centrifuged at 3000 rpm for 10 minutes38. Transparent layer on the top was the plasma which was used for lipid profile analysis (TC, LDL-C, HDL-C, TG and atherogenic index (AI).
TC was analyzed using the cholesterol oxidase-p-aminophenozone (CHOD-PAP) method39. The plasma sample (10 mL) was mixed with 1 mL reagent kit (containing cholesterol esterase, cholesterol oxidase, phenol, 4-aminoantipyrine, peroxidase and buffer), inserted into a tube and mixed until homogeneous. The mixture was incubated at 37oC for 5 minutes, and the absorbance was read using a UV-Vis spectrophotometer at a wavelength of 546 nm and the total cholesterol concentration was determined using a cholesterol standard solution.
HDL-C was analyzed by applying a precipitation method40. The plasma sample (200 μL) was mixed with 500 μL precipitation reagents (phosphotungstic acid and MgCl2), then incubated at room temperature for 10 minutes. The sample was centrifuged (4000 rpm, 10 minutes). After centrifugation, HDL-C fraction remained in the supernatant. A total of 100 µL supernatant was taken and incubated at room temperature for 10 minutes and mixed with 1000 µL CHOD-PAP reagent solution. The mixture was incubated at 37oC for 5 minutes and the concentration of HDL-C was measured using a UV-Vis spectrophotometer at a wavelength of 546 nm using a cholesterol standard solution.
TG analysis followed the glycerol-3-phosphate oxidase phenol aminophenazone (GPO-PAP) method41. The plasma sample (100 mL) was initially hydrolyzed by lipase enzyme. The sample was then mixed with 1 mL of reagent kit and incubated at 37oC for 5 minutes. The concentration of TG was measured using a UV-Vis spectrophotometer at a wavelength of 546 nm.
LDL-C and AI was calculated using the following formula:16,42: LDL-C = TC – (HDL-C + TG/5) and AI = (TC – HDL-C)/HDL-C.
Statistical Analysis
One-way analysis of variance (ANOVA) was performed using SPSS Statistics 20.00 software (SPSS Inc., Chicago IL, USA), which assessed the level of significant differences among data (cutoff of p<0.05). The data was presented in average followed by a standard deviation or error bar. The Pearson correlation analysis among parameters used SPSS 20.00 at a cutoff of p<0.05.
Results
Characteristics of Analogue Rice
The chemical composition of rice brans from Ciherang, Cere, and Campoireng varieties used in analogue rice formulation is presented in Table 3. Each rice bran had different contents of ash (6.39-8.21%), protein 14.71-16.38%), fat (10.47-14.31%) and total carbohydrates (49.80-52.81%). The total dietary fiber (TDF), which is composed of SDF and IDF, made up 42.8% to 54.0% of total carbohydrates. The rice brans also contained relatively high g-oryzanol (1355.97-1602.51 mg/g). Rice bran from Cere varieties had the lowest content of TDF and g-oryzanol in comparison to rice bran from Ciherang and Campoireng varieties. The TDF and oryzanol contents were comparable to the previous work14,30,43.
Table 3: Chemical Composition of Rice Brans of Three Rice Varieties.
| Component (%wb) | Rice Varieties | ||
| Ciherang | Cere | Campoireng | |
| Moisture (%wb) | 13.76±0.09c | 13.19±0.00b | 11.59±0.05a |
| Ash (%wb) | 8.02±0.04c | 6.39±0.11a | 8.21±0.11b |
| Protein (%wb) | 12.69±0.08a | 13.14±0.08b | 14.48±0.01c |
| Fat (%wb) | 14.31±0.06c | 10.47±0.05a | 12.39±0.05b |
| Total carbohydrate (%wb) | 50.62±0.24a | 52.81±0.63c | 49.80±0.75b |
| TDF (%wb) | 26.67±0.04b | 22.58±0.53a | 26.90±0.74b |
| SDF (%wb) | 7.14±0.15c | 6.01±0.01b | 4.08±0.29a |
| IDF (%wb ) | 19.53±0.19b | 16.57±0.51a | 22.83±0.45c |
| g-oryzanol (µg/g) | 1407.73+50.68a | 1355.97+21.95a | 1602.51+24.16b |
Number followed by different letter presented at the same row shows significant differences at p<0.05
Analogue rice added with 10% rice bran (F2, F3, F4) had higher mineral and protein contents, and lower fat and total carbohydrate contents than those of analogue rice without rice bran (F1) (Table 4). Although the total carbohydrate decreased, the SDF and IDF increased in comparison to F1. Likewise, analogue rice (F2-F4) also contained a relatively high g-oryzanol (197.19-226.20 mg/g). The analogue rice added with Cere rice bran showed the lowest g-oryzanol content compared with the two others, which corresponded to its rice bran. The F1 did not contain g-oryzanol but it had TDF which derived from the mixture of coconut dregs flour, cassava flour, sago and cellulose.
Table 4: Chemical Composition of Analogue Rice.
| Components | F1 | F2 | F3 | F4 |
| Moisture (%wb) | 7.41±0.09a | 9.40±0.06b | 10.60±0.18d | 9.74±0.20c |
| Ash (%wb) | 0.47±0.01a | 1.21±0.02b | 1.25±0.00c | 1.32±0.01d |
| Protein (%wb) | 1.69±0.04a | 2.66±0.09b | 2.74±0.03b | 3.17±0.08c |
| Fat (%wb) | 5.25±0.25d | 4.02±0.17b | 3.47±0.07a | 4.44±0.24c |
| Total carbohydrate (%wb) | 85.18±0.43c | 82.70±0.25b | 81.93±0.09a | 81.33±0.51a |
| TDF (%wb) | 6.11±0.82a | 6.76±0.26a | 6.90±0.62ab | 7.31±0.35b |
| SDF (%wb) | 2.03±0.65a | 2.15±0.14a | 1.70±0.34a | 1.92±0.03a |
| IDF (%wb ) | 4.08±0.16ab | 4.61±0.12a | 5.27±0.75b | 5.39±0.32b |
| g-oryzanol (µg/g) | n.d. | 214.72+1.26b | 197.19+6.73a | 226.20+3.89b |
Number followed by different letter presented at the same row shows significant differences at p<0.05; n.d. not detected; Code of analogue rice refers to Table 1.
Performance of Experimental Rats
Figure 2 presents average body weights for the six groups of rats over the 28 days of the experiment, which ranged from 60.2 to 74.2 g per each. There was no significant different (p>0.05) in the initial body weight among rat groups. The average of chow consumption by each rat ranged from 12.7-14.0 g per day or 66.5-70% of daily diet. It means that the different diet formulation did not significantly affect the proximate feed intake in experimental groups (Table 5). The rat weight increased linearly during dietary treatments and the average weight gain of each rat was 83.6-107.8 g at the end of diet intervention. The body weight of rats in C- group tended to increase more slowly than that of the C+ and groups of AR1 to AR4. The average weight gain of C- at the end of chow intervention was also lower than that of other groups. The addition of cholesterol and sodium cholate into the chow increase the absorption and accumulation of fat and cholesterol33, which was responsible to the increase of rat body weight.
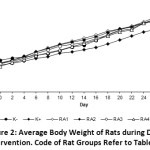 |
Figure 2: Average Body Weight of Rats during Diet Intervention. Code of Rat Groups Refers to Table 2. |
Table 5: Body Weight and Food Intake of Experimental Rats.
| Group | Total diet consumption (g) | Average food intake (g/day) | Initial body weight (g) | Final body weight (g) |
Weight gain (g) |
| C- | 383.48±16.62bc | 13.7+0.59a | 74.2+8.31a | 157.80±12.99a | 83.6+2.60a |
| C+ | 386.72±12.72bc | 13.8+0.45a | 63.6+5.40a | 176.60±16.95a | 113.0+3.39b |
| AR1 | 392.48±10.24c | 14.0+0.37b | 68.4+4.45a | 172.60± 9.13a | 104.2+1.83b |
| AR2 | 354.26±14.62a | 12.7+0.52a | 67.4+6.20a | 167.80± 9.47a | 100.4+1.89b |
| AR3 | 372.50±26.81a | 13.3+0.96a | 66.0+5.32a | 170.00±15.28a | 104.0+3.06b |
| AR4 | 366.00±21.13a | 13.7+0.75a | 60.2+6.15a | 168.00±18.87a | 107.8+3.77c |
Number followed by different letter presented at the same column shows significant differences at p<0.05 (n = 5). Code of rat groups refer to Table 2.
The relative weight of organs (liver, kidney and adipose tissue) of experimental rats is presented in Table 6. There was no noticeable difference (p>0.05) in the weight of kidney and adipose tissue in all groups under study. It indicates the different diet intervention did not affect the weight of kidney and adipose tissue. On the contrary, the liver weight significantly increased in C+ group and those rat groups fed with analogue rice (AR1, AR2, AR3, and AR4) compared with the C- group. These increases were attributed to the accumulation of cholesterol in the liver33. The highest increase in the liver weight was observed for C+ group (Table 4), which is similar to earlier report16,44. The AR1 and AR3 groups did not change the liver weight in comparison to C+ group. However, the liver weight of rats in AR2 and AR4 groups decreased significantly by 13.55% and 14.80%% respectively in comparison to that of C+ group. The result indicates that the consumption of analogue rice containing rice bran, especially AR2 and AR4, had a synergic effect to reduce the accumulation of cholesterol in rat liver.
Table 6: Relative Weight of Liver, Kidney and Adipose of Experimental Rats at the end of Diet Intervention (g/g body weight)
| Group | Liver | Kidney | Adipose |
| C- | 3.18±0.18a | 0.69±0.03a | 0.83±0.18a |
| C+ | 5.05±0.25c | 0.71±0.02a | 0.95±0.27a |
| AR1 | 4.82±0.50bc | 0.74±0.05a | 0.90±0.15a |
| AR2 | 4.53±0.17b | 0.72±0.02a | 0.96±0.24a |
| AR3 | 4.80±0.37bc | 0.69±0.01a | 0.93±0.10a |
| AR4 | 4.50±0.25b | 0.73±0.06a | 0.88±0.15a |
Number followed by different letter presented at the same column shows significant differences at p<0.05 (n = 5). Code of rat groups refer to Table 2.
Figure 3 shows the TF content in liver of experimental rats. The provision of high cholesterol chow in C+ group gave a higher TF of the liver compared to C-. The provision of analogue rice in the AR2, AR3 and AR4 groups resulted in the decrease of TF accumulation in comparison to C+ group. The AR2 group gave the lowest TF, followed by the AR4 and AR3, while the AR1 group exhibited the lowest decrease of TF among AR group. The TF was positively correlated with liver organ weights (r= 0.745), representing the higher the TF of the liver resulted in the higher weight of the liver because of fat accumulation38.
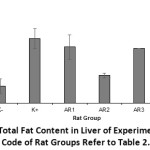 |
Figure 3: Total Fat Content in Liver of Experimental Rats. Code of Rat Groups Refers to Table 2. |
Plasma Lipid Profile
Rats fed with a normal diet (C-) showed a normal TC, LDL-C, HDL-C and TG concentrations (Table 7), indicating they were in a normal condition. The diet intervention with a high-cholesterol diet (C+) experienced a significant increase of TC and LDL-C and significant decrease of HDL-C and LDL-C (p<0.05), meaning that the rats were in a hypercholesterolemic condition. The TC concentration in intervention groups was well below 200 mg/dL (normal range) in exception for AR3 (215.0 mg/dL). However the TC concentration in AR3 group was significantly lower than that of C+ group (p <0.05). AR2 group experienced the highest TC-lowering effect (65.45%) compared with those of C+ group, followed by AR4 group (57.15%), AR1 group (50.62%) and AR3 group (29.78%).
Intake of a high-cholesterol chow in C+ group caused a significant decrease of plasma HDL-C in comparison to C- (84.4 mg/dL). The provision of analogue rice in AR1, AR2, AR3 and AR4 increased significantly the plasma HDL-C in comparison to C+ group (Figure 3).
Rats at C- group showed a higher level of TG concentration (76.0 mg/dL) than that of C+ group (67.6 mg/dL). AR4 group had the highest TG concentration (140.2 mg/dL), but this concentration was below the normal limit (150.00 mg/dL). The AR1 group also showed a decrease in TG level (59.8 mg/dL), which was attributed to dietary fiber available in coconut dregs flour.
Table 7: TC, LDL-C, HDL-C, TG Concentrations, and AI in Rats Fed with Experimental Diets for 28 Days.
| TC (mg/dL) |
HDL-C (mg/dL) |
LDL-C (mg/dL) |
TG (mg/dL) |
AI | |
| C- | 90+11.1a | 84.4+11.0c | 40.8+4.1a | 67.6+12.6a | 0.07+0.04a |
| C+ | 343+41.4c | 41.6+ 9.0a | 160.0+11.5c | 76.0+15.9ab | 8.14+0.84d |
| AR1 | 151.2+49.7ab | 52.8+12.9ab | 104.0+41.7b | 59.8+ 8.8a | 2.27+1.49bc |
| AR2 | 105.8+26.0a | 52.8+ 2.9ab | 91.2+28.4b | 100.0+43.5c | 1.00+0.42b |
| AR3 | 215.0+64.7b | 49.2+ 3.9ab | 159.4+21.7ab | 85.0+21.4b | 3.34+1.13c |
| AR4 | 131.2+49.8a | 58.0+12.1b | 116.4+31.3b | 140.2+14.0d | 1.19+0.45b |
Number followed by different letter presented at the same column shows significant differences at p<0.05. Code of rat groups refer to Table 2.
AI indicates a major risk factor for atherosclerotic plaque formation that affect the incidence of CHD38. The higher AI indicates the higher risk of CHD. AI decreased significantly in all AR groups compared to that of C+ group, i.e. 72.1% (AR1), 87.7% (AR2), 59.0% (AR3) and 85.4% (AR4).
Discussion
The three types of rice bran (Ciherang, Cere and Campoireng) had different TDF content (6.11-7.31%wb), which was composed of IDF and SDF. Rice bran from Cere rice contained the lowest TDF compared to that of two others. The different TDF content of rice bran affected the composition of the TDF in analogue rice (Table 4). The SDF correlated significantly with TC, LDL-C, AI and TF, whereas IDF only correlated significantly (p<0.05) with LDL-C (Table 8). Neither SDF nor IDF correlated significantly with HDL-C. The result indicates that SDF contributed significantly to the decrease in TC, LDL-C, AI and TF, while IDF contributed significantly (p<0.05) to the decrease of LDL-C. SDF is able to absorb cholesterol and bile acids, which are then removed from the body through the stool45. Moreover, the fermentation of SDF in the large intestine stimulates the production of short chain fatty acids, such as propionic acid which inhibits the production of cholesterol22.
Table 8: Coefficient Correlation Between TC, LDL-C, HDL-C, TG, AI, and TF with g-oryzanol, SDF and IDF.
| g-oryzanol | SDF | IDF | |
| TC | -0.890* | -0.943* | -0.624 |
| LDL-C | -0.712* | -0.972* | -0.770* |
| HDL-C | 0.975* | 0.302 | 0.379 |
| TG | -0.930* | -0.076 | -0.235 |
| AI | -0.888* | -0.749* | -0.445 |
| TF | -0.768* | -0.844* | 0.449 |
*Significantly correlated at p<0.05
Consumption of analogue rice without the addition of rice bran (F1) also revealed a relatively high TDF of rat plasma although it was lower than that of F2, F3 and F4. The significant decrease of TC, LDL-C, AI and TF in AR1 group compared with C+ group was associated with the role dietary fiber. The dietary fiber derived from mixed materials in the chow (cellulose, cassava flour, sago flour and coconut dregs flour).
Rice bran from Campoireng (black rice) contained the highest g-oryzanol, while rice bran from Cere rice was the lowest (Table 3), which corresponded to the g-oryzanol content present in analogue rice (Table 4). The g-oryzanol significantly related to the decrease of TC, LDL-C, TG, AI and TF and the increase of HDL-C (Table 8). This result confirms the previous research which showed a significant role of g-oryzanol to hypocholesterolemic effect18,46. The possible mechanism of cholesterol-lowering effect related to the role of g-oryzanol to interfere with cholesterol absorption as well as increase excretion of cholesterol and its metabolites in feces. The digestive enzymes may metabolizes g-oryzanol in the digestive tract, which breaks it into free ferulic and sterols. The free ferulic is absorbed and acts as an antioxidant in the plasma along with the action of free sterols that prevents the absorption of cholesterol in the digestive tract18.
This study suggests the significant role of dietary fiber (especially SDF) and g-oryzanol present in rice bran to decrease the blood cholesterol level of hypercholesterolimic rats. The CHD risk of the rats is also lowered as indicated by the significant decrease of AI. Consumption of analogue rice added with rice bran from white rice (Ciherang) had the highest hypocholesterolemic effect followed by that of black rice (Campoireng) and red rice (Cere). The rice analog intake containing 15% coconut dregs flour also revealed a hypocholesterolemic effect owing to the role of dietary fiber.
Conclusion
Intake of rice cassava-based analogue rice with the addition of 15% coconut dregs flour (F1), 5% coconut dregs plus 10% rice bran from white rice (F2), red rice (F3) or black rice (F4) exhibited significant hypocholesterolemic effect on experimental rats as characterized by the decrease of TC, LDL-C, AI and liver fat as well as increase of HDL-C. Rats at AR2 group experienced the highest hypocholesterolemia followed by AR4, AR F1 and AR3. The hypocholesterolemic effect is associated with the significant contribution of SDF and/or g-oryzanol in rice bran. This study suggests that analogue rice added with rice bran and/or coconut dregs flour is a potential functional diet that is beneficial to lower the CHD risk.
Acknowledgments
The authors acknowledge the support of a laboratory facility for animal study provided by the SEAFAST Center, Bogor Agricultural University. The authors also gratefully acknowledge the Governor of West Java Province for the financial support in this research.
Funding Source
This research was also partly funded by a KLN research grant from the Directorate General of Higher Education, Ministry of Research and Technology and Higher Education, Republic of Indonesia. The authors did not receive any financial support for the authorship and publication of this article.
Conflict of Interest
The authors have no conflict of interest.
References
- Silva A., Sanches C., Amante E. R. Prevention of Hydrolytic Rancidity in Rice Bran. J Food Eng. 2006; 75(4): 487-491.
CrossRef - Qureshi A. A., Sami S. A., Khan F. A. Effects of Stabilized Rice Bran, its Soluble and Fiber Fractions on Blood Glucose Levels and Serum Lipid Parameters in Humans with Diabetes Mellitus Types I and II. J Nutr Biochem. 2002; 13(3): 175-187.
CrossRef - Oliveira M. S, Feddern, V., Kupsk L., Cipolatti E. P., Badiale‐Furlong E., de Souza‐Soares L. A. Changes in Lipid, Fatty Acids and Phospholipids Composition of Whole Rice Bran after Solid‐State Fungal Fermentation. Bioresour Technol. 2011; 102(17): 8335-8338.
CrossRef - Trisnawati W., Suter K., Suastika K. Putra N. K. Effect of Drying Technique and Rice Variety to the Content of Antioxidant, Fiber, and Nutrient Composition of Rice Bran. Food Sci Qual Man. 2014; 31: 28-36.
- Kalpanadevi C., Singh V., Subramanian R. Influence of Milling on the Nutritional Composition of Bran from Different Rice Varieties. J Food Sci Technol. 2018; 55(6): 2259-2269.
CrossRef - Muntana N., Prasong S. Study on Total Phenolic Contents and Their Antioxidant Activities of Thai White, Red and Black Rice Bran Extracts. Pakistan J Biol Sci. 2010; 13(4): 170-174.
CrossRef - Pengkumsri N., Chaiyasut C., Saenjum C., Sirilun S., Peerajan S., Suwannalert P., Sirisattha S., Sivamaruthi B. S. Physicochemical and Antioxidative Properties of Black, Brown and Red Rice Varieties of Northern Thailand. Food Sci Technol. 2015; 35(2): 331-338.
CrossRef - Xu Z., Hua N., Godber J. S. Antioxidant Activity of Tocopherols, Tocotrienols, and Gamma-Oryzanol Components from Rice Bran against Cholesterol Oxidation Accelerated by 2,2′-Azobis(2-Methylpropionamidine) Dihydrochloride. J Agric Food Chem. 2001; 49(4): 2077-2081.
CrossRef - Schramm R., Abadie A., Hua N., Xu Z., Lima M. Fractionation of the Rice Bran Layer and Quantification of Vitamin E, Oryzanol, Protein, and Rice Bran Saccharide. J Biol Eng. 1: 1-9.
CrossRef - Xu Z, Godber J. S. Antioxidant Activities of Major Components of Gamma-Oryzanol from Rice Bran Using a Linolenic Acid Model. JAOCS. 2001; 78: 465-469.
CrossRef - Rosniyana A., Hashifah M. A., Norin S. A. S. Nutritional Content and Storage Stability of Stabilized Rice Bran – MR 220. J Trop Agric Food Sci. 2009; 37(2): 163-170.
- Hoed V. V., Depaemelaere G., Ayala J. V., Santiwattana P., Verhe R., Greyt W. D. Influence of Chemical Refining on the Major and Minor Components of Rice Brain Oil. 2006; 83: 315-321.
CrossRef - Most, M. M., Tulley R., Morales S., Lefevre M. Rice Bran Oil, Not Fiber, Lowers Cholesterol in Humans. Am J Clin Nutr. 2005; 81: 64-68
CrossRef - Min B., McClung A. M., Chen M. H. Phytochemicals and Antioxidant Capacities in Rice Brans of Different Color. J Food Sci. 2011; 76(1): C117-C126.
CrossRef - Durrington P. The Lancet. 2003; 362(9385): 717-731.
CrossRef - Ali R. F. M. Hypocholesterolemic Effects of Diets Containing Different Levels of kishk as a Dried Fermented Milk Whole Wheat Mixture in Experimental Rats. J Eth Food. 2016; 3: 117-123.
CrossRef - Kahlon T. S., Chow F. I., Chiu M. M., Hudson C. A., Sayre R. Cholesterol-Lowering by Rice Bran and Rice Bran Oil Unsaponifiable Matter in Hamsters. Cereal Chem. 1996; 73(1): 69-74.
- Wilson T. A., Nicolosi R. J., Woolfrey B., Kritchevsky D. Rice Bran Oil and Oryzanol Reduce Plasma Lipid and Lipoprotein Cholesterol Concentrations and Aortic Cholesterol Ester Accumulation to a Greater Extent than Ferulic Acid in Hypercholesterolemic Hamsters. J Nutr Biochem. 2007; 18: 105-112.
CrossRef - Hernawati, Manalu W., Suprayogi A., Astuti D. Perbaikan Parameter Lipid Darah Mencit Hiperkolesterolemia dengan Suplemen Pangan Bekatul. Majalah Kedokteran Bandung. 2013; 45(1): 1-9.
CrossRef - Park Y., Park E., Kim E., Chung I. Hypocholesterolemic Metabolism of Dietary Red Pericarp Glutinous Rice Rich in Phenolic Compounds in Mice Fed a High Cholesterol Diet. Nutr Res Prac. 2014; 8(6): 632-637.
https://doi.org/10.4162/nrp.2014.8.6.632.
CrossRef - Wang O., Liu J., Cheng Q., Guo X., Wang Y., Zhao L., Zhou F., Ji B. Effects of Ferulic Acid and g-Oryzanol on High-Fat and HighFructose Diet-Induced Metabolic Syndrome in Rats. PLoS ONE. 2015; 10: 1-14.
CrossRef - Lecumberri E., Goya L., Mateos R., Alía M., Ramos S., Izquierdo-Pulido M., Bravo L. A Diet Rich in Dietary Fiber From Cocoa Improves Lipid Profile and Reduces Malondialdehyde in Hypercholesterolemic Rats. 2007; 23(4):332-41.
CrossRef - Bazzano L. Effects of Soluble Dietary Fiber on Low-Density Lipoprotein Cholesterol and Coronary Heart Disease Risk. Curr Atheroscler Rep. 2008; 10(6): 473-477.
CrossRef - Soliman G. A. Dietary Fiber, Atherosclerosis, and Cardiovascular Disease. 2019; 11(1155): 1-11.
CrossRef - Mishra A., Mishra N., Rao P. S. Preparation of Analogue Riceues Using Extrusion Technology. Int J Food Sci Technol. 2012; 47: 1789-1797.
CrossRef - Noviasari S., Kusnandar F., Budijanto S. Pengembangan Beras Analog dengan Memanfaatkan Jagung Putih. J Teknol Ind Pangan. 2013; 24: 195–201.
CrossRef - Kharisma T., Yuliana N. D., Budijanto S. The Effect of Coconut dregs flour (Cocos nucifera L) Addition to Cassava Based Analog Rice Characteristics. Presented at: The 16th Food Innovation Asia Conference. June 12-13, 2014; Thailand.
- Khairunnisa, K, Budijanto, S., Sitanggang, A.B. Formulation of High Protein Analogue rice Made of Cassava, Maize Starch, and Soybean. Presented at: The 24th Tri-University International Joint Seminar and Symposium 2017, Mie University, October 23-27, 2017; Japan.
- Noviasari S., Kusnandar F., Setiyono A., Budijanto, S. Beras Analog sebagai Pangan Fungsional dengan Indeks Glikemik Rendah. J Gizi Pangan. 2015; 10(3):225-232.
- Kurniawati M., Yuliana N. D., Budijanto S. The Effect of Single Screw Conveyor Stabilization on Free Fatty Acids, α-Tocoferol, and g-Oryzanol Content of Rice Bran. Int Food Res J. 2014; 21(3): 1201-1205.
- Randall J. , Sayre R. N., Schultz W. G., Fong R. Y. Mossman A. P., Tribelhorn R. E, Saunders R. M. Rice Bran Stabilization by Extrusion Cooking for Extraction of Edible Oil. J Food Sci. 1985;50(2):361-364.
CrossRef - Budijanto S., Purnomo, E.H., Sitanggang, A.B., Yulianti, Santika,S., Kharunia, A. 2017. Metode Pengoahan Beras Analog. Paten IDP000046720.
- Zou Y., Lu Y., Wei D. Hypocholesterolemic Effects of a Flavonoid-Rich Extract of Hypericum Perforatum L. in Rats Fed a Cholesterol-Rich Diet. J Agric Food Chem. 2005; 53: 2462-2466.
CrossRef - Reeves P. G., Nielsen F. H., Fahey G. C. AIN-93 Purified Diets for Laboratory Rodents: Final Report of The American Institute of Nutrition Ad Hoc Writing Committee on the Reformulation of the AIN-76A Rodent Diet. 1993; J Nutr. 123:1939-1951.
CrossRef - Association of Analytical Communities. Official Method of Analysis. AOAC. Inc, Washington DC, US; 2007.
- Xu Z., Godber J. S. Comparison of Supercritical Fluid and Solvent Extraction Methods in Extracting g-Oryzanol from Rice Bran. J Am Oil Chem Soc. 2000; 77(5):547-551.
CrossRef - Folch J., Less M., Stanley G. H. S. A Simple Method for the Isolation and Purification of Total Lipides from Animal Tissues. J Biol Chem. 1957; 226:497-509.
CrossRef - Ha T. Y., Han S., Kim S. R., Kim I. H., Lee H. Y., Kim H. K. Bioactive Components in Rice Bran Oil Improve Lipid Profiles in Rats Fed a High-Cholesterol Diet. Nutr Res. 2005; 25: 597-606.
CrossRef - Chawda G.,Jain S. S., Patel H. R., Chaduvula N., Patel K. The Relationship Between Serum Lipid Levels and the Risk of Oral Cancer. Indian J Med Paediatr Oncol. 2011; 32(1): 34–37.
CrossRef - Burstein M., Scholnick H. R., Morfin R. Rapid Method for the Isolation of Lipoproteins from Human Serum by Precipitation with Polyanions. J Lipid Res. 1970; 1: 583-595.
CrossRef - Sullivan D. , KrulJswlJk Z., West C. E., Kohlmeler M., Katan M. B. Determinationof Serum Triglyceridesby an Accurate Enzymatic Method Not Affected by Free Glycerol. Clin Chem. 1985; 31(7): 1227-1228.
CrossRef - Friedewald W. T., Levy R. I., Fredrickson D. S. Estimation of the Concentration of Low-Density Lipoprotein Cholesterol in Plasma, without Use of the Preparative Ultracentrifuge. Clin Chem. 1972; 18(6):499-502.
CrossRef - Faria S. A. S C., Bassinello P. Z., Penteado M. V. C. Nutritional Composition of Rice Bran Submitted to Different Stabilization Procedures. Brazilian J Pharm Sci. 2012; 48(4): 651-657.
CrossRef - Osfor M. M. H., Hegazy A., El-moaty M. A., Elmadbouly M. A., Afify R. A. M., Elbahnasawy A. S. M. Hypo-Cholesterolemic and Hypoglycemic Effects of Orange Albedo Powder (Citrus aurantium) on male albino rats. Int J Nutr Food Sci. 2013; 2:70-6.
CrossRef - Guo H., Yu W. Binding of Cholesterol and Bile Acid to Hemicelluloses from Rice Bran. Inter J Food Sci Nutr. 2013; 64(4): 461-466.
CrossRef - Son M. J., Rico C. W., Nam S. H., Kang M. Y. Influence of Oryzanol and Ferulic Acid on the Lipid Metabolism and Antioxidative Status in High Fat-Fed Mice. J Clin Biochem Nutr. 2010; 46: 150-156.
CrossRef
Accepted on: 22 April 2021
Second Review by: Samaila James Nigeria and Veenu Chandraker Nigeria
Final Approval by: Prof. Giovani Leone Zabot


Web of Science Coverage
Emerging Sources Citation Index (ESCI)
2024 Journal Impact Factor: 1.1
Scopus Journal Metrics
CiteScore 2025: 2.6
CiteScore Details
Sustainable Nutrition: Food Systems, Nutrient Retention, and Public Health Impact
![]()
This journal is a member of, and subscribes to the principles of, the Committee on Publication Ethics (COPE)


