Effect of Micronutrient Concentration on the Growth of Children in Central Highland of Ethiopia: Cluster Randomized Trial
Abebe Ferede Hailemiriam1*
and Muluemebet Abera Wordofa3 1Department of Public Health Arsi University, Asella, Ethiopia.
2Department Nutrition and Dietetics, Jimma University, Jimma, Ethiopia.
3Department of Population and Family Health, Jimma University, Jimma, Ethiopia.
Corresponding Author Email: abebeferede027@gmail.com
DOI : http://dx.doi.org/10.12944/CRNFSJ.10.1.30
Download this article as:
![]()
The objective of study designed to concur whether micronutrient concentration change reduces the high burden of growth defect of young children age 6 to 59 after nutrition behavior exertions end in Central highland Ethiopia. We used a cluster parallel, non-inferiority randomized control trial. “Kebeles” [lower administrations] selected from central highland districts randomly assigned to either the intervention or the control cluster. At the baseline survey, 1012 children aged 6-59 months and paired mothers were selected from randomly assigned kebeles using a systematic sampling method. The intervention cluster was appointed to exploit nutrition behavior intervention through 15 months. The baseline and end-line data contained median urine iodine, hemoglobin, anthropometry, and other variables analyzed using independent t-test and Generalized Estimate Equation (GEE) using SPSS version 21 software. At the end-line, about 715 study participants completed the nutrition Behavior Change Communication (BCC) intervention. A very high (42.1%) prevalent growth defect observed at baseline and reduced to high level (28.67%) at the end-line. Baseline iodine concentration by 0.69 cm (B=0.69, P less than 0.05) and end-line by 0.271 cm (B=0.271, P less than 0.05) somewhat increased average end-line height compared to iron concentration. The difference of height (Ht) baseline – end-line between intervention and control group was 0.51 cm. Being in the intervention cluster increased Ht by 10.8 cm (beta [β] = 10.8, standard error [SE] = 1.023) than other predictors of growth of children. This community-based study implied the need for efforts to improve the linear growth of children at an early age through inspiring nutrition behavior.
KEYWORDS:Behavior; Children; Cluster; Linear Growth; Micronutrient; Randomization
Introduction
The current magnitude of growth defect (stunting) among under-five age children is unacceptably high, mainly in Africa differently increased for more than three decades1. A child growth defect in Africa was unchanged and constantly high (33.5%) that is slightly higher than the South-East Asia region (32.8%) in 2019.2 However, the United Nations general assembly in May 2002 had developed more specific child nutrition goals to reduce child malnutrition among under five years by at least one-third (3). At the same time, the micronutrient goal was renewed that intended to achieve the sustainable elimination of iodine deficiency disorders by 2005 and reduce the prevalence of anemia/iron deficiency by one-third to meet millennium development goals (MDG) the year 2015.3 But, the high prevalence of various diseases associated with poor nutrition and the actual presence of estimated the low prevalence of micronutrient deficiency to meet the criterion growth of children is indecisive in Africa MDG.4 Necessarily, improving health and child growth will be delayed up to the next century due to the importance of the advances of iron and iodine nutrient elements in scientific knowledge.5
The nutrition challenge in Sub-Saharan Africa is home to some of the most nutritionally insecure people in the world with micronutrient deficiency is directly responsible in part for a region’s malnutrition burden.6 Iodine and iron deficiencies are the most significant cause of critical health and development of a much larger share and continue to be a public health concern.7,8 Subsequently, these micronutrient deficiencies potentially expose infants and young children to foremost cause of stunted growth at an early age. Also, the high proportion of these deficiencies found in the developing world that impairs the physical child growth and children learning ability during school age and at adult time limits productivity and ultimately perpetuates poverty.9
Besides interpersonal expectations, socio-cultural behavior are the primary obstacles to improving community health. Because replacing and modifying the traditional knowledge and attitude by newly learning behaviors requires a potential public health effort.10 Infant and young child nutrition knowledge-attitude improved with nutrition BCC. Also, it has an opinion on the sustainable behavior change effect in the community.11 Many communities and individuals, especially woman has already understood what they need to do to reduce health risk than men.12 However, the illiteracy status of women in the developing world is high and challenged for knowledge-attitude transformation to them.12, 13
In Ethiopia, now the stunting growth of children has not become low14 and although the country has 63% of women are illiterate.13From our experience, the community would not acknowledge the need for new knowledge and attitude to replace the old dietary intake of children by the uncomplicated and inexpensive method than targeting individual nutrient supplementations. Such challenge arises from the community that has a high illiterate proportion population.
Therefore, nutrition-behavior change is critically important in a community where the uneducated population is high to referee defect growth in children through the dietary intake of micronutrients. In advance, nutritional behavior unforgotten foundation for future dietary intake of the community.10,11,12 Particularly, in Ethiopia, there is no implemented community-based interventional study to reduce micronutrient deficiency and associated growth defect of the children. This study designed and implemented nutrition-behavior intervention for mothers/caregivers to prevent the highest risk of trace element deficiencies and condenses linear growth defect of young children to low through dietary intake behavior change. Behavior communication change of dietary intake is further necessary in a community where illiteracy is steadily higher.
Materials and Methods
Study Area and Period
The study area was mountainous and has a high range of rainfall. It was found in the middle part of Ethiopia. It included the districts near Arsi and the parts of Bale plateaus. The period of nutrition-behavior intervention study had stayed for 15 months.
Study Design
Community Cluster-based Randomized Control Trial (CRCT) was used to implement nutrition BCC.
Sample Size
Gpower 3.0 software was used to determine the sample size of the study. The sample size was established using the assumption of precision of 5%, a power of 95%, and an effect size of 0.25. Plus, 11% = 95 to compensate loss to follow-up. Where the design effect had 10% =83 and the final estimated sample size was 1012.
Random Assignment of Kebeles into Clusters (Randomization)
Sequence generation: the districts were particularly the highlands of Tiyo, Lemu, Bilalo, Digelu-Tijo from the rural, and Asella -1 and Asella-2, Bkoji, and Sagure from urban districts referred to basic sources of 202 kebeles. Two kebeles were randomly selected from each selected district and the sum was 16 kebeles. Emergency Nutritional Assessment (ENA) computer software was applied to allocate the sixteen kebeles randomly either to the control or intervention group with an equal allocation ratio.
Cluster Masking
Community-based trials require cluster masking to maintain behavior information to the intervention cluster and enclose the control.15 Selection of a few kebeles from the high figure of kebeles provided sufficient protection for the nutrition behavior information from contamination with the control.
Eligibility
Participants were 1,012 children aged 6 to 59 months with pair mothers/caregivers selected proportionate numbers from all randomly assigned kebeles. A total of 506 study participants were selected from each cluster (Figure 1).
Behavior Change Intervention Strategy
This study developed from existing information and baseline survey findings. Growth defect and micronutrient deficiencies increased during complementary foods initiation and often coinciding with decreased breast milk consumption.11,12 Poor access to nutritious diet and essential services escort insufficient the feeding and dietary practices to assure the growth of children. Household food sources to be self-possessed efficient for chid feed, nutrition BCC is compulsory for persons whom directly responsive.12
Principles and Approaches of BCC
Child nutrition program in community directed at baseline included right foundation, child-focused and direct-response of the mother/caregiver specific approach to micronutrient deficiencies and chid growth defect.
Advance in advocacy and communication through analysis of barriers through the specified context of nutrition BCC to change the dietary intake of children to improve their micronutrient concentration successively effects on their linear growth after fifteen months.
Program Implementation
Specific communications strategies applied the messages and audience, communications materials used such as pictures, leaflets and posters.
Nutrition behavior intervention was provided for mothers/caregivers who have included only for the intervention cluster. Various activities contained in the intervention spotted to improve child nutrition and adopted rigorous infant and young child feeding practices and dietary diversity.
This project was concerned about micronutrient-rich dietary intake of their children, Purposely two health extension workers (HEW) permanently assigned in each Kebele had been trained to carry out intervention approaches. These trained HEW had assisted child feeding activities and provision of a program demonstration and visiting. On the adoption of food for children certainly contained the production of micronutrient-rich fruits, vegetables, germinated cereal crop, animal products and exploitation of iodized salt.
Follow-up: participants who completed the behavior treatment in the intervention group were 406; those who did not complete treatment were 100. Although 309 participants in the control had completed their follow-up, 197 did not. After several months of intervention follow-up, children who not complete their follow-up due to their age became not eligible. In the final survey, about 715 participants were included, 406 from the intervention group and 309 from the control group. However, the study primarily proposed to select a high (50.20%) proportion of children age < 24 months at the baseline, accordingly the intervention group conceded more than 51% (Figure 1).
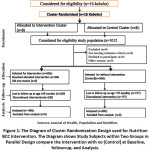 |
Figure 1: The Diagram of Cluster Randomization Design used for Nutrition BCC Intervention. |
Measurements
Anthropometry Measurements
Ht and weight (Wt) of the children were measured according to standard procedures recommended by the World Health Organization (WHO).16 Wt of children age < 2 years measured using hanging spring. Also, the Wt of children age two years and above was measured with a digital scale. A stadiometer tool was used to measure the Ht of children age 24 months and above. Although, the length of children ages less than 24 months were measured with the recumbent position. The reading of Wt and Ht were made to the nearest 0.1 kg and 0.1 cm, respectively.16 These readings were applied for the final analyses from the average figure of two independent observers.
Urine Analysis for Iodine
Samples of urine had been taken from children and collected with great precaution during the period of baseline and end-line survey. Consequently, collected urine samples were transported to the Ethiopian Public Health Institute for iodine analysis using ammonium persulfate. All of the World Health Organization recommendations and requirements were applied for the urine sample analysis.17
The WHO reference was applied to determine median UIC. UIC=100μg/L used for the cut-off value of iodine adequacy, and substantially the higher is adequate.18 Also, the inadequacy of iodine further classified into insufficient (50 to 99 μg/L) and severe iodine deficiency (<50μg/L).18
Hemoglobin
Mothers/caregivers were informed about the required blood sample before the blood sample collection from the children. All concerned precautions are applied to maintain a safe finger prick at the child’s finger to lessen the risks of injury. Each child’s blood sample was collected at the baseline and end-line surveys by trained laboratory technologists. The HemoCue Hb 301® analyzer was used to determine Hemoglobin concentration (Hbc). Before data analysis, each study subject’s Hbc adjusted for altitude. The Hbc considered no anemia at Hbc >110 g/L, anemic (Hbc < 110 g/L) as iron deficiency anemia (IDA), and clinical anemia observed with Hbc<70 g/L.19
Statistical Analysis
EpiData 3.0 software was used for data entry and transferred to the SPSS (Statistical Package for Social Science statistical) software for Windows, version 21. Anthropometric data was exported from SPSS to the Emergency Nutrition Assessment (ENA) software to establish to measure Ht for Age (HFA), Wt for Ht (WFH) and Wt for age (WFA) compare with the WHO standard Z-score. The cut-off for normal growth is Z-score = HFA ≥ -2 and growth defect indicated as z-score = HFA < −2. The classification of linear growth of child population has referred the prevalence is very high at > 40% and a high prevalence at 30 to 39% and a medium 20 to 29%.20 Also, WFH z-score was generated to determine to waste among children.16, 17 The wasting level in child population referred with very low < 2.5%, high 10 to <15%, and very high >15%.20
The mean end-line-baseline differences in micronutrient concentration were compared between intervention and control groups. The mean differences between the intervention and the control groups and other variables differences end-line – baseline were compared using independent samples t-test and variables that had P < 0.25 transferred to GEE for further prediction,21 and interpreted using Beta coefficients (β) and 95% confidence intervals. To detect bias, particularly in data analysis, primary mean differences in relation to variables were reported after being confirmed with GEE analysis. This study’s raw data were separately published before appraisal thesis writing.
Results
Socio-Demographic Characters of Study Subjects
There were a low (23.77%) proportion of mothers/caregivers who had completed their higher education, but 56.6% of them were at the age of 20 – 35 years. The annual income of the households was mainly found within the range of 1,000-5,000 Ethiopian Birr (Table 1).
Table 1: Socio-demographic Status of Mothers/Caregivers in Central Highland of Ethiopia.
| Variables | Frequency n=715 end-line) | Percent |
| Maternal Age | ||
| Age <20 | 119 | 16.64 |
| Age 20-35 | 403 | 56.36 |
| Age>35 | 193 | 27 |
| Education Levels | ||
| Illiterate | 156 | 21.81 |
| Grade 1-4 | 146 | 20.42 |
| Grade 5-8 | 243 | 34 |
| Grade 9-12 | 170 | 23.77 |
| Occupation | ||
| Housewife | 416 | 58.18 |
| Farmer | 204 | 28.54 |
| Businesswomen | 46 | 6.43 |
| Gov/NGO employee | 7 | 0.98 |
| Daily laborer | 42 | 5.87 |
| Annual income (Birr) | ||
| <1000 | 150 | 20.98 |
| 1000-5,000 | 446 | 62.38 |
| 5001-10,000 | 90 | 12.59 |
| >10,000 | 29 | 3.56 |
Gov, Government; NGO, Nene government organization;
n, sample at end-line
Children Growth
The mean height of children at baseline was 81.16 cm + 13.6 and increased to 97.3 cm + 13.8. In our finding, the growth defect was 42.1% [n = 426] at baseline which is a very high burden and became high (28.67%) after the intervention that contributed the sum of 30% growth defect condensed. At baseline, the growth defect burden was high (36, 76 %, n = 186) among the intervention group and reduced to very low (10.28%) at the end-line surveys. The total growth defect among children in the intervention group was reduced by 72%.
The prevalence of growth defect in the control group was very high (47.43%) at the baseline and extent by 4.4% to 49.51% at the end-line (Table 2).
Similarly, the prevalence of wasting = WFH < -2z-score among study participants at baseline was described as very high (30.53%) according to WHO justification.20 Wasting among the intervention group was 33% and, among the control groups was 28.06%. At the end-line survey, the prevalence of wasted children among the intervention group had become at medium (8.97%) that reduced by the72.8%. But, among the control group increased by 28.6% raised at a very high prevalence (36.04%).
Regarding UIC, from 812 children urine samples collected at the baseline survey. The biochemical test results showed that the median UIC was 107.7 μg/L with confidence interval (CI) = 107.30 – 108.34). At the end-line from 175 children urine samples analysed and median UIC was 209.9 μg/L (CI = 188.72 – 231.0) that increased by more than 95%. At baseline, iodine deficiency (ID) among study subjects was 11.8% (n=96) and reduced to 6.15% at the end-line that the prevalence of ID declined by 50%. At the end-line, iodine deficiency among the intervention group was decreased by 76% from 14.29% to 3.45%), while the control group was increased the Iodine deficiency prevalence by 3.72% to 9.71% end-line. The Iodine nutrient (median UIC >100] sufficiency among children increased to 88.2% at the endpoint of the intervention, but 96.55% of the intervention group had met their requirement of iodine nutrient. The marginal inadequacy of iodine [UIC < 50 µg/l] absolutely not been observed (Table 2).
On the subject of iron nutrient, at the end-line survey, the mean Hbc among study subjects increased by more than 12% to 143 g/L + 1.6 compared to the baseline survey. At the baseline survey, the magnitude of IDA reported higher (21.74) among the intervention group than the control group (14.63%). Nevertheless, this prevalence of IDA among the intervention group lowered to 10.34% which was reduced by more than two times (59.56%) compared to the baseline finding (Table 2).
Table 2: Study Subjects Across Intervention and Control Clustered Groups During Baseline and End-Line Survey, in Central Highland of Ethiopia.
| Baseline Survey, n=1012 | End Line Survey, n=715 | |
| Variables | Intervention Control | Intervention Control |
| n=506 [%] n=506[%] | n=406[%] n=309 [%] | |
| Age | ||
| > 24 Months | 246 (48.62) 258(51.00) | 332(65.61) 246(79.62) |
| < 24 Months | 260 (51.38) 248(49.00) | 174(34.39) 63(26.58) |
| Sex | ||
| Male | 263(51.98) 276(45.64) | 268 (52.96) 148(47.90) |
| Female | 243(48.02) 230(40.80) | 238(47.04) 161(52.10) |
| HAZ | ||
| > -2SD | 288(56.92) 298(58.89) | 354 (87.19) 156(50.49) |
| < -2SD | 218(43.08) 208(41.11) | 52(12.81) 153(49.51) |
| WHZ | ||
| > -2SD | 445(87.95) 458(90.51) | 370(91.13) 210(67.96) |
| < -2SD | 61(12.05) 48(9.49) | 36(8.97) 99(36.04) |
| WAZ | ||
| > -2SD | 428(84.58) 420(83.00) | 473(93.48) 141(45.63) |
| < -2SD | 78(15.42) 86(17.00) | 33(6.52) 168(68.57) |
| Hbc | ||
| >110 g/L | 375(78.26) 432(85.37) | 364(89.66) 263 (85.11) |
| <110 g/L | 110(21.74) 74(14.63) | 42(10.34) 46(14.89) |
| UIC, N=812 | ||
| >100μg/L | 348(85.71) 368(90.64) | 392(96.55) 279(90.29) |
| <100μg/L | 58(14.29) 38(9.36) | 14(3.45) 30(9.71) |
HBC, Hemoglobin Concentration; HAZ, Height for Age Z-Score; Median UIC, Median Urine Iodine Concentration; n, Number of study subjects, N, urine samples for Median UIC; WAZ, Weight for Age Z-Score; WHZ, weight for Height Z-Score.
In the baseline, the growth of children (HFA) was analyzed with the WHO standard curve that showed a very high proportion of study subjects found away from the -2SD and severe growth defected (< – 3SD) remarked (Figure 2).
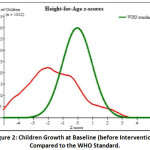 |
Figure 2: Children Growth at Baseline (Before Intervention) Compared to the WHO Standard. |
Although, growth of children improvement observed on WHO growth curve and more growth of children found at > – 2SD at the endpoint survey of 2020. This growth curve can be interpreted that half of children’s growth is found in the range of normal standard division (-2 to + 4), but near to half of children’s growth negatively resides far from WHO standard. Therefore, the proportion defected growth of children observed markedly unacceptable compared to the WHO growth curve standard (Figure 3).
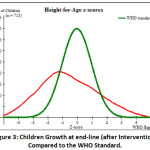 |
Figure 3: Children’s Growth at end-line (after Intervention) Compared to the WHO Standard. |
Determents of Iodine and Iron on end-line – Baseline Ht Difference
The current interventional study reported that the mean end-line-baseline Ht difference among the intervention group was very high (Ht MD = 14.014cm, SE=1.13) contrasted with the control group. The mean Ht difference predicted only by end-line UIC (Ht MD = 5.443cm, SE =2.5) compared to the baseline UIC and Hbc. These findings further compressively analysed with GEE.
Determents of Iodine and Iron on end-line – Baseline Ht Difference with GEE
Variables that had P < 0.25 in the analysis of independent samples t-test reanalyzed with GEE. This progressive analysis clearout the interventional study impact on the linear growth of children. From this analysis, the intervention group had noticeably increased Ht with 10.8 cm (β =10.8, P < 0.001). Also, the end-line UIC effect on Mean Ht difference on the t-independent test once more had significantly predicted in the EGG analysis in that, the end-line UIC increased by 1 µg/l changes Ht near 1.27 cm (β =1.27, P < 0.001). Also, children who had follow-up growth monitoring in the health facility had higher end-line height by 2.214 cm [β =2.291, P < 0.017] than the counters. Complimentary food introduction at the time of 6months had increased the height of children significantly (β =32, P = 0.001) that children who started their food near the early or late of 6month, in addition, their breastfeed (Table 5).
Table 5: Multivariable GEE Analysis for the end-line Height of Children Age 6 to 59 Months, in Central Highland of Ethiopia.
| Model | 95% CI | ||||
| β | Std. Error | Lower | Upper | P | |
| Intervention | 10.802 | 1.0225 | 8.798 | 12.806 | <.0001 |
| Sex=female | -.687 | .8908 | -2.433 | 1.059 | .441 |
| Growth Monitoring | 2.291 | .9560 | .417 | 4.165 | .017 |
| Bottle feeding | -.020 | 1.0013 | -1.983 | 1.942 | .984 |
| Baseline HBC | .086 | .0257 | .035 | .136 | .001 |
| End-line HBC | 0.268 | 1.7351 | 0.009 | 8.021 | 0.447 |
| Baseline UIC | -.066 | .0554 | -.175 | .043 | .235 |
| UIC end-line | 1.27 | 0.057 | 1.133 | 1.414 | 0.000 |
| Baseline HFAZ | .490 | .210 | .078 | .896 | .019 |
| Baseline WFHZ | -.620 | .2647 | -1.138 | -.101 | .019 |
| Household income | .000 | .0002 | -7.449 | .001 | .113 |
| Breastfeeding in months | .175 | .0599 | .058 | .293 | .003 |
| Comp. food int. time | 32 | 1.46 | 16.31 | 59.12 | 0.000 |
| Education Level | .101 | .1312 | -.156 | .358 | .442 |
| Age(months) | .204 | .0365 | .133 | .276 | <.0001 |
β, Beta coefficients; BF, Breastfeeding; CI, confident interval; Comp. food int., Complementary food initiation; IDA, Iron deficiency anemia; Hbc, Hemoglobin Concentration; HAZ, Height for Age Z-Score; MUIC, Median Urine Iodine Concentration; UIC>100, Iodine sufficiency; WAZ, Weight for Age Z-Score; WHZ, weight for Height Z-Score.
Discussions
This study inspired first to investigate the relationship between children under five years and their micronutrient concentration concerning their dietary intake and linear growth in Central Highland of Ethiopia. This appraisal thesis painted the constructive effect of nutrition BCC on a change of very high prevalence of linear growth defect condensed to medium (28.67%). Also, the iron and iodine status of children highly improved these nutrients deficiencies reduced to mild prevalence which is comparative to developed world status.22 But, only iodine concentration had an imperceptibly significant association with the linear growth of children further than baseline Ht and age. Children in the intervention group had met an opportunity to improve their gross dietary intake that had probably shown a significant growth change beyond the concentration of these micronutrients. Consequently, to reduce the burden of defected growth of young children that cause trouble in their future life needs focused urgent and broad alternative and collaborative intervention.
Growth defect is a chronically developed nutritional problem during fetal development or early life of infancy. Also, micronutrient deficiency during early age can affect children’s growth that would not be reversed into the standard in a short intervention time.23 However, our nutrition BCC intervention showed the possibility of driving the growth defect decline even substandard. The excretion of the reduction of malnutrition in the future, the World Health assembly in 2012 reached an agreement on micronutrient deficiencies to achieve the goal by 2030. These agendas have declared the need for rapid global action to end all forms of malnutrition and leave no one behind, which appearance the complete control and prevention of malnutrition and micronutrient deficiency disorder.24
In Africa, stunting growth is pragmatically higher, also has no significant changes reported2 due to the lack of transformed knowledge and attitude in the household towards dietary diversity intake of children in their complementary food.4 The challenge from food insecurity stands too low made dietary inadequacy, poor quality, fewer food types available, are laid a foundation in Africa.25 These upset conditions can drive children into poor growth and deficient with more health-dominant micronutrients.9 The impoverished region in food and resources becomes the most possessor of the higher burden of children with poor growth.8 As such, African children have facing differently with malnutrition and micronutrient deficiency. These nutritional problems have interwoven and simultaneously operated from one to other to affect children’s growth and development.25
Conclusions
In appraisal thesis summary, iodine and iron increased at maximum intervention cluster. Mean difference of these micronutrient concentrations from end-line to baseline among intervention and control groups highly scored. Those children included in the intervention group increased their linear growth by 10.8 cm compared to the control group. Although, the baseline Ht, Hbc, HFA, WFH, growth mentoring follow up and breastfeeding were significantly associated with the linear growth of children.
This interventional research affirms findings that conducting nutrition BCC intervention following the assessment of knowledge and attitude of mothers/caregivers and micronutrient concentration to prevent micronutrient deficiency and promote child growth at an early age. The behaviour change intervention significantly promoted the diversified dietary intake of the children. Subsequently facilitates in reducing the high burden of defected linear growth besides micronutrients deficiency. It also revealed the disadvantages had seen among the children population in the control group. Though a positive effect at baseline, the children from these mothers/caregivers in the intervention group did catch up in growth and potential showed a statistically significant difference from that of children from index mothers/ caregivers who did not participate in nutrition BCC intervention.
The Following Conclusions are Provided Based on the Findings:
The low education level of the mother/caregiver and low annual income of the household was momentous to impeded knowledge of women in the prevention of poor growth of children. Having better Ht and UIC at baseline increased linear growth of children, Children in the intervention group increased UIC mean difference and marked change in their height observed in the intervention group.
This nutrition BCC intervention had provided a sustainable knowledge attitude and a transformation of approach to establish a long-term effect in dietary intake of children in the community. It sets a foundation for the future impediment of micronutrient deficiency and the child linear growth improvement.
Recommendation
To address the underprivileged knowledge attitude of mothers/caregivers on their children dietary intake that affects their children linear growth in Central Highland of Ethiopia: The following provided recommendations take into consideration:-
To estimate the linear growth of children and a proxy predictor of children population at greatest of future growth development risk shall be used conclusive index measurement. Unrecognized (unusual) mothers/caregivers should be targeted for both behaviors more comprehensively (like regional or national) rather than in a fragmented manner. The existing health care services shall continuously scale up the prevention of young children from growth failures via nutrition behavior change. Young child dietary intake in developing world needs qualified assessments, and adequate supervision, support, and training of health care providers on nutrition behavior change are mandatory to monitor to fill the existing knowledge and attitude gap for child nutrition. Include nutrition behavior concerning child nutrition in the regular health care system to reduce the disparities knowledge attitude problem of mothers/caregivers. Therefore, community-based intervention critically addresses a high population number within scarce resources to reduce the high burden of child undernutrition and growth defect.
Strength and Limitation
A high proportion (>50%) of children aged less than 24 months was included in the study, and more of them were found in the intervention group. Some of the children’s ages became more than 59 months excluded from the study during their follow-up and more from the control group. However, the current data were efficient to compare the effect of nutrition behavior intervention among the two parallel groups.
Acknowledgments
The first line of our thanks addresses Jimma University for its fundraising for this interventional study. Plus, our thanks remark to the Ethiopian Public health Institute for facilitating and urine specimens analysis for this study. Our special appreciation addresses Arsi Zone administrative offices and Zone Health Department for their assistance and cooperation at the time of data collection and intervention periods. Finally, we the authors thank the Health Extension Worker of 16 kebeles and study participants. As well as our thanks to eight districts health officer heads for their involvement in the study.
Conflicts of Interest Consent and Ethical Issues
Our research project work: had been obtained ethics approval from the intuitional Review Ethics Board (IRB) of Jimma University before engaging into our work. The reference number ethics approval is IHRPGD/3007/18 on January 01, 2018 (Statement copy available).
Consent
Our data and sample collection started after informed consent was obtained from each mother/guardian. Informed consent for each child was obtained from the child’s mothers/caregivers. Each mother/caregiver was informed about the need for her voluntary and free participation in the study. There was a settled opportunity of equal option for each study participant and the possibility of refusing at any time and any reason without any penalty.
Authorships
- A Ferede participated in the research project design, receive grant and finance management; supervise data collection processes and implementation of the intervention, data analysis, manuscript draft writing, and final edition.
- T Belachew participated in the design of the research project; supervise data collection processes and implementation of the intervention, data analysis, manuscript draft writing, and final edition.
- M Abera participated in the design of the research project; supervise data collection processes and implementation of the intervention, data analysis, manuscript draft writing, and final edition.
Funding Source
Jimma University postgraduate office provided grant only for project work S. No: IHRPGD/3022/2018. But, we did not receive finical support from other organizations for the publication of this article.
Conflicts of Interest
We declare no Conflicts of interest. The interest of all authors, reviewers, editors, journal CRNFS and publishers will be maintained.
References
- Development Initiatives. 2018 Global Nutrition Report. North Quay House, UK: Development Initiatives Poverty Research Ltd. 2018. p.161/ 2018 report/ 978-0-9926821-9-4.
- United Nations Children’s Fund (UNICEF). UNICEF, WHO, World Bank. Levels and trends in child malnutrition. New York, Geneva, Washington DC: UNICEF / WHO / World Bank Group Joint; 2020. p.16 / the 2020 edition/ 978-92-4-000358-3.
- UNICEF. A World Fit for Children, millennium development goals special session on children documents, the convention on the rights of the child. New York: UNICEF; 2002. 108 p.
- Robert E.B., Cesar G.V., Susan P.W., Zulfiqar A.B., Parul C., Mercedes D., et al. Maternal and child undernutrition and overweight in low-income and middle-income countries. 2013; 382(9890): 427–451.
CrossRef - Ted T. Micronutrient Deficiency Conditions: Global Health Issues. Public Health Reviews. 2010; 32(1): 243-255.
CrossRef - Jessica F. The Nutrition Challenge in Sub-Saharan Africa. WP 2012-012. 472/a, 00057, Rome, Italy: United Nations development Programme;
- UNICEF. Nearly 19 million newborns at risk of brain damage every year due to iodine deficiency. New York: UNICEF; 2018. Press release. https://www. unicef.org/rosa/ press-releases/ nearly-19-million-newborns-risk-brain-damage-every-year-due. 01 March 2018. Accessed 14 June 2019.
- Lawrence H.,Endang , Mohamed A.B., Arti A., Komal B., Zulfiqar B., Monika B., Elaine B., et al. The Global Nutrition Report 2014: actions and accountability to accelerate the world’s progress on nutrition. The Journal of Nutrition. 145(4) : 663–671.
- Jason C. 2018 Global Nutrition Report. Washington, DC: International Food Policy Research Institute; 2018. p.150 / 2018 report/978-0-89629-297-0.
- Jenkins C. D. Building better health: a handbook for behavioral change. Scientific and Technical Publication No. 590. 92 75-11590 7. Washington D.C: Pan American Health Organization; 2003.
- John H., Akhter A., Naureen I.K., Shalini R. Nutrition behaviour change communication causes sustained effects on IYCN knowledge in two cluster randomised trials in Bangladesh. Matern Child Nutr. 2018; 14(1): e12498.
CrossRef - Rachel S. N., Rene L., Robert J.C., Valerie C., Ibrahim E., Gerda I.F., Cheryl H., Marti V. L., Lowe C.F., Gert W.M., Pradeep B.V., Reddy K.S., Myriam S., Ricardo U. Behaviour change for better health: nutrition, hygiene and sustainability. BMC Public Health. 2013; 13 (1); 01 – 13.
CrossRef - The United Nations Educational, Scientific and Cultural Organization (UNESCO). Literacy rates continue to rise from one generation to the next. Montreal, Quebec Canada: UNESCO Institute for Statistics; 2017. p. 15 / Fact Sheet No. 45 / FS/2017/LIT/45.
- Ethiopian Public Health Institute. ETHIOPIA Mini Demographic and Health Survey 2019. Addis Ababa: Ethiopian Public Health Institute; 2021. p. 85 – 92. 2019 EMDHS.
- Arthur E., Pol D.G. Buffer zones and their management policy and best practices for terrestrial ecosystems in developing countries. 1568-2374, Series 5 Wageningen, Netherlands. National Reference Centre for Nature Management.
- Mercedes D.O., Monika B. Global Database on Child Growth and Malnutrition. Geneva, Netherlands: World Health Organization; 1997. p. 72/ WHO/NUT/97.4.
- World Health Organization (WHO). Assessment of iodine deficiency disorders and monitoring a guide for programme managers. Geneva, Switzerland: WHO; 2007. p. 108/Third edition/ WHO/NUT/94.6.
- World Health Organization. Assessment of iodine deficiency disorders and monitoring their Elimination, a guide for programme managers. Geneva, Switzerland: WHO; 2001. p. 124/Second edition (doc WHO/NUT/94.6) / WHO/NHD/01.1.
- Vitamin and Mineral Nutrition Information System VMNIS. Haemoglobin concentrations for the diagnosis of anaemia. Geneva, Switzerland: WHO; p.06/ WHO/NMH /NHD /MNM/11.1.
- Institutional repository for information sharing (IRIS). Physical status: the use and interpretation of anthropometry. Geneva, Switzerland: WHO; 1995. p. / 9241208546/ WHO technical report series ; 854.
- Sabine L, Brian SE. A Handbook of Statistical Analyses using SPSS. Government works international standard. 1-58488-369-3. New York: CRC press; 2003: p.339. crcpress.com. Accessed 15 Jan. 2015.
- Tyler V., Nadia A.,Selai A., Ahalya S., Marianne S., Zulfiqar A.B. Stunting in childhood: an overview of global burden, trends, determinants, and drivers of decline Am J Clin Nutr. 2020; 112 (2): 777S–791S.
CrossRef - UNICEF. Core Commitments for Children in Humanitarian. New York, USA: UNICEF; 2020. p.149 / 978-92-806-5179-9/ NY 10017.
- Nutrition International. NI Strategic Plan 2018 – 2024 – Nutrition International. Ottawa, Ontario, Canada: Nutrition International; 2017. p.64. nutritionintl.org/strategy. Accessed 22 Jun. 2015.
- Mbalenhle M., Melusi S. A Review of Selected Studies on the Factors Associated with the Nutrition Status of Children Under the Age of Five Years in South Africa. J. Environ. Res. Public Health. 2020; 17(21):7947-7973.
CrossRef
Accepted on: 24 Jan 2022
Second Review by: Luzviminda Rivera Philippines and Edhi Nurhartadi Indonesia
Final Approval by: Prof Quazi Syed Zahir Uddin


Web of Science Coverage
Emerging Sources Citation Index (ESCI)
2024 Journal Impact Factor: 1.1
Scopus Journal Metrics
CiteScore 2025: 2.6
CiteScore Details
Sustainable Nutrition: Food Systems, Nutrient Retention, and Public Health Impact
![]()
This journal is a member of, and subscribes to the principles of, the Committee on Publication Ethics (COPE)


