

Introduction
Body composition measurements are quantitative methods of nutritional assessment in humans. Understanding of body composition is also crucial for health professionals. Body composition analysis (BCA) provides an insight to nutritional status, functional capacity of the human being, in formulating nutritional management and for observing of therapeutic nutrition intervention1,2,3. The growing popularity of physical activity for enhancing health and fitness has sharpened the health care professional’s perspective on techniques for evaluating the body composition4. When there is a difference between nutrient intake and requirement, body composition fluctuates. Thus, in order to achieve various goals, health care professionals need precise measurements for BCA. Numerous techniques are available for BCA, ranging from simple indirect methods to complex direct volumetric measurements. All methods for BCA vary in their precision and accuracy1.
Body mass index (BMI) is easy tool to be used in the clinical set-ups, observational studies or epidemiological studies. However, the association between BMI and body fat percentage differs in Indians5. It is fundamental to the precise categorization of the body fat and BMI relationship which is the correct estimation of total body fat. Simplest methods to use in the field (clinical set-up or research at community level) is the 2 compartment (2C) model methods – fat and fat free mass (FFM). Two methods namely anthropometric measurements (multiple skinfold thickness) and bioelectrical impedance are based on 2C model5. The question arises that whether skinfold thickness (SFT) measurements and body fat percentages from BIA tend to over-estimate or underestimate each other.
The aim of this study was to compare body fat percentage obtained using four-site skinfold thickness (SFT) measurement with bioelectrical impedance analysis (BIA) of young women.
Materials and Methods
This report is a part of the PMS study which investigated association of premenstrual syndrome with various lifestyle factors among young women. This study has received approval from Research Advisory Committee and Independent Ethics Committee of the University (SIU/IEC/02-12-2015). The cross-sectional study was carried out among young women studying at the University. Study objectives were explained to the willing participants and informed consent was obtained prior to the enrolment. The inclusion criteria consisted of female students from the university between the age group of 18-25 years and unmarried. Students suffering from any disease such as diabetes mellitus, hypertension, polycystic ovarian syndrome, any organ related disease and those taking any hormonal therapy or medications were excluded from the study.
All measurements of a participant were taken on the same day during morning slots. Participants were asked to avoid eating anything or drinking water at least 8 hours before the measurements and refrained from the exercising for at least 12 hours before the measurements.
Anthropometric measurements: Height was measured using a stature meter (Seca-213 portable stadiometer, SECA, Germany). Participants were asked to stand at stature meter without shoes and head kept in the Frankfurt plane. Height was noted to the nearest 0.1 cm. Weight was measured by a digital weighing scale (TANITA HD380, Kosmochem Pvt Ltd.). Participants were weighed with minimal / light clothing and without footwears. Basic Metabolic Rate (BMI) was calculated using the standard Quetlet’s formula and participants were categorized into various BMI categories. A non-stretchable tape (Seca-201 girth measurement tape, SECA, Germany) was used for the measurement of mid-upper arm circumference, waist, and hip circumferences. Waist was measured at midpoint between lower rib cage and iliac crest, whereas hip circumference was measured at level of maximum extension of buttocks. Waist to hip ratio (WHR) was calculated6. Skinfold thickness (SFT) were measured at 4-sites including triceps, bicep, subscapular and suprailiac region. SFTs were measured using the Harpenden skinfold caliper (Baty International & Co., UK) and readings were recorded at nearest 0.2 mm. Durnin and Womersley equation was used to measure the body density using sum of skinfolds. Siri’s equation was used to compute body fat percentage from body density7.
Bioelectrical Impedance: Body composition analysis was done using body composition analyzer (TANITA BC-601, Kosmochem Pvt Ltd.). The analyzer principle states the use of advanced bioelectrical impedance (BIA) technology. The body is modeled as five cylindrical compartments, the trunk and the four limbs, whereas fat is the insulator. When a participant stands on TANITA monitor it passes safe electric signal by electrodes through feet to legs, arm and abdomen, this electrical signal passes through water and meets resistance/impedance where it meets fat tissue. The impedance is believed to be in proportion to the height and inversely proportional to the cross-sectional area of each compartment. The resistance, which is known as impendence, was measured8. Total body fat percentage, total body water, muscle mass, mineral mass and visceral fat was recorded.
Statistical Analysis
Statistical analysis was carried out in SPSS software v. 23.0. Analysis was reported based on the STROBE guidelines9. Descriptive statistics was used to represent the data. Pearson’s correlation was used to test the linear relationship between variables. The Bland-Altman plot/analysis was performed to compare between the studied methods of BCA. The bias and limits of agreement (mean difference ±3SD) were calculated by using mean and standard deviations of the difference between body fat percentages obtained from SFT and BIA10. Linear regression was used to study the association between body fat percentages obtained and its contributing factor (anthropometric measurements and impedance values). The data was considered significant if p <0.05.
Results
In total 310 female students participated in the study. Participant’s mean age was 20.14±1.24 years. About 176 (57 %) were pursuing undergraduate degree and 134 (43%) were studying at post-graduation degree. Mean height and weight of the participants was 154.2±5.64 cm and 52.9±12.53 kg respectively. Their mean BMI was 22.2±5.05 kg/m2.
Table 1: Anthropometric Measurements and Body Composition Parameters.
| Measurement | Mean (SD) | Range |
| Anthropometric measurements | ||
| Height (cm) | 154.2±5.56 | 143 – 168 |
| Weight (kg) | 52.97±12.38 | 31 – 94.5 |
| BMI (kg/m2) | 22.2±5.05 | 14.24 – 37.28 |
| Waist circumference (cm) | 75.04±10.9 | 52 – 106 |
| Hip circumference (cm) | 94.42±9.14 | 74 – 114.6 |
| Mid-upper-arm circumference (cm) | 25.68±4.26 | 18.2 – 39.2 |
| Tricep skinfold (mm) | 16.85±5.77 | 5.4 – 31.0 |
| Bicep skinfold (mm) | 9.11±4.22 | 2.8 – 21.4 |
| Subscapular skinfold (mm) | 21.28±8.18 | 7.6 – 38.2 |
| Suprailiac skinfold (mm) | 32.33±9.19 | 10.0 – 45.0 |
| Sum of skinfolds (mm) | 79.59±24.56 | 28.8 – 131.6 |
| Estimated body fat percentage (%) | 32.79±5.048 | 19.08 – 41.1 |
| Body composition parameters using BIA | ||
| Body fat percentage (%) | 33.85±5.32 | 18.20 – 51.6 |
| Total body water (%) | 49.04±4.26 | 37.6-61.8 |
| Muscle mass (kg) | 37.31±4.27 | 29.9 – 44.1 |
| Visceral fat (%) | 4.41±1.77 | 1 – 12 |
Table 1 describes details of all parameters measured for assessment of body composition. Mean BMI (22.25±5.01 Kg/m2) was under normal category, however WHR was at borderline of cut-offs (WHR <0.07) recommended by WHO6. Body fat percentage estimated from sum of 4-sites skin fold thickness and by BIA, both were >30% for females within studied age group. Visceral fat percentage was found to be within the healthy range.
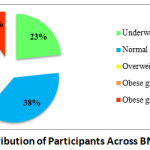 |
Figure 1: Distribution of Participants Across BMI Categories. |
It was observed that about one third of the participants 118 (38%) were normal, 71 (23%) underweight, 49 (16%) overweight, 41 (13%) obese grade I and 31 (10%) were obese grade II11. It is illustrated in the figure 1.
There is a significant positive correlation (r2 = 0.915, p<0.01) observed between the two methods viz BIA and SFT which is illustrated in figure 2. However, the body fat percentage obtained by both these methods differ.
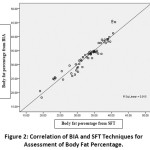 |
Figure 2: Correlation of BIA and SFT Techniques for Assessment of Body Fat Percentage. |
The Bland-Altman plot shown in figure 3 indicates a proportional bias (r=0.176, p<0.05). The difference of agreement between SFT & BIA methods is also observed significantly. BIA overestimates the body fat percentage with limits of agreement -5.33 to 3.28 %.
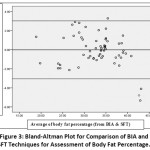 |
Figure 3: Bland-Altman Plot for Comparison of BIA and SFT Techniques for Assessment of Body Fat Percentage. |
Discussion
Currently adiposity is used as a marker to define the obesity rather than relation of body weight to body height which is BMI. Our study has attempted to explore the comparison between two most commonly used methods in clinical practice and research for assessment of adiposity. In our study, mean BMI was observed to be within the normal category but WHR is at borderline of cut-offs recommended by WHO6 which describes the trend of central obesity. Similarly, body fat percentage is also higher than the cut-offs for women12. Alvero-Cruz et al (2015) found that body fat percentage measured by BIA strongly correlated with readings by different anthropometric methods13. Results from our study also have depicted a linear correlation between both methods studied. However, it is important to note that the results depend on number and sites of skinfolds as well as variations in the distribution of subcutaneous fat14,15. In most settings, SFT, BIA and other 2 compartment models are the only techniques available for body composition measurements. The Bland-Altman analysis was done to test the proportional bias and limits of agreement. Limits of agreement estimates likely differences between individual results measured by two methods. Proportional bias is the bias when one method gives value that are higher/lower than those from another method by the quantity that is proportional to the level of measured value. Our observations have showed that BIA overestimates the body fat percentage compared with body fat percentage derived by SFT method. Similar findings have been reported by studies done in United States of America, Colombia and Indonesia 16,17,18. Study done in Indonesian girls have reported that SFT method is one of the practical approaches to assess body composition17. They further also have discussed that change in body water and electrolyte influences BIA measurements and this may lead to errors in body fay percentage evaluation. According to study done on Indian population by Bhat et al a commercial BIA machine overestimated body fat percentage compared with multiple skinfolds and Durnin-Wormesley equation method5. They have also suggested that SFT measurements by Durnin and Wormesley equation may be more appropriate for Indian population. Findings from our study have shown contradictory results with the studies done on Indian population by Chahar et al and Devi et al4,19. Both researchers have independently suggested that BIA underestimates body fat percentage when compared with SFT method. Kuriyan R et al (2014) have stated that SFT and BIA both underestimate the body fat percentage when compared to the 4-compartment model to validate20. González-Ruíz K et al (2018) have also described that BIA and SFT provide less accurate body fat percentage compared with DXA which is considered as the ‘Gold standard’ for body composition analysis18.
Conclusion
A significant difference was observed between BIA & SFT methods in estimating the percentage of body fat within the studied participants. The above results have unraveled a moderate limit of agreement however a good correlation between the BIA & SFT methods was also noted. Both methods cannot be alternative to each other. Each method has its own limitations and applicability, but both are uncomplicated, practical, inexpensive and easy to administer particularly in epidemiological studies.
Acknowledgment
The paper was presented at 53rd IDACON – Virtual International Conference of Indian Dietetic Association. Authors are grateful to all the participants from Symbiosis International (Deemed University), Lavale, Pune and SNDT Women’s University, Karve road campus, Pune.
Funding Source
HT was supported by a Junior Research Fellowship from the University Grants Commission, Government of India.
Conflict of Interest
The authors declare no conflict of interest.
References
- Kuriyan R. Body composition techniques. Indian Journal of Medical Research. 2018;148(5):648-658. DOI: 4103/ijmr.IJMR_1777_18.
CrossRef - Thibault R, Genton L, Pichard C. Body composition: why, when and for who?. Clinical Nutrition. 2012;31(4):435-447. DOI: 1016/j.clnu.2011.12.011.
CrossRef - Andreoli A, Garaci F, Cafarelli FP, Guglielmi G. Body composition in clinical practice. European Journal of Radiology. 2016;85(8):1461-8. DOI: 1016/j.ejrad.2016.02.005.
CrossRef - Chahar PS. Comparison of Skinfold Thickness Measurement and Bioelectrical Impedance Method for Assessment of Body Fat. World Applied Sci J. 2013;28(8):1065-1069. DOI: 5829/idosi.wasj.2013.28.08.8165.
- Bhat D.S., Yajnik C.S., Sayyad M.G., Raut K.N., Lubree H.G., Rege S.S., Chougule S.D., Shetty P.S., Yudkin J.S., Kurpad A.V. Body fat measurement in Indian men: comparison of three methods based on a two-compartment model. International Journal of Obesity. 2005;29(7):842-848. DOI: 10.1038/sj.ijo.0802953.
CrossRef - World Health Organization. Waist circumference and waist-hip ratio: report of a WHO expert consultation, Geneva. 2008. Pg. 27. URL: https://www.who.int/publications/i/item/9789241501491. 8-11 December 2008. Accessed on 24 January 2021.
- Durnin J.V., Womersley J.V. Body fat assessed from total body density and its estimation from skinfold thickness: measurements on 481 men and women aged from 16 to 72 years. British Journal of Nutrition. 1974;32(1):77-97.
CrossRef - Borga M., West J., Bell J.D., Harvey N.C., Romu T., Heymsfield S.B., Leinhard O.D. Advanced body composition assessment: from body mass index to body composition profiling. Journal of Investigative Medicine. 2018;66(5):1-9. DOI: 1136/jim-2018-000722.
CrossRef - Brand R.A. Editorial: Standards of Reporting: The CONSORT, QUORUM, and STROBE Guidelines. Clin Orthop Relat Res.2009;467: 1393–1394. DOI: 10.1007/s11999-009-0786-x.
CrossRef - Bland J.M., Altman D. Statistical methods for assessing agreement between two methods of clinical measurement. Lancet. 1986;327(8476):307-310.
CrossRef - WHO Expert Consultation. Appropriate body-mass index for Asian populations and its implications for policy and intervention strategies [published correction appears in Lancet. 2004.13;363(9412):902. Lancet. 2004;363(9403):157-163. DOI:10.1016/S0140-6736(03)15268-3.
CrossRef - Lavie CJ, Milani RV, Ventura HO, De Schutter A, Romero-Corral A. Use of body fatness cutoff points–reply–I. InMayo Clinic Proceedings 1;85(11): 1057-1058. DOI: 10.4065/mcp.2010.0624.
CrossRef - Alvero-Cruz J.R., Alacid F., Vázquez R.F., López M.J. Body fat assessment by bioelectrical impedance and its correlation with anthropometric indicators. Nutricion Hospitalaria. 2015;31(6):2778. DOI: 10.3305/nh.2015.31.6.6942.
- Gibson RS. Anthropometric assessment of body composition. In: Principles of nutritional assessment. Edition 2, Oxford University Press, New York, 2005: 273-293.
- Kamimura M.A., Avesani C.M., Cendoroglo M., Canziani M.E., Draibe S.A., Cuppari L. Comparison of skinfold thicknesses and bioelectrical impedance analysis with dual‐energy X‐ray absorptiometry for the assessment of body fat in patients on long‐term hemodialysis therapy. Nephrology Dialysis Transplantation. 2003;18(1):101-105. DOI: 10.1093/ndt/18.1.101.
CrossRef - D’Alonzo KT, Aluf A, Vincent L, Cooper K. A comparison of field methods to assess body composition in a diverse group of sedentary women. Biological Research for Nursing. 2009;10(3):274-83. DOI: 10.1177/1099800408326583.
CrossRef - Isjwara RI, Widjaja Lukito MD. Comparison of body compositional indices assessed by underwater weighing, bioelectrical impedance and anthropometry in Indonesian adolescent girls. Asia Pacific journal of clinical nutrition. 2007;16(4):641. PMID: 18042523.
- González-Ruíz K, Medrano M, Correa-Bautista JE, García-Hermoso A, Prieto-Benavides DH, Tordecilla-Sanders A, Agostinis-Sobrinho C, Correa-Rodríguez M, Schmidt Rio-Valle J, González-Jiménez E, Ramírez-Vélez R. Comparison of bioelectrical impedance analysis, slaughter skinfold-thickness equations, and dual-energy X-ray absorptiometry for estimating body fat percentage in Colombian children and adolescents with excess of adiposity. 2018;10(8):1-14. DOI: 10.3390/nu10081086.
CrossRef - Devi B.L., Muthiah N.S., Murty K., Swamy C.G. A Comparative Evaluation of the Body Fat Percentage using Bioelectrical Impedance Analyser, Skin-fold Thickness Measurement and BMI. Journal of Clinical & Diagnostic Research. 2019;13(1):1-5. DOI: 7860/JCDR/2019/39781.12535.
CrossRef - Kuriyan R., Thomas T., Ashok S. A 4-compartment model-based validation of air displacement plethysmography, dual-energy X-ray absorptiometry, skinfold technique & bio-electrical impedance for measuring body fat in Indian adults. Indian Journal of Medical Research. 2014;139(5):700-707. PMID: 25027079.

This work is licensed under a Creative Commons Attribution 4.0 International License.


