Evaluation of A Raman Spectroscopic Method for the Determination of Alcohol Content in Greek Spirit Tsipouro
1Laboratory of Chemistry, Department of Food Science and Human Nutrition, Agricultural University of Athens, 75 Iera Odos, 11855 Athens, Greece
2Laboratory of Enology, Department of Food Science and Human Nutrition, Agricultural University of Athens, 75 Iera Odos, 11855 Athens, Greece.
Corresponding Author Email: ptara@aua.gr
DOI : http://dx.doi.org/10.12944/CRNFSJ.4.Special-Issue-October.01
Download this article as:
![]()
A Raman spectroscopic method and the conventional distillation method for the determination of alcohol content % (v/v) in Greek spirit Tsipouro used. A univariate calibration model was constructed employing the band area at 880 cm-1 of standard ethanol solutions. The concentrations of 46 samples were then measured using the calibration model and the results were compared with those obtained using the conventional analysis employing a distillation step. Alcohol content in Greek spirit Tsipouro measured with the conventional method ranged from 35.1 to 71.2 % (v/v). The determination coefficient (R2) value was 0.9997 while the corresponding values of the relative errors ranged between – 13.1 -1.0 %. According to the proposed method the alcohol concentration in Greek spirit Tsipouro ranged from 27.7 to 68.2 % (v/v). The proposed method is simple, rapid, economical and does not require any sample pre-treatment steps. It could be a starting point for the design of more specific models according to the requirements of the spirit industry.
KEYWORDS:Greek spirit; Tsipouro; ethanol; Raman spectroscopy; quantitative analysis
Introduction
Alcoholic beverages from fermented grape pomace are very popular in Mediterranean countries. Greek Tsipouro and Tsikoudia, Italian Grappa, Portuguese Bagaceiras and Aguardiente, Spanish Orujo, French Eau-de-Vie de Marc and Cypriot Zivania fall within this category [1]. Tsipouro and similar grape pomace distillates are legally defined under European Community Council (ECC) regulation no. 1576/89 (EC, 1989) [2].
Tsipouro is produced in Greece by distillation of the residual from wine making, mostly the marc. Grape marc or pomace is the solid waste obtained after extraction of the grape juice during winemaking. It accounts for 150 g/Kg of the grape mass and it is comprised mainly of skins and seeds and to a varying extent of stalks [3]. Their production begins with the selection of the grape variety, then the thorough fermentation of the grape marc occurs and lastly a slow and gradual distillation of the fermented grape marc takes place [4]. Some producers use to add aromatic seeds or plants (such as anise, fennel, saffron, walnut tree leaves).
In Greece before 1988, production licenses for Tsipouro were granted for certain days of the year only to farmers, in poor areas. Today, the situation has changed as Tsipouro is highly appreciated by consumers and by wine drinkers, especially after gourmet meals [5]. Homemade Tsipouro, which can be commercially available, is mostly consumed undiluted and its ethanol content is usually higher than 50 % (v/v). Tsipouro produced commercially is bottled after dilution with water to obtain a product of alcohol content between 37.5 and 50 % (v/v). Commercial Tsipouro is the only one actually bottled and available for foreign sales while homemade is only for regional sales [5].
During the distillation process, the distillate is separated into three fractions: the “head”, the “heart” and the “tail”. The first fraction is composed mainly of alcohol-soluble components (e.g. acetaldehyde, ethyl acetate, higher alcohols), the second of ethanol and higher alcohols while the third of less volatile compounds [3]. The initial and final fractions of the distillate are discarded due to undesirable congeners they contain [6]. The decision when the distillations cuts are made however relies on an empirical way based on the particular skill of the distillery and on the bulk concentration of alcohols as assessed by densitometry [6]. The cut between head and heart products is typically made between 70 and 80 % (v/v) ethanol whereas the cut between heart and tail between 35 and 50 % (v/v) ethanol [7]. Selection of the cut points at the beginning and end of spirit collection is critical for the quality of the final product and depends on the experience of the distillery.
There exist a number of methods for ethanol content determination of spirits. Most of them are densimetric methods which however have to be preceded by a distillation step, to separate the ethyl alcohol from the extractive matter and then to determine it by pycnometer or electronic densimeter [8, 9]. These methods are time consuming and labor-intensive. Unsuccessful attempts that did not gain wider distribution in commercial laboratories include titration methods, enzymatic analysis as well as liquid or gas chromatographic analysis [10]. These methods had basically no advantage over densimetric reference methods as they were even more complex and labor-intensive. Nevertheless, all the above mentioned methods are destructive and time consuming. Therefore, there is need for the development of methods non-invasive, rapid and simple which can be used without any sample preparation step.
Raman spectrospopy has proved to be an excellent tool, not only for qualitative purposes but also for quantitative analysis of water rich samples [11-14]. Raman spectrospopy is more often associated with the determination of molecular structure and with qualitative analysis [15]. However, Raman scattering intensity is proportional to the number of molecules present in a given sample volume. The proportional relationship between Raman scattering intensity and analyte concentration is the basis for most of the quantitative analyses done using Raman spectrospopy [15].
There are several advantages using Raman spectroscopy for analysis of water-rich samples over other analytical techniques. For example sample preparation is not required which facilitates on-line analysis. Moreover, since band intensities caused by -OH stretching vibrations are weak in Raman spectra, water-rich samples such as spirits can be directly analysed [16].
The objective of the research proposed was to explore and evaluate the suitability of Raman spectroscopy as a simple, rapid and economical technique to determine ethanol content of spirits which is of high technological importance. For this purpose, ethanol content of selected bottled and homemade Greek Tsipouro distillates was determined according to the conventional method usually employed which requires a prior distillation step. The results were correlated with the area of the peak at 880 cm-1 of the corresponding Raman spectra. The proposed method has the advantages of Raman spectroscopy combined with statistical simplicity since it is based on a simple calibration curve.
Materials and methods
Samples
Representative Tsipouro samples from different parts of Greece were collected. These samples were either commercial (13) or home-made (33) in order to take into account both types which are equally preferred by consumers. In total, 46 samples were analyzed.
Determination of ethanol content-distillation method
The sample (200 mL) was quantitatively transferred to the distillation apparatus. The obtained alcohol fraction from distillation was filled up to the original volume with distilled water. In this way a liquid was obtained which had the same alcohol concentration as the original sample. Finally, the alcohol concentration in % (v/v) (CD) was determined via pycnometric determination of the density using appropriate alcohol concentration tables [8].
Preparation of the standards
15 standard samples were prepared using ethanol (99.9 % v/v, Sigma-Aldrich) and distilled water. The concentrations of the standards ranged between 5 and 75 % (v/v) ethanol. Ethanol was added to a 100 mL volumetric flask (previously calibrated) using a piston volumetric pipet (Metrohm, ±0.03 ml).
Raman Spectroscopy
A DeltaNu Advantage 785 near-infrared Raman spectrometer (Laramie, WY) equipped with a 785 nm diode laser for excitation with a maximum output power of 71.6 mW was used to record spectra of spirit samples. The spectral resolution of the instrument is 8 cm-1 and the spectral range 2000-200 cm-1. Triplicate spectra were obtained for each standard and sample. 700 μL of each spirit sample was placed into a 1mL clear shell vial (VWR International, USA).The vial was placed into a prefixed sampler holder such that the laser was focused into the center of the vial. Each spirit and standard spectrum is a 15 s acquisition over the spectral range of 2000-200 cm-1. The spectra were collected with the NuSpec software provided by the manufacturer and then treated with the OMNIC ver. 7.3 (Thermo Fisher Scientific Inc) software.
The Raman spectra were smoothed using the Savitsky–Golay algorithm (5-point moving second-degree polynomial), and their baselines were corrected using the Savitsky–Golay algorithm (2nd polynomial order, 20 iterations). The above functions are contained in the OMNIC software as “automatic smooth” and “automatic baseline correct”.
The average of triplicate spectra of each standard and spirit sample was calculated using the above software.
Statistics
The area (A) of the peak at 880 cm-1 of each averaged Raman spectrum of the standard samples was correlated with the corresponding ethanol concentration (C) (% v/v) using simple linear regression (Microsoft Excel 2007 software).
Results and discussion
The ethanol concentration in Greek spirit Tsipouro as it was determined using the conventional reference (CD)method ranged between 35.6 and 71.2 % (v/v) (average value 49.2 %) for homemade and 38.1 and 45.0 % (v/v) (average value 41.5) for the bottled samples (Table 1). Apostolopoulou et al. [5] reported ethanol concentrations between 40.1 and 42.4 % (v/v) in bottled Tsipouro samples whereas in homemade samples alcohol content ranged from 37 to 53.6 % (v/v). In agreement with the results of reported by Aposolopoulou et al. [5], higher alchohol contents were observed in the homemade samples where the dispersion was also greater. This is a rather expected result since the raw material is not of a controlled origin, and the distillation process is not standardized leading to products with variable concentrations of ethanol.
Examples of the Raman spectra obtained for (a) ethanol standard solutions (60 % v/v) and (b) one of the samples are shown in Figure 1.
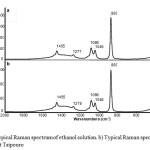 |
Figure 1: a) Typical Raman spectrum of ethanol solution. b) Typical Raman spectrum of Greek spirit Tsipouro Click here to View figure |
These spectra were collected using identical laser power. As it can be observed, both spectra had similar profiles. Six peaks are simultaneously present in each spectrum. The peak at 1455 cm-1 is due to the asymmetric deformation of –CH3 and the scissoring vibration of –CH2– whereas the peak at 1278-1277 cm-1 could be attributed to the twisting vibration of –CH2– [17] (Socrates 2001a). In addition, the peak at 1089-1088 cm-1 is due to the stretching vibration of C-C and the asymmetric vibration of C-C-O and the peak at 1049-1048 cm-1 due to the stretching vibration of C-C [17]. The most intense band is observed at 880 cm-1 and it could be attributed to the symmetric C-C-O stretch of ethanol [18]. Finally, a broad and low intensity band with a maximum at the 435-434 cm-1 which appears at the last part of the spectrum is assigned to the deformation vibration of C-O [17]. According to Numata et al. [12], in Raman spectrum the band due to the -OH stretch of water is of very low intensity and does not overlap with the sharp band of ethanol around 880 cm-1, allowing thus direct analysis of alcohol content in aqueous solutions.
Figure 2, presents the peak at 880 cm-1 of the Raman spectra obtained after the analyses of the standard ethanol solutions.
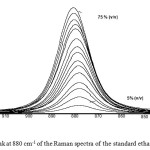 |
Figure 2: The peak at 880 cm-1 of the Raman spectra of the standard ethanol solutions. Click here to View figure |
It can be observed that the area of this peak increased with increasing concentration of the ethanol solutions and this increase seems to be proportional to the analyte concentration. Therefore, this peak was selected for the quantitative analysis of ethanol (% v/v) of the samples examined.
The area (A) of the above mentioned Raman peak of standard ethanol solutions was plotted against the volume fraction of ethanol. An initial linear correlation was found using the simple regression analysis at a confidence level of 95 %. The equation of the calibration curve was the following: C=(-0.225±0.679)+(2.2×10⁻⁴±0.3×10⁻⁴)A (equation 1) with a correlation coefficient (R) value of 0.999 and a coefficient of determination value of (R2)= 0.998. However, according to the results of the simple regression analysis (data not shown), the p value of the intercept was found 0.746 which is higher than 0.05 suggesting that the intercept is zero. Accordingly, the corresponding p value for the slope was 0.000 (which is lower than 0.05) suggesting that the slope has a different than zero value. It was thus necessary to draw a new final calibration curve with an intercept value equal to zero. Figure 3 shows this curve which was acquired using the simple regression analysis. The obtained equation is C=2,2×10⁻⁴A (equation 2) with a confidence level of 95 %.
The results obtained from the statistical analysis of the final simple regression analysis are presented in Table 2. The calculated R value was 0.9997 indicating statistical significant linearity between the concentration C and the area A. Moreover, the R2 value (0.9994) indicates that 99.94 % of the total variation in C can be explained by the linear relationship between A and C, as described by equation 1. The low value (1.202) obtained for the standard error suggests that the residual in the equation of linear regression is not significant. From the previous discussion it is clear that there is a strong linear relationship between C and A which is shown in Figure 3.
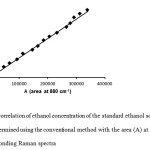 |
Figure 3: The correlation of ethanol concentration of the standard ethanol solutions (C) (% v/v) determined using the conventional method with the area (A) at 880 cm-1 of the corresponding Raman spectra Click here to View figure |
The zero value obtained for Significance of F confirms the validity of the regression output since there is not any probability that regression output was merely a chance occurrence (Table 2). The p value of 0.000 (<0.05) and the tstatistic value of 146.442 (>tcritical=2.160 for 13 degrees of freedom) indicate that the slope value is valid at a 95 % confidence level. The lower and higher limits for the above confidence level were found 0.0002 and 0.00025% respectively (Table 2).
It is important in order to prove the robustness of the model, to consider the ‘homoskedasticity’, or the homogeneity of variance. For this purpose, the predicted C (% v/v) and the standardized residuals were calculated using the summary output of the final simple linear regression and the corresponding plot is presented in Figure 4. It can be observed that the absolute values of the residuals were lower than 2. Consequently there were not found any outliers and all random variables presented similar variance.
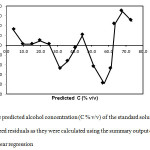 |
Figure 4: The predicted alcohol concentration (C % v/v) of the standard solutions vs the standardized residuals as they were calculated using the summary output of the final simple linear regression Click here to View figure |
The ethanol concentration (CA,R) (% v/v) of every sample was then predicted using the calibration model proposed above and the results are presented in Table 1.
The calculated CA,R ranged from 34.2 to 68.2 % (v/v) for the homemade and from 27.7 to 45.0 % (v/v) for the bottled Tsipouro samples. The average calculated values were 45.1 and 39.6 % (v/v) for the homemade and bottled samples respectively. As it
can be seen, the values obtained by both the conventional and the proposed methods are very similar. Moreover, the values of the relative error fell within -13.1 and 1.0 % (Table 2) with only one sample (No 21) showing absolute relative error over 10% and 42 samples having values below 5% indicating the robustness of the proposed method. Recovery values were also calculated and are shown in Table 1. They ranged from 68.0 to 102.2 % with an average value 95±5 % further supporting the robustness of the proposed method.
Employment of the Raman spectroscopy has already found use as a possible tool for rapid measurement of ethanol content in alcohol-water binary systems [12, 14, 19] in rice wine [20] and during the fermentation process of glucose by Saccharomyces cerevisiae [21]. However there are few studies concerning ethanol determination in alcoholic beverages such as beer, whiskey, tequila, rum, cachaca, vodka [14, 18, 22, 23] very few in spirits of grape origin (brandy, pisco) [14, 23] and none for Tsipouro. The alcoholic beverages have been analysed using Raman spectroscopy with either univariate [14, 18] or multivariate calibration models [23]. Nordon et al. [18] constructed different calibration models for different types of alcoholic beverages. In the above mentioned univariate models, the intensity of the Raman peak at 880 cm-1 has been used for calibration, while Nordon et al. [18] used its first derivative for the construction of the calibration model.
In all research works mentioned above, the peak area (A) has not been previously employed for the construction of the ethanol calibration curve. It is known that peak areas generally lead to better results, than quantification using intensities, since noise effects can introduce errors into peak maxima determinations [24]. Moreover, as it can be seen in Figure 1, the Raman peak at 880 cm-1 is well resolved from the others justifying the selection of this particular peak area for ethanol quantification.
In most of the published studies the use of Raman spectroscopy for quantitative determinations is combined with calibration models based on multivariate analysis such as principal component regression and partial least squares regression [25] which are more complicated and require more sophisticated software. Since Raman band area is proportional to analyte concentration, it is possible to employ a simple univariate calibration model for the analyte quantification. Univariate are simpler than the multivariate calibration models since it is easier to be updated and maintained.
The proposed Raman method for ethanol quantification of Greek spirit Tsipouro has some advantages over the existing methods particular with regard to calibration which is based on a simple linear regression method. It also rapid, economical, non-destructive and does not require any sample processing prior to analysis.
Table 1: Ethanol concentration (% v/v) of Greek spirit Tsipouro determined using the conventional distillation method (CD) and the area (CA,R) of the Raman band at 880 cm-1, the corresponding relative errors and the recoveries.
|
Sample |
CD |
CA,R |
Relative error (%) |
Recovery (%) |
|
1* |
39.7 |
40.6 |
0.9 |
102.2 |
|
2* |
38.1 |
36.9 |
-1.2 |
96.9 |
|
3* |
44.5 |
40.7 |
-3.8 |
91.4 |
|
4 |
44.4 |
45.4 |
1.0 |
102.2 |
|
5 |
38.1 |
36.8 |
-1.3 |
96.7 |
|
6 |
35.9 |
35.3 |
-0.6 |
98.2 |
|
7 |
40.7 |
40.5 |
-0.2 |
99.4 |
|
8* |
41.5 |
40.1 |
-1.4 |
96.7 |
|
9 |
40.1 |
39.9 |
-0.2 |
99.4 |
|
10* |
44.8 |
45.0 |
0.2 |
100.4 |
|
11* |
39.5 |
39.4 |
-0.1 |
99.8 |
|
12 |
35.6 |
34.6 |
-1.0 |
97.2 |
|
13 |
56.8 |
57.0 |
0.2 |
100.3 |
|
14 |
37.9 |
35.3 |
-2.6 |
93.2 |
|
15 |
42.7 |
41.4 |
-1.3 |
97.0 |
|
16* |
38.4 |
37.0 |
-1.4 |
96.5 |
|
17* |
41.0 |
40.4 |
-0.6 |
98.5 |
|
18* |
40.8 |
39.6 |
-1.2 |
97.1 |
|
19* |
45.0 |
44.5 |
-0.5 |
98.8 |
|
20* |
43.6 |
44.5 |
0.9 |
102.2 |
|
21* |
40.8 |
27.7 |
-13.1 |
68.0 |
|
22* |
41.9 |
39.0 |
-2.9 |
93.0 |
|
23 |
60.4 |
59.4 |
-1.0 |
98.3 |
|
24 |
66.7 |
64.8 |
-1.9 |
97.1 |
|
25 |
54.0 |
53.5 |
-0.5 |
99.0 |
|
26 |
55.2 |
54.6 |
-0.6 |
98.9 |
|
27 |
50.4 |
43.7 |
-6.7 |
86.7 |
|
28 |
37.0 |
34.2 |
-2.8 |
92.4 |
|
29 |
43.8 |
41.3 |
-2.5 |
94.3 |
|
30 |
45.0 |
43.8 |
-1.2 |
97.4 |
|
31 |
49.6 |
46.7 |
-2.9 |
94.1 |
|
32 |
39.6 |
36.4 |
-3.2 |
92.0 |
|
33 |
41.8 |
38.3 |
-3.5 |
91.6 |
|
34 |
60.4 |
56.8 |
-3.6 |
94.1 |
|
35 |
58.2 |
54.6 |
-3.6 |
93.9 |
|
36 |
71.2 |
68.2 |
-3.0 |
95.8 |
|
37 |
54.4 |
49.7 |
-4.7 |
91.3 |
|
38 |
63.4 |
58.0 |
-5.4 |
91.5 |
|
39 |
61.4 |
58.1 |
-3.3 |
94.6 |
|
40 |
49.8 |
48.3 |
-1.5 |
97.0 |
|
41 |
46.0 |
44.0 |
-2.0 |
95.6 |
|
42 |
48.2 |
45.9 |
-2.3 |
95.1 |
|
43 |
53.0 |
50.2 |
-2.8 |
94.8 |
|
44 |
44.8 |
42.7 |
-2.1 |
95.4 |
|
45 |
40.8 |
39.0 |
-1.8 |
95.6 |
|
46 |
55.2 |
46.8 |
-8.4 |
84.8 |
*: Samples are bottled spirits. The rest are homemade.
Table 2: The output summary of the final simple regression analysis.
|
Regression statistics |
|||||||||||
| Multiple R |
0.9997 |
||||||||||
| R2 |
0.9994 |
||||||||||
| Standard error |
1.202 |
||||||||||
|
Analysis of variance |
|||||||||||
|
Degrees of freedom |
Significance F |
||||||||||
|
Regression |
1 |
0.000 |
|||||||||
|
Residual |
14 |
||||||||||
|
Total |
15 |
||||||||||
|
Coefficients |
Standard error |
t statistic |
p value |
Lower 95 % |
Higher 95 % |
||||||
|
Intercept |
0 |
||||||||||
|
Slope |
0.00022 |
0.0000 |
146.442 |
0.000 |
0.0002 |
0.0002 |
|||||
Raman spectroscopy is a powerful tool for ethanol quantitative analysis of Greek spirit Tsipouro. The information obtained by the high spectral resolution, typical of Raman spectra, allowed simple statistical models to be accurately employed for the implementation of the results. Peak area was linearly related with the concentration of standard ethanol solutions. The accuracy of the resulting calibration model was tested on a second set of Greek spirit samples where ethanol content had been previously measured with the conventional distillation method. The resulting calibration curve of the proposed method presented statistically significant values of R=0.9997 and R2=0.9994. The relative values errors of the vast majority of samples were lower than 5 %. Furthermore the values of p=0.000 and tstatistic=146.442 for a confidence level of 95 % as well as the homoskedasticity of the samples and the 95% recovery value confirmed the robustness of proposed model. The proposed method is time saving and cost-effective since it provides rapid and direct results which are easy to interpret without requiring any sample pretreatment steps.
References
- Geroyiannaki M, Komaitis M.E, D. E. Stavrakas D.E, Polysiou M, Athanasopoulos P.E, Spanos M. Evaluation of acetaldehyde and methanol in Greek traditional alcoholic beverages from varietal fermented grape pomaces. Food Control; 18: 988-995: (2007).
CrossRef - European Union legislation (EU) 31989R1576: Council Regulation (EEC) No 1576/89 of 29 May 1989 laying down general rules on the definition, description and presentation of spirit drinks: (1989).
- Flouros A.I, Apostolopoulou A.A, Demertzis P.G, Akrida-Demertzi K. Influence of the packaging material on the major volatile compounds of tsipouro, a traditional Greek distillate. Food Sci. Tech. Int.; 9: 371-378: (2003).
CrossRef - Fotakis C, Christodouleas D, Kokkotou K, Zervou M, Zoumpoulakis P. Moulos P, Liouni M, Calokerinos A. NMR metabolite profiling of Greek grape marc spirits. Food Chem.; 138: 1837-1846: (2013).
CrossRef - Apostolopoulou A.A, , A. I. Flouros A.I, Demetzis P.G, Akrida-Demertzi K. Differences in concentration of principal volatile constituents in traditional Greek distillates. Food Control; 16: 157-164:(2005).
CrossRef - Da Porto C. Grappa and grape-spirit production Crit. Rev. Biotechnol.; 18: 13-24: (1998).
CrossRef - Silva M.L, Macedo A.C, Malcata, F. Review: steam distilled spirits from fermented grape pomace. Food Sci. Tech. Int.; 6: 285-300: (2000).
- International Organisation of Vine and Wine (OIV). OIV-MA-BS-01: R2009 Reference method for the determination of alcoholic strength by volume of spirit drinks of viti-vinicultural origin. Compendium of International Methods of Analysis of Spirituous Beverages of Vitivinicultural Origin, ed. 2014. Mendoza (Argentina): (2014).
- International Organisation of Vine and Wine (OIV). OIV-MA-BS-06: R2009 Density of alcohols and alcohlic beverages method for determining electronic densimetry (principle based on measuring the period of oscillation). Compendium of International Methods of Analysis of Spirituous Beverages of Vitivinicultural Origin, ed. 2014. Mendoza (Argentina): (2014).
- Lachenmeier D.W, Godelmann R, Steiner M, Ansay B, Weigel J, Krieg G. Rapid and mobile determination of alcoholic strength in wine, beer and spirits using a flow-through infrared sensor. Chem. Cent. J.; 4: 1-13 :(2010).
CrossRef - Numata Y, Tanaka H. Quantitative analysis of quercetin using Raman spectroscopy. Food Chem.; 126: 751-755: (2011).
CrossRef - Numata Y, Iida Y, Tanaka H. Quantitative analysis of alcohol-water binary solutions using Raman spectroscopy. Journal Quant. Spectrosc. Ra.; 112: 1043-1049: (2011).
CrossRef - Pelletier M.J. Quantitative analysis using Raman spectrometry. Appl. Spectrosc.; 57: 20-42: (2010).
CrossRef - Satto-Beru R.Y, Medina-Valtierra J, Medina-Gutierrez C, Frausto-Reyes C. Spectrochim. Acta, Part A; 60: 2225-2229: (2002).
CrossRef - Premasiri W.R, Clarke R.H, Londhe S, Womble M.E. Determination of cyanide in waste water by low-resolution surface enhanced Raman spectroscopy on sol-gel substrates. J. Raman spectrosc.; 32: 919-922: (2001).
CrossRef - Rull F. Structural investigation of water and aqueous solutions by Raman spectroscopy.Pure Appl. Chem.; 74: 1859-1870: (2002).
CrossRef - Socrates G. Infrared and Raman characteristic group frequencies. Tables and charts, 3rd ed. John Willey & Sons Ltd, Chichester (UK) (2001).
- Nordon A, Mills A, Burn R.T, Cusick F.M, Littlejohn D. Comparison of non-invasive NIR and Raman spectrometries for determination of alcohol content of spirits. Anal. Chim. Acta; 548: 148-158: (2005).
CrossRef - Zou X, Shen L, Shi J. Near-infrared laser Raman spectra of ethanol-water solution for different volume concentration and temperature. Journal of Jiangsu University; 36: 171-175: (2015).
- Yang D, Ying Y. Determination of ethanol concentration in Chinese rice wine by dispersive Raman spectroscopy. American Society of Agricultural and Biological Engineers Annual International Meeting, ASABE 2011, 7: 5305-5310: (2011).
- Avila T.C, Poppi R.J, Lunardi I, Tizei P.A.G, Pereira G.A.G. Raman spectroscopy and chemometrics for on-line control of glucose fermentation by Saccharomyces cerevisiae. Biotechnol Prog.; 28: 1598-1604: (2012).
CrossRef - Frausto-Reyes C, Medina-Gutierrez C, Sato-Berru R, Salagun L.R. Qualitative study of ethanol content in tequilas by Raman spectroscopy and principal component analysis. Spectrochim. Acta Part A; 61: 2657-2662: (2005).
CrossRef - Mendes L.S, Oliveira F.C.C, Suarez P.A.Z, Rubim J.C. Anal. Chim. Acta.; 493: 219–231: (2003).
CrossRef - Williams A.C. Some pharmaceutical application of Raman spectroscopy. In Lewis IR, Edwards HMG (ed) Handbook of Raman Spectroscopy: From the research laboratory to the process line. CRC Press, New York, Basel (2001).
- Das R.S, Agrawal Y.K. Raman spectroscopy: Recent advancements, techniques and applications.Vib Spectrosc.; 57: 163-176: (2011).
CrossRef


Web of Science Coverage
Emerging Sources Citation Index (ESCI)
2024 Journal Impact Factor: 1.1
Scopus Journal Metrics
CiteScore 2025: 2.6
CiteScore Details
Sustainable Nutrition: Food Systems, Nutrient Retention, and Public Health Impact
![]()
This journal is a member of, and subscribes to the principles of, the Committee on Publication Ethics (COPE)


