Authenticity Determination of Greek-Cretan Mono-Varietal White and Red Wines Based on their Phenolic Content Using Attenuated Total Reflectance Fourier Transform Infrared Spectroscopy and Chemometrics

1Department of Food Science and Human Nutrition, Laboratory of Oenology, Agricultural University of Athens, 75 Iera Odos, 11855 Athens, Greece
2Department of Food Science and Human Nutrition, Laboratory of General Chemistry, Agricultural University of Athens, 75 Iera Odos, 11855 Athens, Greece
3School of Agricultural Technology, Technological and Educational Institute of Crete, Heraklion, Crete, Greece.
Corresponding Author Email: stamatina@aua.gr
DOI : http://dx.doi.org/10.12944/CRNFSJ.4.Special-Issue-October.08
Download this article as:
![]()
The assessment of wine authenticity is a critical issue that has gained a lot of interest internationally. A simple and fast method was developed for the varietal classification of Greek wines according to grape cultivar using attenuated total reflectance (ATR) Fourier transform infrared (FT-IR) spectroscopy. The phenolic content and color parameters of wine samples (n=88) made by two white (Vilana and Dafni) and two red (Kotsifali and Mandilari) grape varieties were measured and their FT-IR spectra were recorded. Principal Component Analysis (PCA) of their chemical parameters indicated that the wines can be discriminated based on their different phenolic content. The spectroscopic analysis combined with discriminant analysis of the fingerprint region of the spectra (1800-900 cm-1) resulted in complete discrimination of the grape varieties. The proposed method in comparison with the rest analytical methods is simpler, less time consuming, more economical and requires reduced quantities of chemical reagents prior to analysis.
KEYWORDS:Wine; Variety; FT-IR; Authentication
Introduction
Determination of wine authenticity is one of the most crucial issues that have gained a lot of interest internationally. Wine adulteration refers to different kinds of fraud e.g. dilution of wines with water, addition of alcohol, coloring and flavoring substances, blending with a wine of a lesser quality, mislabeling. i.e. fraudulent misrepresentation of cultivar and geographical origin [1]. An important part of the commercial value of a wine relies on varieties and regions of origin (geographical) since wine marketing strategies focus on associating the product image and the perception of quality with a specific region and/or variety. For this reason, fraudulent practices were widespread for many years, mainly due to the fact that tools for detection of adulteration were not readily available.
As adulteration of wine is an ongoing problem, there is a need of suitable analytical approaches for get more insight into the chemical composition and its changes associated with adulteration. The most established methods are based on trace element, phenolic compound and isotope ratios determinations [2,3,4,5,6]. Generally, volatile compounds are used to characterize varieties, trace elements are used for geographical determination whereas phenolic compounds for both [1].
Phenolic compounds represent one of the most important groups for wine as they directly affect wine quality. Although phenolic compounds found in wine can also originate from microbial and oak sources, the majority of the phenolic constituents found in wine are grape-derived. In white wine, the most important phenolic compounds are the hydroxycinnamic acids and of minor quantities, the flavan-3-ol monomers. These compounds are important for the color quality of the white wine [7]. In red wine, tannins and anthocyanins which are located in grape skins and seeds are the most important phenolic classes. Tannins are responsible for the stabilization of the colour and the sensory characteristics of the wines due to their astringent and bitter properties [7].
Wine phenolics have been studied for their ability to differentiate grape growing regions [8] or varieties [9] but also for the influence of terroir on their profile [10] and even differences between clones of the same variety [11]. Gallego at el. (2013) [12] reported that the phenolic composition of the wine is affected by variety and vintage but phenolic profiles are mainly affected by variety.
To date, a number of analytical methods are available for the determination of grape and wine phenols and most of them employ high performance liquid chromatography (HPLC) for analyzing monomeric or oligomeric polyphenols or more advanced techniques such as high performance liquid chromatography – mass spectrometry (LC-MS) for polymeric compounds. However, these analyses are both time consuming and expensive and require highly specialized equipments. Therefore, cheap, rapid and efficient methods to classify wines remain a priority for wine research and industry.
Infrared spectroscopy based methods are recently emerging because of their versatility and efficiency, their cost effectiveness, and their fast and non –invasive nature 13]. Combining spectroscopic techniques with multivariate data analysis is proving to be very promising for the discrimination of wines of different varietal origin, wines from different countries [14-15].
The discrimination is based on the samples’ (solid, liquid or gaseous) ‘fingerprint’, the unique spectrum that results after it absorbs some of the infrared radiation at specific wavelengths [1].
The investigation presented herein was undertaken in order to thoroughly investigate whether grape varieties can be discriminated in finished wines despite their high heterogenicity. For this reason color parameters and phenolic content of both red and white mono-varietal wines have been evaluated and their influence on variety discrimination was taken into account. Moreover, it was of interest to investigate the potential use of Fourier transform infrared spectroscopy (FT-IR) combined with multivariate data analysis as an alternative rapid, simple and economical method for wine authentication.
Materials and Methods
Wine samples
The wines were 2012 and 2013 vintages from the region of Heraklion in Crete, Greece. Two white wines from the grape varieties Vilana and Dafni and two red from Kotsifali and Mandilaria, all indigenous Vitis Vinifera varieties of Crete, were used. The vinification procedure followed the steps of classical white and red winemaking. In total, twenty samples of each white variety and twenty four samples of each red variety were used for the analysis (88 in total).
Spectrophotometric analyses
In an attempt to understand the importance of each chemical parameter in discriminating wine samples, various methods widely used to measure colour characteristics as well as phenolic contents were employed.
In wines several classical analytical parameters (hue, colour intensity) were determined according to the OIV methods (1990) [16]. In addition, their total phenolic content (TP) [17], total anthocyanin content (TA) and anthocyanin ionization index [18] were also determined. In more detail, color intensity was calculated as the sum of absorbances at 420, 520 and 620nm and hue was calculated as the ratio between absorbance at 420 and 520 nm. The pH variation procedure was employed for total anthocyanin measurement. This required the preparation of two samples, each containing 1mL wine and 1mL EtOH 0.1% HCl (12mol L−1). Then10 mL of 2% HCl (12 mol L−1) was added to the first sample and 10 mL buffer at pH 3.5 to the other. The difference in absorbance values at 520nm was calculated (Δd) and the concentration was given by the following equation: C (mg L−1)=Δd × 388. To calculate the ionization index value, the following absorbance values of wine samples at 520nm were recorded: normal pH (A), bleached by an excess of SO2 (ASO2) and at pH 1 after the addition of HCl (AHCl). The ionization value is expressed by (A−ASO2/AHCl −ASO2) × 100 ratio.
For the determination of their tannin content three widely used methods were employed. The first method measures tannin concentration (g/L) after heating in acid medium and conversion into cyaniding (TT) [18], while the second (BSA) and third (MCP) methods are protein based (Bovine Serum Albumin-BSA) and polysaccharide (methylcellulose) tannin precipitation assays respectively [19,20]. All analyses were performed in triplicate.
Sample pretreatment: Solid Phase Extraction (SPE)
To obtain the phenolic fraction of the wines the method described by Edelmann et al., (2001) [21] was followed. The SPE cartridges (6 mL reservoirs, packed with 1 gram of DSC – 18 sorbent) were placed on the extraction unit and were preconditioned with 10 mL methanol and subsequently distilled water. A volume of 3 mL of filtered wine diluted with water to a final volume of 18 mL, was loaded on the cartridge. The cartridges were treated with 20 mL water, and dried by vacuum pressure application (15-20 mbar). Phenolic fractions were obtained by elution with 3 mL acidic methanol (0.01% HCL v/v) and were further concentrated to a final volume of 1 mL.
Spectroscopy-Data acquisition
All spectra were collected using an FT-IR spectrometer (Shimadzu IR Prestige 21) equipped with an ATR system (Attenuated Total Reflectance) with a diamond crystal as the ATR cell, a high energy ceramic light source, and a DLATGS detector. The spectral region used was the phenolic fingerprint region (1800-900 cm-1). The resolution was 4 cm-1 and the apodization function was set to normal. To obtain the spectra, 100 μL of the concentrated elutes were placed on the ATR crystal.
Chemometrics
All chemical determinations were run in triplicate and values were averaged. Principal Component Analysis (PCA) was employed to examine the most important parameters that affect any grouping of samples (SPSS 21.0 SPSS, Inc). Discriminant analysis was performed using the JMP Statistical Discovery software, version 11. Spectral data (4000-500 cm-1) were exported to JMP, and Linear Discriminant Analysis (LDA) was performed using selected parts (fingerprint region) of the spectrum.
Results and Discussion
Variety discrimination based on phenolic composition
Phenolics are an important class of compounds widely used to categorize wines on the basis of changes in absorbance (A420, A520, A280). Hydroxycinnamic acids as well as procyanidins are compounds that show considerable differences between grape varieties [1].Varietal differences in phenolic composition of musts could be interpreted as being fundamentally due to genetically controlled variability in the distribution of phenolic components within grape berry structure [1]. The values of selected parameters can be significantly altered from year to year, especially as a consequence of climatic and environmental factors. To obtain results that are valid in the long term, it is necessary to include data obtained from more than one vintage in order to weigh the parameters according to their variability throughout the years.
An interpretation of wine differences, related to varietal origin is based on several multivariate statistical methods. Principal component analysis (PCA) is a frequently used method and has been successfully applied to the analytical results both for individual compounds and component combinations to establish differences among the grape varieties [3, 15, 22].
PCA was applied to all phenolic related data in order to determine the most important parameters that classify the selected red and white wines according to variety. Figures 1 and 2 present the projection of the variables and the wines onto the first two principal components (PC) for red and white wines respectively.
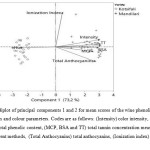 |
Figure 1: Biplot of principal components 1 and 2 for mean scores of the wine phenolic composition and colour parameters. Codes are as follows: (Intensity) color intensity, (Hue) color hue, (TP) total phenolic content, (MCP, BSA and TT) total tannin concentration measured with three different methods, (Total Anthocyanins) total anthocyanins, (Ionization index) phenolic index Click here to View figure |
The first PC explains 73.2% of the total variance and it opposes color hue with the rest measured parameters. The second principle component explains 14.7% of the total variance and opposes anthocyanin ionization index with the rest parameters. The PCA allows to discriminate wines analyzed into two groups based on the variety (Fig. 1).The wines made by Mandilari variety are situated on the right upper and lower parts of the diagram while the wines made by Kotsifali are well separated and located on the left part of the graph. Thus Mandilari wines are characterized by higher phenolic content and color intensity compared with Kotsifali wines which are characterized by higher color hue. Moreover, according to Table 1 TP, TT and color characteristics (Intensity and Hue) are the most critical parameters for the categorization of the wines based on the first principal component. Overall, wine phenolic content and color characteristics seem to be the determining parameter that could separate the samples according to the grape variety.
In earlier studies besides the anthocyanins also other phenolic components, in particular flavonoids, of various cultivars were investigated by liquid chromatography. The most outstanding differences in grape varieties were those occurring in the distribution of their flavan-3-ol contents [23]. Moreover, Sen and Tokatli (2014 and 2016) [5, 6] discriminated monovarietal wines from Turkey according to UV-visible spectra, color parameters and phenolic profiles and Heras-Roger et al., (2016) [4] classified Spanish wines based on their differences in phenolic profiles, and color intensity.
Table 1: Principal components 1 and 2 for mean scores of the wine phenolic and colour parameters
| Wine Parameters | Principal component 1 | Principal component 2 |
| Intensity |
0,94 |
0,20 |
| Hue |
-0,93 |
-0,02 |
| Total Plenols |
0,96 |
0,08 |
| TT |
0,96 |
0,03 |
| Ionization Index |
0,14 |
0,97 |
| Total Anthocyanins |
0,85 |
-0,41 |
| BSA |
0,91 |
-0,02 |
| MCP |
0,80 |
-0,13 |
Similarly the white varieties were separated according to variety (Figure 2).
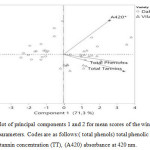 |
Figure 2: Biplot of principal components 1 and 2 for mean scores of the wine phenolic composition parameters. Codes are as follows:( total phenols) total phenolic content, (total tannins) total tannin concentration (TT), (A420) absorbance at 420 nm. Click here to View figure |
The first PC explains 71.3% while the second principle component 23.3% of the total variance and opposes A420 with total phenolic and tannin concentrations. The PCA allows to discriminate wines analyzed into two groups based on the variety (Fig. 1).The wines made by Vilana variety are situated on the right upper and lower parts of the diagram while most of the wines made by Dafni are well separated and located on the left part of the graph. Thus Vilana wines are characterized by higher total phenolic and tannin content compared with Dafni wines.
Moreover, according to Table 2 TP is the most critical parameter for the categorization of the wines based on the first principal component while A420 for the second. Overall, wine phenolic content seem to be the determining parameter that could separate the samples according to the grape variety.
Table 2: Principal components 1 and 2 for mean scores of the wine phenolic parameters
| Wine Parameters | Principal component 1 | Principal component 2 |
| Total Plenols |
0.93 |
-0,18 |
| TT |
0.89 |
-0.36 |
| A420 |
0.68 |
0.73 |
Variety discrimination based on FT-IR spectra
Wine authentication methods according to variety based on the phenolic content of the wines require relatively large amounts of pure samples and are expensive; FT-IR on the other hand recently proved successful in the differentiation of monovarietal wines providing information related to the chemical composition but also to the structure of polyphenols, requiring neither reagents nor high analysis cost. The possibility to make use of an economic, fast and easy to use analytical technique as FT-IR for discriminating purposes is a recent advance in the field of enology [1]. The traditional FT-IR instrumental set-up for analysis of complex enological matrices is Attenuated Total Reflectance (ATR) where the sample is dropped onto a crystal allowing the solvent to evaporate.
The PCA results presented previously indicated that the wines can be classified based on their different phenolic content. Varietal classification based on wine’s phenolic profile could be performed either using the full spectral range (4000-600 cm-1) or the fingertip region (1800-800 cm-1) according with the aromatic nature of phenolic compounds [24]. However, Louw et al., (2009) [25] excluded some spectral regions (5000-2970 cm-1; 1716-1543 cm-1) prior to multivariate analysis to avoid strong absorption of water and spectral features that are not strictly related to wine composition. In this work the “fingerprint” region of the spectrum was selected for further statistical analysis since absorptions in this region are caused mainly by bending and skeletal vibrations and contain information associated with phenolic compounds.
Linear Discriminant Analysis (LDA) was performed in order to categorize the wines. In LDA the number of categories and related samples are defined prior to analysis and the number of linear functions generated by the method is equal to the number of categories minus one. The functions correspond to new axes, with an enhancement in separation between groups [1].
Figures 3 and 4 demonstrate the discrimination according to the grape variety using the FT-IR data which was complete.
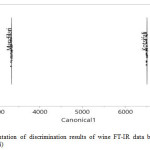 |
Figure 3: Representation of discrimination results of wine FT-IR data based on the variety (Kotsifali, Mandirali) Click here to View figure |
The first two canonical variables account for 99.9% of the variability. The two red varieties are well separated. Kotsifali wines are situated on the right part of the diagram while Mandilari wines are found on the left part of the graph.
Similarly the two white varieties were separated by LDA (Figure 4). Dafni wines are shown on the left part while Vilana samples on the right part of the graph.
The discriminant values obtained after the statistical analysis are shown in Table 3 and include the number and percentage of the samples that were misclassified and the negative log-likelihood, which is the negative sum of natural logs of the observed probabilities (small values of this function indicate better fit).
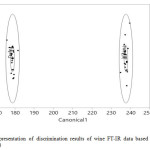 |
Figure 4: Representation of discrimination results of wine FT-IR data based on the variety (Dafni, Vilana) Click here to View figure |
Table 3: JMP discrimination results
|
Discrimination data |
Red Varieties |
White Varieties |
|
Number Misclassified |
0 |
0 |
|
Percent Misclassified |
0 |
0 |
|
-2LogLikelihood |
0 |
0 |
These results suggest that although the phenolic composition may be influenced by vinification, maturation and aging, the differences in the overall phenolic fingerprints might still be characteristic for each cultivar since the discrimination using specific spectral characteristics associated with chemical characteristics was possible.
For obtaining the phenolic extracts, solid-phase extraction (SPE) with C-18 columns and elution with methanol were performed. In this way the polar compounds are removed by rinsing from the SPE packing before the elution step. Using similar sample pretreatment step, Tarantilis et al., (2008) [13] discriminated three Greek red cultivars (Xinomavro, Agiorgitioko and Merlot) based on their FT-IR spectra. The separation was based on small differences between the spectra of their phenolic extracts. Pennington et al., (2006) [26] separated Merlot, Pinot Noir and Zifandel varieties while Cabernet Sauvignon samples were not correctly classified. Moreover, Cozzolino et al., (2003) [27] achieved a correct classification of 100% of Australian Riesling and up to 96% of Chardonnay wines while Louw et al., (2009) [25] classified South African wines (Pinotage, Merlot, Cabernet Sauvignon, Shiraz, Chardonnay and Sauvignon Blanc) based on their IR spectra and obtained a 98.3% correct separation. In addition, Bevin et al., (2007) [28] applied IR for varietal classification of three red and four white Australian wines using both PCA and LDA statistical analyses. The white wine samples achieved 91 % and 95% of correct classification rates while the red 90 % and 96%. In this study a complete (100%) discrimination was achieved for both red and white varieties.
Conclusion
The objective of the research proposed was to explore the suitability of FT-IR spectroscopy and chemometrics for wine authentication in terms of discrimination of four mono-varietal wines. For this reason their FT-IR spectra were recorded and several chemical parameters of the wines related to their phenolic content and color characteristics were measured. Principal Component Analysis of their chemical parameters indicated that the wines can be discriminated based on their different phenolic content. For this reason, the “fingerprint” region of the spectrum was selected for further Linear Discriminat Analysis and resulted in complete discrimination of the grape varieties. The proposed method is promising since it is simple, rapid and economical.
Acknowledgments
This research has been co‐financed by the European Union (European Social Fund – ESF) and Greek national funds through the Operational Program “Education and Lifelong Learning” of the National Strategic Reference Framework (NSRF) ‐ Research Funding Program: THALES. Investing in knowledge society through the European Social Fund.
References
- Versari A., Laurie V.F., Ricci A., Laghi L., Parpinello G.P. Progress in authentication, typification and traceability of grapes and wines by chemometric approaches. Food Research International, 60: 2-18:(2014).
CrossRef - Dourtoglou V., Antonopoulos A., Dourtoglou T., Lalas S. Discrimination of varietal wines according to their volatiles. Food Chem., 159:181-187:(2014).
CrossRef - Welke J.E., Manfroi V., Zanus M., Lazzarotto M., Alcaraz Zini C. Differentiation of wines according to grape variety using multivariate analysis of comprehensive two-dimentional gas chromatography with time-of-flight mass spectrometric detection data. Food Chem., 141:3897-3905:(2013).
CrossRef - Heras-Roger J., Diaz-Romero C., Darias-Martin J. A comprehensive study of red wine properties according to variety. Food Chem., 196:1224-1231:(2016).
CrossRef - Chen I., Tokatli F. Authenticity of wines made with economically important grape varieties grown in Anatolia by their phenolic profiles. Food Control, 46:446-454:(2014).
CrossRef - Chen I., Tokatli F. Differentiation of wines with the use of combined data of UV-visible spectra and color characteristics. Journaol of Food Composition and Analysis, 45:101-107:(2016).
CrossRef - Kennedy, J. Grape and wine phenolics: Observations and recent findings.Cientia e Investigation Agraria, 35(2):107-120:(2008).
CrossRef - Li Z., Pan Q., Jin Z., Mu L., Duan C. Comparison on phenolic compounds in Vitis vinifera cv. Cabernet Sauvignon wines from five wine-growing regions in China. Food Chem., 125(1):77-83:(2011).
CrossRef - Gris E.F., Mattivi F., Ferreira E.A., Vrhovsek U., Pedrosa R.C., Bordignon-Luiz M.,T. Phenolic profile and effect of regular consumption of Brazilian red wines on in vivo antioxidant activity. Journaol of Food Composition and Analysis, 31(1):31-40:(2013).
CrossRef - Jiang B., Zhang Z.W., Zhang X.Z. Influence of terroir on phenolic compounds and antioxidant activities of cabernet sauvignon wines in loess plateau region of China. Journal of the Chemical Society of Pakistan, 33(6):900-904:(2011).
- Burin V.M., Costa L.L.F., Rosier J.P., Bordignon-Luiz M.T. Cabernet Sauvignon wines from two different clones, characterization and evolution during bottle ageing. LWT-Food Science and Technology, 44(9):1931-1938:(2011).
CrossRef - Gallego M.G., Sanchez-Palomo E., Hermocin-Gutierez I., Vinas M.G. Polyphenolic composition of Spanish red wines made from Spanish Vitis vinifera L. red grape varieties in danger of extinction. European Food Research and Technology, 236(4):647-685:(2013).
CrossRef - Tarantilis P.A., Troianou V., Pappas C., Kotseridis Y., Polissiou M.G. Differentiation of Greek red wines on the basis of grape variety using attenuated total reflectance Fourier transform infrared spectroscopy. Food Chem., 111:192–196:(2008).
CrossRef - Liu L., Cozzolino D., Cynkar W.U., Dambergs R.G., Janik L., O’Neill B.K., Colby C.B., Gishen M. Preliminary study on the application of visible-near infrared spectroscopy and chemometrics to classify Riesling wines from different countries. Food Chem., 106:781–786:(2008).
CrossRef - Riovanto, R., Cynkar W.U., Berzaghi P., Cozzolino D. Discrimination between Shiraz wines from different Australian regions: the role of spectroscopy and chemometrics. J. Agric. Food Chem., 59: 10356–10360:(2011).
CrossRef - OIV, 1990. Récueil des méthodes internacionales d’analyse des vins et des moûts. Office Internacional de la Vigne et du Vin, Paris.
- Waterman P.G., Mole S. Analysis of phenolic plant metabolites. Blackwell Scientific Publ., Oxford, 83–91:(1994).
- Ribéreau-Gayon P, Glories Y, Maujean A, Dubourdieu D. Les composes Phénoliques. Chimie du vin. Stabilisation et traitements. Traité d’OEnologie, Vol. 2. Dunod, Paris, 163–237:(1998).
- Harbertson J.F., Piccioto E.A., Adams D.O. Measurement of polymeric pigments in grape berry extracts and wines using a protein precipitation assay combined with bisulfite bleaching. Am J Enol Vitic, 54: 301–306:(2003).
- Mercurio M.D., Smith P.A. 2008. Tannin quantification in red grapes and wine: comparison of polysaccharide- and protein-based tannin precipitation techniques and their ability to model wine astringency. J Agric Food Chem, 56: 5528–5537:(2008).
CrossRef - Edelmann A., Diewok J., Schuster K.C., Lendl B. Rapid Method for the Discrimination of Red Wine Cultivars Based on Mid-Infrared Spectroscopy of Phenolic Wine Extracts. J. Agric. Food Chem. , 49: 1139–1145:(2001).
CrossRef - Cozzolino, D., Cynkar W.U., Shan N., Smith P.Can Spectroscopy geographically classify sauvignon Blanc wines from Australia and New Zealand? Food Chem., 126:673-678:(2011).
CrossRef - Santos-Buelga C., Francia-Aricha E.M., Escribano-Bailón M.T. Comparative flavan-3-ol composition of seeds from different grape varieties. Food Chem., 53:197–201:(1995).
CrossRef - Cozzolino D., An overview of the use of infrared spectroscopy and chemometrics in authenticity and traceability of cereals, Food Res. Int., 60: 262–265:(2014).
CrossRef - Louw L., Roux K., Tredoux A., Tomic O., Naes T., Nieuwoudt E. et al. Characterization of selected South Africal young cultivar wines using FTMIR spectroscopy, Gas Chromatography and multivariate data analysis. J. Agric. Food Chem. , 57(7): 2623–2632:(2009).
CrossRef - Pennington N., Ni F., Mabud A., Dugar S. A simplified approach to wine varietal authentication using complementary methods: Headspace mass spectrometry and FTIR spectroscopy. In Susan G.R.T., Ebeler E., Winterhalter P. (Eds.) Authentication of food and wine, Washington , DC American Chemical Society, Vol 953:180-199:2006.
CrossRef - Cozzolino, D., Smyth H.E., Gishen M. Feasibility study on the use of visible and near-infrared spectroscopy to discriminate between white wine of different varietal origin. J. Agric. Food Chem., 52:7701-7711:(2003).
- Bevin C.J., Dambergs, R.G., Fergusson, A.J., Cozzolino D. Varietal discrimination of Australian wines by means of mid-infrared spectroscopy and multivariate analysis, Analytical Chimica Acta, 621:19-23:(2008).
CrossRef


Web of Science Coverage
Emerging Sources Citation Index (ESCI)
2024 Journal Impact Factor: 1.1
Scopus Journal Metrics
CiteScore 2025: 2.6
CiteScore Details
Sustainable Nutrition: Food Systems, Nutrient Retention, and Public Health Impact
![]()
This journal is a member of, and subscribes to the principles of, the Committee on Publication Ethics (COPE)


