Optimization and Quality Evaluation of Takha: A Nepalese Indigenous Meat Product
 , Dev Raj Acharya2, Kishor Rai1, Nabin Khadka1, Gaurav Gurung1, Angelo Maria Giuffrè3* and Anish Dangal4
 1Central Department of Food Technology, Tribhuvan University, Dharan, Nepal
2Department of Food Science and Nutrition, Zhejiang University, Hangzhou, China
3Department of AGRARIA, University of Studies “Mediterranea” of Reggio Calabria, Reggio Calabria, Italy
4Department of Agricultural Sciences, University of Naples Federico II, Portici, Italy
Corresponding Author Email: amgiuffre@unirc.it
DOI : http://dx.doi.org/10.12944/CRNFSJ.14.1.11
Download this article as:
![]()
Takha, an indigenous Newari meat product, is prepared from low-value cut-off parts of male buffalo (Bubalus bubalis), such as head meat, tail, bones, cartilage, and skin. This study aimed to optimize the proportions of raw materials (skin and bone), cooking time, setting time, and spices mix quantity. An experimental design was developed using Design Expert® v. 6.0.10, based on Response Surface Methodology and a Central Composite Face-Centered Design, incorporating variations in skin content (50–100%), bone content (0–50%), cooking time (2–6 h), and setting time (4–8 h). Following optimization, five takha samples were prepared with spice mix quantities ranging from 90 to 167 g/kg using mixture design and labeled as A (90.00 g/kg), B (109.25 g/kg), C (128.5 g/kg), D (147.75 g/kg), and E (167 g/kg). Sensory analysis preferred sample A as the optimized product, with a skin-to-bone ratio of 62.27:33.73. It was pressure-cooked for 3.5 h at medium heat using 90 g/kg of spices mix and refrigerated at 8 °C for 4 h. The optimized takha had 20.85% moisture, 79.15% total solids, 71.12% protein, 4.95% fat, 16.60% ash, 7.33% carbohydrates, 4.5% salt, and a pH of 6.45. Microbiological analysis showed that the product remained fresh for 14 days without preservatives, however, between 14 and 28 days, the total plate count increased excessively, with a coliform level of 2.373×10³ cfu/g.
KEYWORDS:Indigenous Food; Meat Product; Microbial; Nutritional Composition; Sanyakhuna; Sensory Evaluation; Takha; Thalthale
Introduction
The meat industry generates substantial quantities of by-products and co-products, such as blood, bones, skin, meat trimmings, fatty tissues, organs, viscera, horns, hoofs, feet, and skulls, during slaughtering and processing. Managing and disposing of these materials can be costly and challenging from an ecological perspective.1,2 Indigenous people used to utilize their indigenous knowledge to prepare food from locally available raw materials using their native technology for their preservation and storage, sustaining household food security.3 Adding value to meat by-products involves a level of innovation that transforms a potentially wasteful by-product into a raw material that can be further processed into consumer-desirable edible food items4 or economically profitable inedible products (e.g., plastics, pharmaceuticals, and energy).5,6 In the case of consumables, by-products of meat are a great source of minerals, vitamins, and essential amino acids.7-10 This presents a valuable opportunity for valorization in the meat industry.11
Ethnic meat products are the most valuable traditional, cultural, and commercial foods across various countries globally.12-14 These products play a significant role in the gastronomic and nutritional heritage of many nations and have been consumed for centuries.15 In recent years, traditional food items, including those based on meat, have seen a resurgence in consumer interest worldwide.16-19 This growing popularity is likely due to their unique sensory qualities, high quality, and natural composition.20,21 Consumers also believe that these products offer potential health benefits.22,23 Moreover, ethnic meat products are deeply intertwined with the culture, heritage, and local identity of the countries they originate from, giving them significant symbolic value. As a result, they contribute to the sustainability and development of rural areas.24
Takha, a Newa delicacy made from low-value parts of the buffalo, primarily the skin, flesh, and cartilage from the head, neck, and other less-utilized areas such as the tail. The term “takha” derived from the words “ta,” meaning chilled, and “kha,” meaning stuff, and is pronounced as takhala, where ‘la’ signifies ‘meat.’ Hence, takha refers to a chilled meat dish prepared from male buffalo using mainly low-value meat as a major ingredients and different spices are added to make the dish more palatable.25 The preparation involves boiling the meat in water with spices for several hours, followed by cooling overnight, which transforms the broth into a jelly-like texture. Structurally, takha comprises three distinct layers: a thin layer of fat on top, a pure jelly layer in the middle, and a meat stock layer at the bottom. It is also known as thalthale, a name that reflects its characteristic jelly-like consistency, which wobbles when touched.26 It is believed that this product was started with the aim of preserving the excess remaining of meat and utilizing byproducts.25
Sanyakhuna is a traditional side dish prepared from takha. During the preparation process, the thin upper fat layer of takha is removed, and the middle gelatinous portion is carefully separated without disturbing the underlying meat stock. This gelatin is then cooked with small dried fish (Sanya or Sidra), along with the addition of lemon juice or a locally known citrus juice called Jhamsi, and chili powder. The resulting product, known as Sanyakhuna, is distinguished by its characteristic hot and sour flavor and is typically consumed as a pickle-like accompaniment to rice.26
Similar to takha, other traditional meat products like brawn, meat extract, meat jellies,27,28 braised broth29 and headcheese30 are produced in different countries using low-valued parts of pigs, such as the skin, head, shank, heart, and tongue. These products primarily utilize collagen-rich portions of the pig, which are cooked for an extended period. During cooking, the collagen breaks down, releasing gelatin that binds the mass together as it cools, resulting in a solidified structure served cold.27,28 Meat jelly is an original cold-cut meat product,31 typically made from gelatin-rich meat by-products and lean meat.27 After stuffing with the required ingredients, meat jellies are cooked at 85 °C for 40 min until the core temperature reaches 75 °C. The jellies are then cooled at 4 °C for 24 h to allow gelation and stored in a 4 °C refrigerator.31
The edible offal of buffaloes, like heart, head meat, skin, blood, bone, liver, etc., are underutilized in contrast to lean meat.32 The reported values for buffalo skeletal meat include moisture content at 75.85%, protein at 19.84%, fat at 1.35%, ash at 1%, and calorific value at 95.37 kcal/100g. For buffalo head meat, the moisture content is 76.94%, protein is 19.25%, fat is 1.39%, ash is 0.95%, and calorific value is 94.52 kcal/100g. The pH levels are 5.85 for buffalo skeletal meat and 6.41 for buffalo head meat.33 Additional data report moisture content, ash, and protein in raw buffalo bone as 42.44%, 5.17%, and 20.20%, respectively.34 Buffalo bone, often discarded after meat processing, is a collagen-rich biomaterial.35 Similarly, buffalo skin is considered an underutilized source of gelatin.36 Collagen is primarily found in animal skin, bone, cartilage, tendons, and veins.37,38 During cooking, the collagen in buffalo skin and bone undergoes hydrolysis, releasing gelatin,39 which binds the mass together and solidified as it cools,27,28 resulting in soft texture and the jelly-like structure of the final takha product.
The optimal usage of these by-products is vital to sustaining an affordable and manageable buffalo meat production system, particularly in developing nations.32 Disposal of by-products and wastes is no longer feasible, especially when a huge number of valuable raw materials have considerable economic potential, and could be used to create new products and functional ingredients with significant added value.40,41 There has been no scientific study of takha and no documentation for the product has been recorded. It has a short shelf life of about a week. It is prepared mostly during the winter season, as this time has a favorable temperature for setting the product. Being an indigenous product, takha does not have a precise recipe or standardized process for its preparation. The preparation technique and ingredient selection differ by location, family, and restaurant. Consequently, product quality is inconsistent, varying from production batch to batch and from one locality to another. Thus, the aim of this study was to document the standard production process of this product, recipe ingredients, and shelf life. Additionally, this could help takha gain more acceptance and reputation in both domestic and global market places.
Materials and Methods
Materials
Buffalo’s head meat, skin, bones, cartilage, and tails were collected from Nebula Food Production Pvt. Ltd. and the nearby meat market in Dharan, Nepal (26.8065° N, 87.2846° E). Spices were sourced from the local market in Dharan. All chemical reagents and analytical equipment were obtained from the laboratories of Sunsari Technical College and the Central Department of Food Technology, Dharan, Nepal.
Methodology
Survey of takha
A field survey was conducted to collect information on various aspects of takha, such as its historical background, formulation, quality, sensory characteristics, and preparation process. Data were gathered using semi-structured questionnaires from respondents in different localities within the Kathmandu Valley (Kathmandu, Lalitpur, and Bhaktapur). Respondents, all randomly selected Newars familiar with the processing and consumption of takha, were interviewed in person at their homes and restaurants, as well as through telephone conversations. The questions covered various aspects of takha as outlined in the questionnaire provided in Appendix A.
A survey was undertaken utilizing semi-structured questionnaires (Appendix A), The data collection process involved personal interviews and telephone conversations with 50 individuals within the Newari community. The demographic distribution comprised 28 males and 22 females, all aged 20 years or older, with a specific focus on those aged 50 years and older.
Traditional method of preparation of takha
From the initial survey conducted, the ranges of ingredients used were identified, as bones 25-500 g, skins 500-1000 g and spices mix 90-150 g. The ingredients and quantities of spices for the spice mix formulation were obtained from the survey data and laboratory trials, as shown in Table 1.
Table 1: Spices mix ingredients formulation for Takha
|
Name of the spices |
Quantity (g) |
|
Turmeric |
4.50 |
|
Garlic powder |
7.00 |
| Onion powder |
10.00 |
|
Salt |
4.00 |
| Cumin powder |
8.50 |
|
Hot chilly |
5.50 |
| Black pepper |
3.00 |
|
Coriander |
6.00 |
|
Ginger powder |
5.00 |
| Clove powder |
1.00 |
|
Cardamom powder |
1.00 |
| Red chili powder |
5.50 |
|
Cinnamon powder |
5.00 |
| Fennel |
56.00 |
|
Chopped onion |
6.00 |
| Garlic paste |
5.00 |
|
Ginger paste |
15.00 |
| Soyabean Oil |
6.00 |
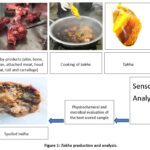 |
Figure 1: Takha production and analysis. |
Preparation of raw materials
The bones, adjoining meat, head meat, and cartilage were thoroughly washed with clean water and cut into desired sizes with a knife. Similarly, the skin and tail were lightly flamed to remove hair, then scraped with a sharp knife to remove any remaining hair. After thorough washing, they were sliced into small pieces and prepared for cooking. The traditional method of preparing takha is shown in Figure 1.
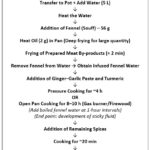 |
Figure 2: Flow chart of takha preparation |
Preparation of fennel water
The process begins by heating a dry, clean pot (called “Dipti” in Newari and “phosi” in the local language) over a high flame using a gas burner. Once the pot is hot, drinking water is added until it fills about two-thirds of the pot. Fennel seeds are then added and heated until the water takes on a greenish color. After removing the fennel seeds from the pot, the infused fennel water is used in the cooking of takha.25
Cooking of takha
The pressure cooker was preheated on a gas burner, and cooking oil was added and heated to the desired temperature. The raw materials, including skin and bones, were fried in the oil. Spices; turmeric, chili powder, one-third of the required salt, and garlic and ginger paste were added and briefly fried. After frying, infused fennel water was added, and the pressure cooker was covered, allowing the mixture to cook for about 4 h in mild temperature. Due to significant water evaporation, infused fennel water was added hourly to maintain consistency, with the frequency of additions increasing over time. The infused fennel water-to-ingredients ratio was 1:1. The mixture was stirred regularly and cooked until it reached a sticky consistency. The remaining spices like cumin, salt, bay leaf, hing, chili powder, meat masala, garam masala were then added, and cooked for an additional 10 min. The product was then transferred to small containers called “Yenpacha” and left to set overnight, resulting in takha.25
Experimental takha preparation process plan
The experimental process is segmented into four steps employing Response Surface Methodology (RSM). In the first experiment, the skin varied from 50% to 100%, and bone from 0% to 50%. The second experiment maintained a constant skin-to-bone ratio while varying cooking time from 2 to 6 h (Table 2), which is somewhat similar to the cooking of bone stock i.e. 5 to 10 h at temperature 100 to 110 42 and setting time from 4 to 8 h. In the third experiment, spices mix levels ranged from 90 g/kg of meat to 167 g/kg of meat (Table 3). These minimum and maximum ranges for the experimental process were determined using Design Expert® v. 6.0.10. The optimized skin to bone ratio, along with the optimized cooking and setting times, was combined with varying spice mix levels for the sensory evaluation of five samples, as shown in Table 4.
Table 2: Responses of the experimental plan for optimization of cooking and setting time
|
Std |
Run | Factor 1 | Factor 2 | Response* |
|
A: cooking time |
B: setting time |
M.C (%) |
||
| 1 | 10 | 2 | 4 |
5.94 |
|
2 |
12 | 6 | 4 | 7.79 |
| 3 | 8 | 2 | 8 |
7.96 |
|
4 |
6 | 6 | 8 | 5.47 |
| 5 | 1 | 2 | 8 |
6.01 |
|
6 |
9 | 6 | 6 | 8.42 |
| 7 | 7 | 4 | 4 |
8.62 |
|
8 |
1 | 4 | 8 | 7.86 |
| 9 | 3 | 4 | 6 |
7.50 |
|
10 |
5 | 4 | 6 | 7.60 |
| 11 | 2 | 4 | 6 |
8.71 |
|
12 |
4 | 4 | 6 | 8.79 |
| 13 | 11 | 4 | 6 |
7.75 |
Out of the five samples, one was identified as the optimized sample based on sensory analysis conducted using a 9-point hedonic rating scale. The optimized takha underwent further analysis to evaluate its physicochemical properties and study its shelf life under refrigeration.
Table 3: Responses of the experimental plan for optimization of spices mix
|
Samples |
Std | Run | Factor 1 | Response 1 | Respond 2 | Respond 3 |
| A: spices | M.C. % | Salt % |
pH |
|||
|
A |
2 | 1 | 90 | 12.1 | 3.53 | 6.53 |
| B | 1 | 7 | 90 | 12.08 | 3.03 |
6.50 |
|
C |
3 | 4 | 109.25 | 12.23 | 4.35 | 6.07 |
| D | 5 | 2 | 128.50 | 9.25 | 4.53 |
6.53 |
|
E |
4 | 6 | 128.50 | 9.38 | 4.63 | 6.03 |
| F | 6 | 8 | 147.75 | 8.14 | 5.63 |
5.83 |
|
G |
7 | 3 | 167 | 8.35 | 5.02 | 6.88 |
| H | 8 | 5 | 167 | 7.28 | 5.09 |
6.87 |
Responses were measured in terms of moisture content as a percentage (%), salt content as a percentage (%), and pH on a scale ranging from 0 to 14.
Analytical methods
Moisture content, Crude Fat, Crude Protein, ash was determined by as described in AOAC.43 Carbohydrate and the total solid content in the sample was calculated as described in Rangana.44 The salt content of the sample was determined by method given by Subba.45 The pH of the takha homogenate was measured using a pH meter, following the method described by Kim, Yong.46
Total plate count and Total coliform count
The total plate count was determined by the pour plate method according to Mhone, Matope, and Saidi,47 using plate count agar. The total coliform count was done by the pour plate technique as given by Mhone, Matope, and Saidi,47 using violet red bile salt agar.
Sensory evaluation
Five different sample shown in Table 4 were subjected to sensory analysis. The sensory assessment of the product was performed using a 9-point hedonic scale.44 35 students and teachers (age group of 22 to 55 years, in which 15 were male and 20 were female) were randomly selected from the Central Department of Food Technology, the Central Campus of Technology, and Sunsari Technical College, Dharan, who had prior experience in sensory analysis, were on the panel. Each member of the sensory panel was provided with a sensory scorecard and prepared product samples. They were asked with evaluating the sample items based on quality attributes such as texture, taste, appearance, juiciness, and overall acceptability.
Table 4: Formulation of sample for sensory analysis
|
Sample code |
Skin : Bone | Spices mix (g/kg sample weight) | Cooking time (h) | Setting time (h) |
| A | 62.27:33.73 | 90.00 | 3.50 |
4 |
|
B |
62.27:33.73 | 109.25 | 3.50 | 4 |
| C | 62.27:33.73 | 128.5 | 3.50 |
4 |
|
D |
62.27:33.73 | 147.75 | 3.50 | 4 |
| E | 62.27:33.73 | 167.00 | 3.50 |
4 |
Statistical analysis
Design Expert Version 6.0.10 (State-ease, Minneapolis, MN) was used for experimental design and product optimization with response surface methodology (RSM). RSM was applied for the development, process improvement and optimization. The collected data was statistically analyzed using computerized analysis of variance (ANOVA) using IBM-SPSS 16 for sensory analysis at each stage of the experiment, with an emphasis on formulation and process parameter optimization. Moisture, salt, and pH were the response factors for all samples. The mean sensory ratings were compared using Tukey’s HSD post hoc test at a 5% significant level. All analyses were done in triplicate, and the findings were provided as mean ± standard deviation.
Results
Results of the survey
People of all the age group (both male and female) knew about the origin of takha, except five responded aged below 30 were unknown about its origin and history behind it. According to information collected from all the respondents, takha originated from the valley, presently Kathmandu, Bhaktapur, and Lalitpur Districts of Nepal. Takha is pronounced as ‘takhala’ by Newars, and is also known by another name i.e., ‘thalthale’. Most of the respondents said that male buffalo’s low-value cut-off parts were used for the preparation of takha. The majority of respondents preferred a higher skin-to-bone ratio as a major ingredient with soft texture and jelly structure resulting from gelatin developed by hydrolysis of skin. A few respondents mentioned that takha can be made from low-value cut-off parts of goat. Based on the survey data traditional method for preparing takha is shown in Figure 2.
The method applied for the preparation of takha was similar in all the locations, but the selection and quantity of spices used varied in restaurants and at home. The reason behind this was the choice and preference of the individuals at the household level. The preparation of takha was not limited to households; it had a very impressive impact in restaurants and on a commercial level too. In restaurants, additional spices such as chili powder, clove, black pepper, cinnamon, fennel, meat masala, and garam masala from different brands were commonly used. As noted by Yao, Xu,29 these spices not only enhance flavor but also provide antioxidant benefits, including radical scavenging and metal-chelating properties, which help prevent the oxidation of lipids and proteins. Most of the respondents stated that the shelf life of takha can be prolonged by storing it under refrigeration. They also claimed that syneresis and hardening of gel are common defects due to incomplete and overcooking of the product.
Optimization of skin and bone
In the laboratory, raw ingredients for takha were optimized using the experimental approach given in Table 5. The proportion of skin and bone used for cooking takha has a significant role in the gelling and setting properties of the final product. The goal for raw material optimization was to maximize the amount of skin while minimizing the amount of bone using Design Expert®. The target was to maximize moisture content and minimize pH during these responses.
Table 5: Responses of experimental plan for optimization of skin and bone
|
|
Component 1 | Component 2 | Response 1 |
Response 3 |
|
Run |
A: skin | B: bone | Moisture content (%) |
pH |
|
1 |
50 | 50 | 8.54 | 6.80 |
| 2 | 75 | 25 | 10.60 |
8.00 |
|
3 |
87.50 | 12.50 | 8.40 | 7.80 |
| 4 | 100 | 0 | 9.89 |
7.40 |
|
5 |
100 | 0 | 9.85 | 7.20 |
| 6 | 50 | 50 | 9.98 |
6.90 |
|
7 |
75 | 25 | 9.89 | 7.90 |
| 8 | 62.50 | 37.50 | 10.85 |
7.50 |
Illustrates the desirability of the skin-to-bone ratio. The curve shows initial sharp increase in desirability, reaching a predictor value of 0.46, then gradually decreases to a certain point, followed by another rise in desirability. Based on the applied constraints, the model produced a solution with a desirability score of 0.825.
Evaluation of responses
Moisture content
Table 6 presents the model coefficients and other statistical parameters for moisture content.
Table 6: ANOVA for quadratic model for moisture of skin and bone
|
Source |
Sum of Squares | df | Mean Square | F-value | p-value | |
| Model | 3.78 | 3 | 1.26 | 3.26 | 0.1416 |
not significant |
|
⁽¹⁾Linear Mixture |
5.556E-06 | 1 | 5.556E-06 | 0.0000 | 0.9972 | |
| AB | 0.4041 | 1 | 0.4041 | 1.05 |
0.3640 |
|
|
AB(A-B) |
3.37 | 1 | 3.37 | 8.74 | 0.0417 | |
| Residual | 1.54 | 4 | 0.3859 | |||
|
Lack of Fit |
0.2541 | 1 | 0.2541 | 0.5911 | 0.4980 | not significant |
| Pure Error | 1.29 | 3 |
0.4299 |
|||
|
Cor Total |
5.32 | 7 |
The regression analysis applied to the experimental moisture content data resulted in a non-significant model F-value of 3.26. The probability of obtaining F-value due to random variation was 0.5911. The model’s goodness of fit also indicated by the coefficient of determination (R2=0.7099. The adjusted R² value and the predicted R² value is 0.49 and 0.21 respectively.
The coded equation provides beneficial in discerning the relative influence of the factors through comparison of the factor coefficient, given in equation [1].
Moisture content (%) = +9.83471*A + 9.22*B +2.01*A*B -14.69*A*B* [1]
Where, A and B indicates skin and bone respectively. R2 for actual components was found to be 0.709%.
Presents a simplified graphical representation, with the skin-to-bone ratio plotted on the X-axis and moisture content on the Y-axis. The maximum moisture content was observed at a skin-to-bone ratio of 62.50:37.50, making this formulation the preferred choice for the desired product. This implies that moisture content of takha is affected by ratio of skin and bone used.
pH
Table 7 displays the model coefficient and other statistical parameter for pH.
Table 7: ANOVA for Quadratic model for pH of skin and bone
|
Source |
Sum of Squares | df | Mean Square | F-value |
p-value |
|
|
Model |
1.38 | 2 | 0.6890 | 84.47 | 0.0001 | significant |
| ⁽¹⁾Linear Mixture | 0.2450 | 1 | 0.2450 | 30.04 |
0.0028 |
|
|
AB |
1.13 | 1 | 1.13 | 138.90 | < 0.0001 | |
| Residual | 0.0408 | 5 | 0.0082 | |||
|
Lack of Fit |
0.0108 | 2 | 0.0054 | 0.5392 | 0.6309 | not significant |
| Pure Error | 0.0300 | 3 | 0.0100 | |||
|
Cor Total |
1.42 | 7 |
The regression analysis of the experimental pH revealed a non-significant model F-value of 84.47, with a probability of 0.5392%. The model’s goodness of fit was demonstrated by a coefficient of determination (R²) having value 0.97. Additionally, the adjusted R² value and the predicted R² value 0.96 and 0.92 respectively confirm that the model fits the data well.
The coded equation provides beneficial in discerning the relative influence of the factors through comparison of the factor coefficient, given in equation [2].
pH = +7.30196*A + 6.84 *B + 3.37*A*B [2]
Shows the variation in pH having different skin-to-bone ratio used in the formulation. The curve illustrates a gradual increase in pH, reaching its maximum at 75:25 skin to bone ratio. Beyond this point, the pH level gradually decreases as the amount of bone is reduced and the amount of skin is increased.
Optimization of cooking and setting time
When setting the objectives in Design Expert®, the goal was to minimize the total preparation time while maximizing the moisture content. Design Expert® generated the predicted data with the highest desirability among various factors and physicochemical responses.
Evaluation of response
Moisture content
In this case of final moisture content, no significant difference (P>0.05) was observed due to the initial skin and bone ratio. Table 8 displays the model coefficient and other statistical parameter for moisture content.
Table 8: ANOVA for Quadratic model for moisture (cooking and setting time)
|
Source |
Sum of Squares | df | Mean Square | F-value |
p-value |
|
|
Model |
10.01 | 5 | 2.00 | 3.16 | 0.0826 | not significant |
| A-cooking | 0.5221 | 1 | 0.5221 | 0.8253 |
0.3938 |
|
|
B-setting |
0.1873 | 1 | 0.1873 | 0.2960 | 0.6033 | |
| AB | 4.71 | 1 | 4.71 | 7.44 |
0.0294 |
|
|
A² |
3.60 | 1 | 3.60 | 5.70 | 0.0484 | |
| B² | 0.0380 | 1 | 0.0380 | 0.0600 |
0.8135 |
|
|
Residual |
4.43 | 7 | 0.6327 | |||
| Lack of Fit | 2.85 | 3 | 0.9508 | 2.41 |
0.2071 |
not significant |
|
Pure Error |
1.58 | 4 | 0.3940 | |||
| Cor Total | 14.44 | 12 |
The regression analysis of the experimental moisture content resulted in a non-significant model F-value of 3.16, with a probability of 2.41. The model’s goodness of fit was indicated by a coefficient of determination (R²) with the value 0.69. The adjusted R² value is 0.47 and the predicted R² is 1.11 which suggest that the model fit is adequate.
The coded equation provides beneficial in discerning the relative influence of the factors through comparison of the factor coefficient, given in equation [3].
Moisture content (%) = +8.15+0.29*A-0.1767*B-1.08*A*B-1.14*A2-0.1172*B2 [3]
Where, A and B indicates cooking and setting time respectively. Presents a 3D plot with cooking time and setting time against the moisture content. The graph displays the highest moisture content at the center of the plot, indicating that optimal moisture levels are achieved under tested conditions. From this figure, it can be inferred that maintaining cooking and setting times between 3.5 and 6 h, respectively, results in the desired product with maximum moisture content.
Optimization of spices mix
To optimize the spices mix, Design Expert® generated eight formulation labeled A to H, as shown in Table 4. The optimization process considered three key responses: moisture content (R1), salt content (R2), and pH (R3). The goal was to maximize R1 and R3 while minimizing R2 as presented in Table 11. Out of these, five samples (A to E) were selected based on responses which are detailed in Table 5. To establish the optimal solution for the given criteria, numerical and graphical optimization were carried out using Design Expert®, as well as sensory analysis by panelists.
Evaluation of responses
Moisture content
The change in moisture content was statistically significant (P<0.05). Table 9 displays the model coefficient and other statistical parameter for moisture content.
Table 9: ANOVA for Quadratic model for moisture (spices mix)
|
Source |
Sum of Squares | df | Mean Square | F-value | p-value | |
|
Model |
24.95 | 1 | 24.95 | 48.06 | 0.0004 | significant |
| A-spices | 24.95 | 1 | 24.95 | 48.06 |
0.0004 |
|
|
Residual |
3.11 | 6 | 0.5191 | |||
| Lack of Fit | 2.53 | 3 | 0.8444 | 4.36 | 0.1289 |
not significant |
|
Pure Error |
0.5811 | 3 | 0.1937 | |||
| Cor Total | 28.06 | 7 |
The regression applied to experimental moisture content revealed non-significant model F-value of 48.06. The probability of such high model F-value occurring due to random variation was 4.36%. The model’s goodness of fit was also indicated by the coefficient of determination (R2 = 0.89). The adjusted R2 value and the predicated R2 value was 0.81 and 13.07 respectively.
The coded equation provides beneficial in discerning the relative influence of the factors through comparison of the factor coefficient, given in equation [4].
Moisture content (%) = +9.87 -2.31*A [4]
Where, A indicates spices mix.
Salt content
In this case, there was a significant difference in the amount of salt used (P<0.05). Table 10 displays the model coefficient and other statistical parameter for moisture content.
Table 10: ANOVA for Quadratic model for moisture (spices mix) salt content
|
Model |
4.50 | 2 | 2.25 | 21.18 | 0.0036 |
significant |
|
A-spices |
3.90 | 1 | 3.90 | 36.71 | 0.0018 | |
| A² | 0.6003 | 1 | 0.6003 | 5.65 |
0.0634 |
|
|
Residual |
0.5313 | 5 | 0.1063 | |||
| Lack of Fit | 0.3989 | 2 | 0.1994 | 4.52 | 0.1245 |
not significant |
|
Pure Error |
0.1324 | 3 | 0.0441 | |||
| Cor Total | 5.03 | 7 |
The regression applied to salt content revealed non-significant model F-value of 21.18. The probability of model F-value occurring due to random variation was 4.52%. The model’s goodness of fit was also indicated by the coefficient of determination (R2), suggesting that 89.44% of the response variability could be explained by the model. The adjusted R2 value and the predicated R2 value were 0.85 and 0.76.
The coded equation provides beneficial in discerning the relative influence of the factors through comparison of the factor coefficient, given in equation [5].
Salt content (%) = +4.82 +0.9311*A – 0.6137*A2 [5]
pH
The pH was not significantly different (P>0.05). The graphical representation for desirability and responses; moisture content, salt content and pH are given in.
Table 11: Constraints for spices mix
|
Name |
Goal | Lower Limit | Upper Limit | Lower Weight | Upper Weight |
Importance |
|
A:spices |
minimize | 90 | 167 | 1 | 1 | 3 |
| R1 | maximize | 7.28 | 12.23 | 1 | 1 |
3 |
|
R2 |
minimize | 3.03 | 5.63 | 1 | 1 | 3 |
| R3 | maximize | 5.83 | 6.88 | 1 | 1 |
3 |
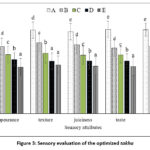 |
Figure 3: Sensory evaluation of the optimized takha |
Sensory evaluation of takha
Appearance refers to the visual attributes of the product that draws the customer’s discernment. The mean appearance scores of five samples differed considerably (P<0.05). The average sensory score for the appearance of were in decreasing order from sample A to E (Figure 3). Preference by panelist decreased with increasing amount of curry blend which may be due to yellowish hue observed in the product.
Texture rating decreased with higher amount of curry blend (Figure 3). Samples D and E were non- significant difference (P>0.05) whereas the other samples exhibited significant differences (P<0.05) in texture perception. Sample A received highest mean score for texture which may be due to low amount of curry blend added. Reduction is moisture content with the increasing levels of spice mix and salt (Table 4). Salt activates the meat protein to increase hydration and water holding capacity (WHC). Samples A with lowest curry blend had highest rating while, sample E with highest amount of curry blend had lowest sensory ratings (Figure 3). all sample differed statistically from one another (P<0.05)
Taste scores for samples A, B, C, D, and E were 8.28, 6.68, 6.08, 5.57, and 5.08, respectively (Figure 3). Indicating differences (P<0.05) across all samples. Turmeric contains a colored component called curcumin.48 A high amount of turmeric has a bitter taste and a pungent and characteristic odor. It contains ketonic sesquiterpenes turmerones, which is responsible for the bitter and distinctive taste and aroma of the product.49
Samples A had highest mean sensory ratings for overall acceptability while E had lowest (Figure 3). The spice mix and mixing percentage in the product had a substantial (P<0.05) effect on overall approval.
Sample A received the highest sensory preference, which can be attributed to its lower proportion of spice mix. With increasing spice mix levels in the samples, sensory appeal declined, reflecting the panelists reduced preference (Figure 3).
Physicochemical analysis of takha
The physicochemical composition of the optimized product is given in Table 12.
Table 12: Physicochemical composition of takha (Dry basis)
|
Parameters |
Optimized product (Sample A) |
|
Moisture (%) |
20.85±0.47 |
| Protein (% db) |
71.12±0.42 |
|
Fat (% db) |
4.95±0.42 |
| Total Ash (% db) |
16.60±1.04 |
|
Carbohydrate (% db) |
7.33±0.18 |
| Total solid (%) |
79.15±0.47 |
|
Salt (%) |
4.50±0.81 |
| pH |
6.45±0.57 |
* The values in the above table represent the means of triplicates ± standard deviation.
Microbiological analysis of optimized takha
The microbial counts of optimized takha under refrigeration conditions at 8 °C were measured in log 10 cfu/g over a storage period of 1–28 days, as displayed in Table 13. It had been observed that there was no growth of total plate count (TPC) and coliform on takha from the 1st day to 14th day of storage.
Table 13: Shelf-life study of takha
|
Time period (Days) |
Total plate count (cfu/g) |
Coliform (cfu/g) |
|
1 |
Nil | Nil |
| 7 | Nil |
Nil |
|
14 |
Nil | Nil |
| 20 | 1.65×10⁴±0.0252 |
5.37×10²±0.1530 |
|
22 |
3.64×10⁵±0.0208 | 1.267×10³±0.0208 |
| 28 | Too many to count (TMTC) |
2.373×10³±0.0929 |
| *The values in the above table are the mean of the triplicates ± standard deviation | ||
Discussion
Optimization of skin and bone
Laboratory optimization using Design Expert showed that skin to bone ratio had major role in identifying physicochemical attributes of takha. During optimization of skin and bones, there was increased in moisture content (11.01%), which is attributed to the use of higher amount of skin to bone (Table 3) and addition of water during cooking of the product. Despite these changes, no significant difference (P > 0.05) was observed in the final moisture content determined by the Design Expert®.
pH used as respondent has the great influence on the firmness of gel which is the critical factor for the consistency of final product. The strength of the gel is similarly affected by pH, as the presence of H+ ions interferes with gel formation, with the degree of interference depending on the amount of acid present27 notes that vinegar is often added to brawn and meat jelly to lower the pH of the final product, which not only reduces the pH but also enhances the product’s stability. In this study, the linear mixture component AB (eq. 2) showed a significant difference in pH (P<0.05).
An optimum ratio of skin: bone; 66.27:33.73 with desirability score of 0.825 with predicted moisture content of 11.02% and pH 7.72 was obtained from the constraints used.
Optimization of cooking setting time
The fuel used and the total processing time are critical from an economic standpoint for takha preparation. Illustrated the most desirable outcome is achieved when both cooking and setting times are minimum. It also shows that higher predictor values from the experimental design correlate with increased desirability. The Design Expert provided a distinct solution within the given constraints, with a predicted desirability of 0.76. The optimized cooking time of 3.54 h and setting time of 4 h having moisture content of 7.83% and a desirability score of 0.75 was selected.
The moisture content of the final product is crucial for determining its texture, juiciness, and firmness. When heated in the presence of water and salt, the protein structure opens up and traps water, forming a gel structure. Additionally, the amount of free water in the final product plays a key role in its stability.27
According to Pearson50 the final meat extract should have a moisture ranging from 18.8 to 19.95%, however the optimized takha from experimental data, showed the moisture content of 7.83%. The difference is attributed to the initial amount of water added and the heat applied during cooking. High temperatures and pressures lead to structural changes in the meat, reducing its WHC. The most substantial water loss occurs during cooking due to shrinkage, where water is expelled from the shrinking connective tissues into the extracellular spaces under pressure.51 Du, Qi,52 also reported, that exposure to high temperatures leads to cross-linking of myofibrillar proteins and contraction of sarcomeres, along with the breakdown and solubilization of collagen. These changes result in water loss, which eventually evaporates during the cooking process.
Optimization of species
The spices significantly increased the moisture content and salt concentration but has minimum effect on pH. Design Expert showcase the optimal spice mix of 90 g/kg, corresponding to 12.20% moisture, 3.28% salt and pH 6.53 with desirability of 0.88. This represents a slight increase in moisture compared to the moisture observed in products from the skin and bone optimization phase. The increase in moisture content could be attributed to the addition of the spice mix, which contains water and low molecular weight compounds such as sugars, acids, and amino acids.27 A slight increase in salt content may be due to the addition of salt and low quantity of salt presents within the spices.27
Sensory analysis
The color change is linked to the presence of pigments such as curcumin in turmeric, and S-allyl-L-cysteine sulfoxide in ingredients like garlic and ginger.53 Higher the amount of curry blend used; lesser was the preference by panelists. Use of colored components like turmeric and black pepper powder may be responsible for its less desirability.49 Color is also strongly influenced by processing conditions. According to McEvoy54 the use of high processing temperatures causes the natural color of meat to fade or change from gray to brown, with the Maillard reaction playing a key role in the development of brown color. Similar findings were reported by Van Boekel.55
An increase in WHC reduces cooking loss, thereby increasing tenderness. Salt is a critical factor that contributes to the texture of processed meat products.56 The product sets when cooled to a low temperature due to the presence of gelatin.54 Gelatin has a polar amino acid group with a hydrophilic property, which helps to bind the water, improving its texture.57 An increase in curry blend content in the product reduced the preference of panelists.58
Juiciness is affected by water holding capacity (WHC). WHC is affected by salt content27 and gelatin.57 The higher the spice content, the lower the moisture content (Table 4), affecting the juiciness of the product. An increase in the level of salt and curry blend in the product and a downward trend was observed in the juiciness score by the panelists. This study showed the same result as reported by Deogade, Zanjad.58
The decrease in taste score when increasing the spice mix in the sample could be attributed to the higher amount of salt, ginger, and garlic in the blend, which plays a part in off-putting flavor to the product. The similar result was reported by Meher and Meher53 and Deogade, Zanjad.58 Addition of spices increases the flavor components and improves the final taste of the product.59
A consistent decline in the sensory scores was noted as the amount of spice mix increased. Panelists expressed a preference for lower amounts of spice mix, indicating a decrease in preference as the spice mix amount increased. The similar pattern was observed by Meher and Meher53 and Deogade, Zanjad.58 Fat, protein, amino acid, sodium chloride and various spices extracts affect the overall quality of the final product.29
Physicochemical analysis of takha
The moisture content of takha was found to be 20.85%, which is similar to that of meat extract (16% or 19.5%) reported by Ockerman and Basu,60 but significantly lower than the moisture content reported by Kim, Park31 for duck meat jellies (74.59-76.37%) and by Kim, Yong,61 for cold cut duck meat jelly (76.19%). The variation in moisture content between these products is largely due to differences in cooking time and temperature. Duck meat jellies and cold cut duck meat jelly were cooked at 85 °C for 40 min, whereas takha was pressure-cooked for about 4 h until it achieved a sticky consistency.
The total solid content of takha was found to be 79.15%, which is higher than the 65% total solids reported by Pearson50 in mutton extract. Similar results were obtained by MLA,42 where meat stock contained approximately 66% ± 3% total solids. The protein content of takha was found to be 71.12%, which is significantly higher than the 20.87-22.67% protein content reported by Kim, Park31 in duck meat jellies. A similar observation was made by Kim, Yong,61 who reported 11.31% protein in cold cut duck meat jelly. The elevated protein content in takha may be attributed to the production of gelatin through the hydrolysis of collagen present in the skin and bones, both of which are rich in gelatin.62
The fat content of takha was found to be 4.95%, which is higher than the 1.75-1.96% fat content in duck meat jellies as reported by Kim, Park, Yeo, Hwang, Song, Kim, Ham, Jeong, Choi and Kim31 but comparable to the 3.86% fat content reported by Kim, Yong,61 in cold cut duck meat jelly. The increased fat content in takha is likely due to the addition of oil during cooking.
The ash content of takha was found to be 16.60%, which is significantly higher than the 0.94-1.08% ash content reported by Kim, Park31 in duck meat jellies and the 2.17% ash content in cold cut duck meat jelly reported by Kim, Yong.61 The increased ash content in takha is likely attributed to the addition of spices and the inherent ash content in bones, which is typically around 5.17%.34 In contrast, the ash content in skin is 0.72%,63 and in head meat, it is 0.95%.33
The brawn product contains approximately 2–2.2% salt, while meat jellies typically have around 1.6–1.8% salt,27 which is lower than the 4.5% salt content found in takha. The high salt content in takha may be due to the addition of common salt in curry blends. The salt content of bone stock has been reported to be 12%, which is higher than the value obtained in this study. This difference may be due to addition of external salt during blending of the stock with other ingredients, which is further concentrated using evaporator.42 The World Health Organization recommends a maximum daily salt intake of 5 g for adults,64 while guidelines in several countries, including the UK and US, suggest a daily intake of 6 g.65,66
The pH of the optimized takha was found to be 6.45, which is similar to the findings by Kim, Yong,61 i.e., 6.24 pH in cold-cut duck meat jelly, but slightly higher than the pH range of 4.6–5 reported by Feiner27 for similar products like brawn and meat jelly. This difference is likely due to the addition of vinegar in brawn and meat jelly, which improves taste, gel strength, and shelf life by increasing acidity, a practice not employed in takha.
Microbial analysis
This might be due to the antimicrobial and antifungal properties of the individual spices and the synergistic effect of the 18 different ingredients used in its preparation. Garlic, known for its strong antibacterial, antiviral, antifungal, and antiprotozoal properties, plays a significant role in inhibiting microbial growth.67 Additionally, various spices such as clove, oregano, thyme, cinnamon, and cumin have been experimentally proven to possess antimicrobial activities against both pathogenic and spoilage fungi and bacteria.68,69 Recent studies further support that these spices exhibit significant antibacterial and antifungal activities against food spoilage bacteria like Bacillus subtilis and Pseudomonas fluorescens, pathogens such as Staphylococcus aureus and Vibrio parahaemolyticus, and even antibiotic-resistant microorganisms, including methicillin-resistant Staphylococcus aureus.70,71
The study conducted by Grohs and Kunz72 found that a spice mixture containing coriander exhibited inhibitory effects on the growth of several meat-spoiling microorganisms, including Bacillus subtilis, Enterococcus spp., Staphylococcus spp., E. coli K12, and Pseudomonas fluorescens. This spice mixture also contributed to stabilizing the color and smell of freshly portioned pork meat. According to Gupta and Ravishankar73 pure pastes of ginger, garlic, and turmeric demonstrated higher antimicrobial activity against E. coli O157 compared to what was observed in beef. This suggests a partial decrease in the bactericidal effectiveness of the extracts when integrated into a food system. Ginger extracts have also been noted for their proteolytic properties, which enhance their antimicrobial effectiveness against both Gram-negative and Gram-positive pathogens, including E. coli and L. monocytogenes.74
By the 20th day, the total plate count (TPC) and coliform levels in the product reached 1.65×10⁴ cfu/g and 5.37×10² cfu/g, respectively. Following this period, there was a marked rise in both TPC and coliform counts. When stored at the same refrigeration temperature without a container cover for 22 days, the product developed a distinct white, slimy layer on the surface, along with structural damage and a strong, unpleasant odor. By the end of the 28-day observation period, the optimized takha exhibited total plate and coliform counts too numerous to count (TMTC), reaching 2.373×10³ cfu/g. This increase is likely due to elevated water activity (aw) and a decrease in the product’s pH during storage. A similar outcome was observed by (Paulsen, Awaiwanont, & Smulders,75 where vacuum-packed meat jelly stored at 8 °C showed Listeria monocytogenes levels exceeding 1.5 log₁₀.
The TPC and coliform counts in our findings exceeded the standard acceptable limits mentioned in the study by Kumari, Kumar and Gupta76 who reported that the coliform count and total viable count of ready-to-eat meat should not be acceptable greater than 100 cfu/g and ≥104 cfu/g, respectively, according to the International Commission on Microbiological Specifications for Foods and the Food Safety and Standards Authority of India. The elevated microbial counts and signs of spoilage may be due to increased water activity and decreased pH during storage,75 as well as potential unhygienic practices during storage and handling. Bryant, Brereton Bryant, Brereton and Gill77 identified the sources of contamination, such as workers hands and equipment. Based on these observations, it is recommended that takha be stored at a refrigeration temperature of 8 °C and be safe for consumption for up to 14 days
Conclusion
This study documented the indigenous knowledge, preparation and processing of takha. Meat jelly consumed by Newar community. The product is produced from low value cut off parts of male buffalo, some uses goat offals too. The study revealed that the optimal formulation for takha, using a skin-to-bone ratio of 66.27:33.73, cooked for 3.54 h with a curry blend of 90 g/kg, and set at 8 °C for 4 h, produced a product with favorable sensory characteristics and nutritional value. Both sensory and analytical results indicated that the lower spice mix (90 g/kg) was preferred. The product also demonstrated a shelf life of 14 days, indicating it is safe for consumption within this period. To improve the shelf life of takha, it should be prepared under hygienic conditions while maintaining a storage temperature ideally between 0°C and 4°C. Additional measures such as vacuum packaging, the use of natural preservatives or coatings, reducing water activity, and adjusting pH with natural acidulants such as lemon juice or vinegar can also be considered. Further research can be done to evaluate the shelf life of takha through the application of novel packaging technologies, and exploring edible offal from other animal sources to diversify this indigenous product.
Acknowledgement
The authors acknowledge Central Department of Technology (CDFT), Tribhuvan University, for making all the requirement materials accessible.
Funding Sources
The author(s) received no financial support for the research, authorship, and/or publication of this article.
Conflict of Interest
The authors do not have any conflict of interest.
Data Availability Statement
Data will be provided on request from the corresponding author.
Ethics Statement
This research did not involve human participants, animal subjects, or any material that requires ethical approval.
Informed Consent Statement
The semi-trained panelist included 35 students and teachers (age group of 22 to 55 years, in which 15 were male and 20 were female) were randomly selected from the Central Department of Food Technology, the Central Campus of Technology, and Sunsari Technical College, Dharan, who had prior experience in sensory analysis, were on the panel. They have no objection regarding the use of sensory data given by the individual as per the 9-point hedonic rating scale.
Clinical Trial Registration
This research does not involve any clinical trial.
Permission to Reproduce Material from Other Sources
Not applicable
Author Contributions
- Girija Sherma: Conceptualization, Methodology, Software, Resources, Investigation, Formal Analysis, Validation, Data Curation.
- Dev Raj Acharya: Supervision, Methodology, Supervision, Validation, Project administration.
- Kishor Rai: Software, Resources, Writing-original draft, Writing- review and editing, Visualization.
- Nabin Khadka: Methodology, Software, Resources
- Gaurav Gurung: Methodology, Software, Resources
- Angelo Maria Giuffrè: Software, Resources, Writing—review and editing, Supervision.
- Anish Dangal: Software, Resources, Writing-original draft, Writing- review and editing, Visualization.
References
- Ryder K, Ha M, Bekhit AE-D, Carne A. Characterisation of novel fungal and bacterial protease preparations and evaluation of their ability to hydrolyse meat myofibrillar and connective tissue proteins. Food Chem. 2015;172:197-206. doi:10.1016/j.foodchem.2014.09.061
CrossRef - Toldrá F, Reig M, Mora L. Management of meat by-and co-products for an improved meat processing sustainability. Meat Science. 2021;181:108608. doi:10.1016/j.meatsci.2021.108608
CrossRef - Asogwa IS, Okoye JI, Oni K. Promotion of indigenous food preservation and processing knowledge and the challenge of food security in Africa. Journal of Food Security. 2017;5(3):75-87. doi:10.12691/jfs-5-3-3
- Ockerman HW, Basu L. By-products. In: Jensen W, Devine C, Dikemann M, eds. Encyclopedia of meat sciences. Elsevier Science Ltd; 2004a:104–112.
CrossRef - Ockerman HW, Basu L. Hides and skins. In: Jensen W, Devine C, M.Dikemann, eds. Encyclopedia of meat sciences. Elsevier Science Ltd; 2004b:125–138.
CrossRef - Pearl GG. Inedible. In: Jensen W, Devine C, Dikemann M, eds. Encyclopedia of meat sciences Elsevier Science Ltd; 2004:112–125.
CrossRef - Aristoy MC, Toldrá F. Essential amino acids. In: Nollet LML, Toldrá F, eds. Handbook of analysis of edible animal by-products. CRC Press; 2011:123–135.
CrossRef - García-Llatas G, Alegría A, Barberá R, Farré R. Minerals and trace elements. In: Nollet LML, Toldrá F, eds. Handbook of analysis of edible animal by-products. CRC Press; 2011:183–203.
- Honikel KO. Composition and calories. In: Nollet LML, Toldrá F, eds. Handbook of analysis of edible animal by-products CRC Press; 2011:105–121.
- Kim Y-N. Vitamins. In: Nollet LML, Toldrá F, eds. Handbook of analysis of edible animal by-products. CRC Press; 2011:161–182.
- Valta K, Damala P, Orli E, et al. Valorisation opportunities related to wastewater and animal by-products exploitation by the Greek slaughtering industry: current status and future potentials. Waste and biomass valorization. 2015;6:927-945. doi:10.1007/s12649-015-9368-1
CrossRef - Leroy F, Geyzen A, Janssens M, De Vuyst L, Scholliers P. Meat fermentation at the crossroads of innovation and tradition: a historical outlook. Trends Food Sci Technol. 2013;31:130-137. doi:10.1016/j.tifs.2013.03.008
CrossRef - Zeng W, Wen W, Deng Y, Tian Y, Sun H, Sun Q. Chinese ethnic meat products: Continuity and development. Meat Science. 2016;120:37-46. doi:10.1016/j.meatsci.2016.04.007
CrossRef - Rather SA, Masoodi FA, Akhter R. Ethnic meat products of Kashmiri wazwan: a review. Journal of Ethnic Foods. 2016;3(4):246-250. doi:10.1016/j.jef.2016.12.002
CrossRef - Campos SD, Alves RC, Mendes E, Costa ASG, Casal S, Oliveira MBPP. Nutritional value and influence of the thermal processing on a traditional Portuguese fermented sausage (alheira). Meat Science. 2013;93(4):914-918. doi:10.1016/j.meatsci.2012.09.016
CrossRef - Triki M, Herrero AM, Jimenez-Colmenero F, Ruiz-Capillas C. Effect of preformed konjac gels, with and without olive oil, on the technological attributes and storage stability of merguez sausage. Meat Science. 2013;93(3):351-360. doi:10.1016/j.meatsci.2012.10.004
CrossRef - Cherroud S, Cachaldora A, Fonseca S, Laglaoui A, J. C, Franco I. Microbiological and physicochemical characterization of dry-cured Halal goat meat. Effect of salting time and addition of olive oil and paprika covering. Meat Science. 2014;98(2):129-134. doi:10.1016/j.meatsci.2014.05.018
CrossRef - Nam K-C, Jo C, Lee M. Meat products and consumption culture in the East. Meat Science. 2010;86(1):95-102. doi:10.1016/j.meatsci.2010.04.026
CrossRef - Guerrero L, Guardia MD, Xicola J, Verbeke W, Vanhonacker F, S Z-B. Consumer-driven definition of traditional food products and innovation in traditional foods. A qualitative cross-cultural study. Appetite. 2009;52(2):345-354. doi:10.1016/j.appet.2008.11.008
CrossRef - Talon R, Lebert I, Lebert A, Leroy S, Garriga M, Aymerich T. Traditional dry fermented sausages produced in small-scale processing units in Mediterranean countries and Slovakia 1: microbial ecosystems of processing environments. Meat Science. 2007;77(4):570-579. doi:10.1016/j.meatsci.2007.05.006
CrossRef - Laranjo M, Talon R, Lauková A, Fraqueza MJ, Elias M. Traditional meat products: improvement of quality and safety. J Food Qual. 2017;2017:1-2. doi:10.1155/2017/2873793
CrossRef - Trichopoulou A, Soukara S, Vasilopoulou E. Traditional foods: a science and society perspective. Trends Food Sci Technol. 2007;18(8):420-427. doi:10.1016/j.tifs.2007.03.007
CrossRef - Almli VL, Verbeke W, Vanhonacker F, Næs T, Hersleth M. General image and attribute perceptions of traditional food in six European countries. Food Qual Prefer. 2011;22(1):129-138. doi:10.1016/j.foodqual.2010.08.008
CrossRef - Gagaoua M, Boudechicha H-R. Ethnic meat products of the North African and Mediterranean countries: An overview. Journal of Ethnic Foods. 2018;5(2):83-98. doi:10.1016/j.jef.2018.02.004
CrossRef - Maharjan E. personal communication. Telephone ed2019.
- Personal communication. Interview ed2019.
- Feiner G. Brawn and meat jellies. Meat Product Handbook Pratical Science and Technology. CRC press; 2006:519-529.
CrossRef - Gómez-Guillén M, Giménez B, López-Caballero Ma, Montero M. Functional and bioactive properties of collagen and gelatin from alternative sources: A review. Food hydrocolloids. 2011;25(8):1813-1827. doi:10.1016/j.foodhyd.2011.02.007
CrossRef - Yao H, Xu YL, Liu W, et al. Taste compounds generation and variation of broth in pork meat braised processing by chemical analysis and an electronic tongue system. J Food Biochem. 2021;46(6):e13766. doi:10.1111/jfbc.13766
CrossRef - Junior JS, Ribeiro ER, Pedrâo MR, Machado-Lunkes A. Headcheese as an alternative use of pork byproducts: physicochemical analysis and texture profile. 2014:1-4.
- Kim H-W, Park J-H, Yeo E-J, et al. Effect of duck feet gelatin concentration on physicochemical, textural, and sensory properties of duck meat jellies. Korean Journal for Food Science of Animal Resources. 2014;34(3):387-394. doi:10.5851/kosfa.2014.34.3.387
CrossRef - Selvan P, Mendiratta S, Porteen K, Bhilegaonkar K. Studies on effect of sodium hypochlorite on microbial, sensory and physiochemical characteristics of buffalo offal. American Journal of Food Technology. 2007;2:366-376. doi: 10.3923/ajft.2007.366.376
CrossRef - Verma A, Lakshmanan V, Das A, Mendiratta S, Anjaneyulu A. Physico-chemical and functional quality of buffalo head meat and heart meat. American Journal of Food Technology. 2008;3(2):134-140.
CrossRef - Samatra MY, Razali UHM, Shaarani SM, Roslan J, Ramli RA, Noor NQIM. Physicochemical and Functional Properties of Buffalo (Bubalus bubalis) Bone Gelatin Extracted Using Acid Pre-Treatment. Future Foods. 2024;10:100428. doi:10.1016/j.fufo.2024.100428
CrossRef - Zhao H, Wang S-Q, Qing L-L, Liu L-L, Zhang Y-P. Expression of BSE-associated proteins in the CNS and lymphoreticular tissues of cattle and buffalo. Science Bulletin. 2016;61(17):1377-1383. doi:10.1007/s11434-016-1130-y
CrossRef - Ramli RA, Razali UHM, Noor NQIM. Optimization of extraction conditions of gelatin from buffalo (Bubalus bubalis) skins using response surface methodology. Heliyon. 2023;9(3):1-10. doi:10.1016/j.heliyon.2023.e14367
CrossRef - Li F, Jia D, Yao K. Amino acid composition and functional properties of collagen polypeptide from Yak (Bos grunniens) bone. LWT – Food Science and Technology. 2009;42(5):945–949. doi:10.1016/j.lwt.2008.12.005
CrossRef - Herregods G, Van Camp J, Morel N, et al. Angiotensin I-converting enzyme inhibitory activity of gelatin hydrolysates and identification of bioactive peptides. J Agric Food Chem. 2011;59(2):552-558.
CrossRef - Das MP, Suguna P, Prasad K, Vijaylakshmi J, Renuka M. Extraction and characterization of gelatin: a functional biopolymer. International Journal of Pharmacy and Pharmaceutical Sciences. 2017;9(9):239-242. doi:10.22159/ijpps.2017v9i9.17618
CrossRef - Toldrá F, Reig M. Innovations for healthier processed meats. Trends Food Sci Technol. 2011;22(9):517-522. doi:10.1016/j.tifs.2011.08.007
CrossRef - Zhang G, Xu Z, Gao Y, Huang X, Zou Y, Yang T. Effects of germination on the nutritional properties, phenolic profiles, and antioxidant activities of buckwheat. J Food Sci. 2015;80(5):1111-1119.
CrossRef - Preparation of bone stock. https://meatupdate.csiro.au/infosheets/Preparation%20of%20Bone%20Stock.pdf
- Official Method of Analysis. In: W. Dr. Horwitz E, editor. Association of Official Analytical Chemist. 18th ed. USA: AOAC International; 2005.
- Ranganna S. Handbook of analysis and quality control for fruit and vegetable products. 2nd ed. Tata McGraw-Hill Publishing Ltd.; 2008.
- Subba D. Practicle Book of Meat, Poultry and Fish Technology. National College of Food Science and Technolgy; 2010.
- Kim T-K, Yong HI, Jeong CH, et al. Technical functional properties of water-and salt-soluble proteins extracted from edible insects. Food Science of Animal Resources. 2019;39(4):643-654. doi:10.5851/kosfa.2019.e56
CrossRef - Mhone TA, Matope G, Saidi PT. Aerobic bacterial, coliform, Escherichia coli and Staphylococcus aureus counts of raw and processed milk from selected smallholder dairy farms of Zimbabwe. Int J Food Microbiol. 2011;151(2):223-228. doi:10.1016/j.ijfoodmicro.2011.08.028
CrossRef - Tayyem RF, Heath DD, Al-Delaimy WK, Rock CL. Curcumin content of turmeric and curry powders. Nutr Cancer. 2006;55(2):126-131. doi:10.1207/s15327914nc5502_2
CrossRef - Lučan Čolić M, Antunović M, Jukić M, Popović I, Lukinac J. Sensory acceptance and characterisation of turmeric-and black-pepper-enriched ice cream. Applied Sciences. 2023;13(21):11802. doi:10.3390/app132111802
CrossRef - Pearson AM. Meat/Extracts. In: Caballero B, ed. Encyclopedia of Food Sciences and Nutrition. 2nd ed. Elsevier Science Ltd.; 2003:3812-3817.
CrossRef - Tornberg E. Effects of heat on meat proteins–Implications on structure and quality of meat products. Meat science. 2005;70(3):493-508. doi:10.1016/j.meatsci.2004.11.021
CrossRef - Du C, Qi J, Yang C, Zhang Q, Liu D. Enrichment of taste and aroma perceptions in chicken meat stewed in braised soup used repeatedly. J Food Sci. 2022;87(6):2563-2577. doi:10.1111/1750-3841.16180
CrossRef - Meher J, Meher R. Investigation of chemical, rheological and sensory properties of curry-spices blend. Journal of Agriculture and Food Research. 2020;2:100093. doi:10.1016/j.jafr.2020.100093
CrossRef - McEvoy JH. Taking stok. Prepared Foods. 2004;173(2):29-30.
- Van Boekel M. Kinetic aspects of the Maillard reaction: a critical review. Food/Nahrung. 2001;45(3):150-159.
CrossRef - Desmond E. Reducing salt: A challenge for the meat industry. Meat science. 2006;74(1):188-196. doi:10.1016/j.meatsci.2006.04.014
CrossRef - Fairuza TA, Amertaningtyas D. The Effect of Gelatin on Water Holding Capacity, Water Activity, Water Content, and Randement of Chicken-Liver Meatball. BIO Web of Conferences. 2024;88:1-6. doi:10.1051/bioconf/20248800016
CrossRef - Deogade A, Zanjad P, Ambadkar R, Raziuddin M. Formulation of Spices mixture for preparation of Chicken Curry. Veterinary World. 2008;1(1):18-20.
- Wang L, Qiao K, Duan W, Zhang Y, Xiao J, Huang Y. Comparison of taste components in stewed beef broth under different conditions by means of chemical analyzed. Food Science & Nutrition. 2020;8(2):955-964. doi:10.1002/fsn3.1376
CrossRef - Ockerman HW, Basu L. By-products. In: Dikeman M, Devine C, eds. Encyclopedia of meat sciences. 2nd ed. Academic Press; 2014:104-111.
CrossRef - Kim T-K, Yong HI, Jang HW, et al. Effects of hydrocolloids on the quality characteristics of cold-cut duck meat jelly. Journal of Animal Science and Technology. 2020;62(4):587-594. doi:10.5187/jast.2020.62.4.587
CrossRef - Toldrá F, Aristoy M-C, Mora L, Reig M. Innovations in value-addition of edible meat by-products. Meat science. 2012;92(3):290-296. doi:10.1016/j.meatsci.2012.04.004
CrossRef - Mulyani S, Setyabudi F, Pranoto Y, Santoso U. The effect of pretreatment using hydrochloric acid on the characteristics of buffalo hide gelatin. Journal of the Indonesian Tropical Animal Agriculture. 2017;42(1):14-22. doi:10.14710/jitaa.42.1.14-22
CrossRef - He FJ, Jenner KH, MacGregor GA. WASH—world action on salt and health. Kidney Int. 2010;78(8):745-753. doi:10.1038/ki.2010.280
CrossRef - Salt and health, Scientific Advisory Committee on Nutrition (SACN) (The Stationery Office) (2003).
- Dietary Guidelines for Americans (DGA) ( 2005).
- Ankri S, Mirelman D. Antimicrobial properties of allicin from garlic. Microb Infect. 1999;1(2):125-129. doi:10.1016/S1286-4579(99)80003-3
CrossRef - Lai P, Roy J. Antimicrobial and chemopreventive properties of herbs and spices. Curr Med Chem. 2004;11(11):1451-1460. doi:10.2174/0929867043365107
CrossRef - Arora DS, Kaur J. Antimicrobial activity of spices. Int J Antimicrob Agents. 1999;12(3):257-262. doi:10.1016/S0924-8579(99)00074-6
CrossRef - Liu Q, Meng X, Li Y, Zhao C-N, Tang G-Y, Li H-B. Antibacterial and antifungal activities of spices. Int J Mol Sci. 2017;18(6):1283. doi:10.3390/ijms18061283
CrossRef - Mutlu-Ingok A, Karbancioglu-Guler F. Cardamom, cumin, and dill weed essential oils: Chemical compositions, antimicrobial activities, and mechanisms of action against Campylobacter spp. Molecules. 2017;22(7):1191. doi:10.3390/molecules22071191
CrossRef - Grohs BM, Kunz B. Use of spice mixtures for the stabilisation of fresh portioned pork. Food Control. 2000;11(6):433-436. doi:10.1016/S0956-7135(00)00005-0
CrossRef - Gupta S, Ravishankar S. A comparison of the antimicrobial activity of garlic, ginger, carrot, and turmeric pastes against Escherichia coli O157: H7 in laboratory buffer and ground beef. Foodbourne Pathogens & Disease. 2005;2(4):330-340. doi:10.1089/fpd.2005.2.330
CrossRef - Pawar V, Mule B, Machewad G. Effect of marination with ginger rhizome extract on properties of raw and cooked chevon. Journal of Muscle Foods. 2007;18(4):349-369. doi:10.1111/j.1745-4573.2007.00091.x
CrossRef - Paulsen P, Awaiwanont N, Smulders FJ. Growth of Listeria monocytogenes in traditional Austrian meat jelly products. Procedia Food Science. 2015;5:219-222. doi:10.1016/j.profoo.2015.09.027
CrossRef - Kumari M, Kumar A, Gupta R. Enumeration of total viable and total coliform count in chicken meat and meat products using tempo® system. Haryana Vet. 2018;57 (2):204-206.
- Bryant J, Brereton DA, Gill CO. Implementation of a validated HACCP system for the control of microbiological contamination of pig carcasses at a small abattoir. The Canadian Veterinary Journal. 2003;44(1):51-55.
Abbreviations List
°C – Celsius
cfu – Colony Forming Unit
db – Dry Basis
eq – Equation
g – Gram
h – Hours
kg – Kilogram
L – Liter
min – Minutes
% – Percentage
RSM – Response Surface Methodology
TPC – Total Plate Count
TMTC – Too Many to Count
WHC – Water Holding Capacity
Accepted on: 09 Sep 2025
Second Review by: Pranav Vashisht
Final Approval by: Dr. Nurul Huda


Web of Science Coverage
Emerging Sources Citation Index (ESCI)
2024 Journal Impact Factor: 1.1
Scopus Journal Metrics
CiteScore 2025: 2.6
CiteScore Details
Sustainable Nutrition: Food Systems, Nutrient Retention, and Public Health Impact
![]()
This journal is a member of, and subscribes to the principles of, the Committee on Publication Ethics (COPE)


