Physicochemical, Functional and Antioxidant Properties of Pigmented Rice
Sandy Pradipta1
1Graduate School of Biotechnology, University of Jember, Indonesia.
2Study Program of Agrotechnology Faculty of Agriculture, University of Jember, Jember, Indonesia.
3The Center of Excellence on Crop Industrial Biotechnology (PUI-PT BioTIn), University of Jember, Jember, Indonesia.
Corresponding Author Email: triagus.faperta@unej.ac.id
DOI : http://dx.doi.org/10.12944/CRNFSJ.8.3.15
Download this article as:
![]()
Pigmented rice has hight antioxidant nature, and its properties contribute to the successful formulation of nutraceutical food products. Based on this background, this research was aimed at determining the physicochemical, functional and antioxidant properties of ten pigmented Indonesian rice varieties - Merah Saleman, Mota, Beureum Taleus, Anak Doro M, Cempo Salamet, Ketan Putri, Ketan Hitam I, Ketan Hitam II, Gogo Niti II, and Care Hitam. The physic properties and proximate analysis of pigmented rice were showed a significant difference at p less than 0.05, except for crude fiber. The sample with the lowest amylose showed the highest peak, trough, and final viscosities, but with low pasting temperature. The gelatinization enthalpy ranged from 0.82 - 1.33 J/g, and the sample with the highest amylose had the lowest gelatinization peak. The functional properties of the water absorption index ranged from 4.22 - 7.63 g/g, the water solubility index was between 3.62 - 7.40%, the oil absorption index varied from 0.88 - 1.36 g/g, while the swelling power was between 5.31 - 8.42 g/g. Furthermore, the antioxidant properties of the samples measured in terms of the phenolic content ranged from 2.17 - 10.60 mg GAE/g, the flavonoids varied from 0.43 - 2.31 mg QE/g and their activity used the stable 2,2-diphenyl-1-picrylhydrazyl (DPPH) and hydroxyl radicals. The total flavonoid in the phenolic component was positively correlated with the antioxidant activity. In conclusion, the ten pigmented rice showed a wide range of physicochemical, functional, and antioxidant properties, making the samples useful for the formulations of various products with health benefits
KEYWORDS:Antioxidant; Flavonoid; Physicochemical; Pigmented Rice; Thermal
Introduction
Public interest has increased regarding pigmented rice because it has been found to perform health-benefiting biological activities, including those who are anti-mutagenic, anti-lipid peroxidation, anti-inflammatory, aldose reductase inhibitor, cholesterol absorption inhibitor, anti-hepatic steatosis, and reactive oxygen species suppressor.1 As such, pigmented rice is a popular crop for nutraceutical products because it contains high levels of antioxidant compounds, including phenolics, anthocyanin, and gamma-oryzanols.
Antioxidants from pigmented rice can neutralize free radicals, transfer anti-aging benefits, and prevent diseases related to oxidative stress.2 Recent research states that pigmented rice has been applied as an indigenous medicine.3 Because of these health benefits, there has been increasing interest in developing pigmented rice-based food products for human consumption.
According to Falade and Christopher4, the types of rice flour used in various food products such as pudding, flatbread, beverages, ingredients in meat processing, salad dressing, and low gluten bread. In Indonesia, rice flour is used traditional foods like nagasari, talam, putu ayu, apem, and cacarbikang. Additionally, rice flour extracts are used as a food coloring in cake, alcoholic drinks, and a particular type of ice cream and puddings.5 The development of novel foods products usually involves rice flours that have useful physicochemical and antioxidant properties that improve the functional foods products.6
Variations in the physicochemical, functional, and antioxidant properties of rice flour can influence the quality and contributes to the successful formulation of various food products. Physicochemical properties are known to change the cooking pattern as well as resulting food product texture.7 Amylose has significant effects on gelatinization temperature, pasting behavior, and viscosity properties.8 Functional properties such as the oil absorption index can be used shelf-life indicators because they are associated with rancidity, and the water absorption index indicates the texture of the food.9 Antioxidant properties increase the functional value of the product because of their ability to neutralize free radicals.10
There are many cultivars of pigmented rice in Indonesia, and each has different properties. This research aimed to analyze the physicochemical, functional, and antioxidant properties of ten Indonesia pigmented rice. The results of the current study can be used as information to increase the value and quality of food products made from pigmented rice. From the point of view of plant breeding, diversity in physicochemical and antioxidant properties in pigmented rice is useful for global plant breeders to produce new lines with some desired specific traits
Materials and Methods
Sample Collection
The ten local varieties of Indonesia pigmented rice (Merah Saleman, Mota, Beureum Taleus, Anak Doro Magelang, Cempo Salamet, Ketan Putri, Ketan Hitam I, Ketan Hitam II, Gogo Niti II, and Care Hitam) were cultivated under average climate conditions in the Agrotechnopark Research Center, Jember University, East Java, Indonesia and harvested in August 2018. All samples were finally collected in paper bags and were stored at −4oC.
Chemical Reagents
The chemical reagents used were selenium quercetin (C5H10O7), gallic acid (C7H6O5), folin-ciocalteu (H3PO4(Mo3)12), 2,2-diphenyl-1-picrylhydrazyl (DPPH), ascorbic acid (C6H8O6), 2-deoxy-d-ribose (C5H10O4), hydrogen peroxide (H2O2), tertiary butyl alcohol (TBA), trichloroacetic acid (TCA), ethylenediaminetetraacetic acid (EDTA) procured from Sigma-Aldrich, Singapore.
Preparation of Samples
Rice grains were dehusked using rice huller and then polished using the rice mill machine (MB-RC52W, Yamamoto, Japan). The polished rice grains grounded to powder and then passed through a 60 sieve mesh (250 µm). All samples were finally placed in plastic bags and were stored at −4oC before analysis.
Physical Properties
1,000 Grains Weight (GW) and Length-Width Ratio (L:W)
The weight of 1,000 rice grains measured randomly using an analytical balance (EP-225 SM-DR, Precisa, Swiss). The vernier caliper was used the measure the length (mm) and width (mm). Length/width (L:W) ratio was calculated to determine grain shape. According to the IRRI (International Rice Research Institute),11 rice grains classified into four categories: slender (>3 mm), medium (2.1-3.0 mm), bold (1.1-2.0 mm), and round (<1.0 mm).
Color Parameters
The color parameter was determined using a color reader (CR-20, Konica Minolta, US). The color reader was calibrated using a white calibration tile. Rice flour sample (35 g) placed in a clean petri dish and calculated. The parameters color were L* (brightness to white), a* (red to green), and b* (yellow to blue).
Chemical Properties
Proximate Composition
The proximate composition of rice flour was estimated according to the AOAC method.12 Protein content was determined by micro-Kjeldahl method, lipid content was determined by soxhlet apparatus method, ash content was determined by burning sample at 700oC in the electric furnace (PrepASH 229, Precesia, Japan), crude fiber content was determined AOAC method 978.10, and carbohydrate content was calculated based on the formula reported by Amagloh et al.13 Carbohydrate (%) = 100% – [Moisture (%) + protein (%) + lipid (%) + ash (%)]. Whereas, the gross energy was determined using the formula reported by Bhat and Yahya14 Gross energy (kJ/100 g) = [Protein (%) + Carbohydrate (%) x 16,7 + Lipid (%) x 37.7].
Amylose Content
Amylose content determined by following the method of Juliano.15 Rice flour (0.1 g) added by ethanol (96%, 1 mL) and NaOH (1 N, 9 mL). The solution was heated in the water bath (95oC 10 minutes) and then cooled (50 minutes). Solution (5 mL) taken and transferred to Erlenmeyer glass (100 mL). Acetic acid (1N, 1 mL), iodine (2%, 2 mL) and distilled water (92 mL) were added to the sample solution and then incubated (20-25oC, 20 minutes). The solution measured using UV-Spectrophotometer (U-2900, Hitachi, Japan) at 620 nm. The amylose was determined by comparing to a standard curve from potato amylose (mg/L).
Pasting Properties
Pasting properties were calculated using by Rapid Visco Analyzer (RVA-Techmaster, Perten, Australia) according to Kraithong method.16 Rice flour sample (3 g) was placed in an aluminum canister. Distilled water (25 mL) was added before the solution was placed inside RVA. The programs of temperature in the following order: maintained (50oC, 1 minute) and then raised (95oC, 3.7 minutes). The sample was maintained (95oC, 2.5 minutes), cooled (50oC, 2.5 minutes), and maintained (50oC, 2 minutes). The plot of viscosity in RVA units (cP) versus time was used to determine peak viscosity (PV), trough viscosity (TR), breakdown viscosity (BD), final viscosity (FV), setback viscosity (SB), peak time (PTm), and pasting temperature (PT).
Thermal Properties
A differential scanning calorimetry (Rigaku, DSC8230, Japan) was used to determine the thermal properties of samples based on Siswoyo and Morita method.17 Rice flour sample (2 mg) placed into DSC aluminum pan and then distilled water was added (Flour:water = 1:4). The sample was then hermetically sealed and allowed the stand (4oC, 1 hour). Software Thermo Plus EVO was connected and controlled the DSC machine, and then the sample was heated at a rate of 10oC/minutes in a nitrogen atmosphere (20 mL/minutes) from 35-120oC. Thermal transitions were defined to determine onset (To), peak (Tp), conclusion temperature (Tc), and gelatinization enthalpy (ΔHg).
Functional properties
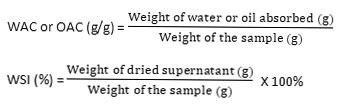
Water Absorption Capacity (WAC), Oil Absorption Capacity (OAC) and Water Solubility Index (WSI) and
The WAC, OAC, and WSI were determined according to the methods established by Bhat and Yahya.14 Sample of rice flour (2.5 g) were mixed with distilled water (20 mL) or corn oil (25 mL) and centrifuged (3,000 rpm, 15 minutes). The WAC, OAC, and WSI were calculated based on the formula:
Swelling Power (SP)
The swelling power of rice flour was determined by Ali et al. Method.18 sample (1 g) was dissolved into distilled water (10 mL) and incubated (60oC, 30 minutes). The sample was then cooled (25oC, 30 minutes) and centrifuged (3,000 rpm, 30 minutes). Swelling power determined by dividing the weight of pellets by the weight of the sample (g/g).

Antioxidant Properties
Total Phenolic (TP) and Flavonoid (TF) Content
Methanol (80%, 6 mL) was added to the unpolished rice flour (0.2 g) and macerated on the stirrer (4oC, 1 day). The solution was centrifuged (10,000 rpm, 10 minutes), and then the supernatant was taken and stored. The method described by Taga et al.19 was used to determine the TP. Extraction sample (5 µL) was added with Na2CO3 (2%, 1 mL), Folin Ciocalteu (50%, 50 µL), and methanol (100%, 45 µL). The mixture was then incubated at 24oC for 30 minutes, followed by measuring the absorbance at 750 nm using UV-Spectrophotometer (U-2900, Hitachi, Japan). Gallic acid was used as the standard (mg GAE/g).
The TF was estimated by Itidel et al. method.20 Methanol (100%, 40 µL), distilled water (400 µL) and NaNO2 (5%, 30 µL) were added to the extraction sample (10 µL). The solution was incubated at (24oC for 5 minutes); then, AlCl3 (10%, 30 µL) was added and re-incubated at 24oC for 5 minutes. After the incubation, NaOH (1 N, 200 µL) and distilled water (240 µL) was added. The solution measured using Spectrophotometer (U-2900, Hitachi, Japan) at 415 nm. Quercetin was used as the standard (mg QE/g).
Antioxidant Activity of 2,2-Diphenyl-1-1Picrylhydrazyl (DPPH)
DPPH scavenging activity was measured using the method reported by Palombini et al.21 Serial samples extracts (10, 20, 40, 60 and 80 µg GAE/mL) were mixed with DPPH (90 µM, 400 µL) and distilled water until a volume of 500 µL. The solution was incubated in the absence of the light (24oC, 5 minutes). The absorbance was recorded at 517 nm using Spectrophotometer (U-2900, Hitachi, Japan). The percent inhibition was measured through a comparison to the control. The effective concentration (IC50) is the value of antioxidants to inhibit 50% activity of DPPH.
Hydroxyl Radical Scavenging
The scavenging activity of hydroxyl free radicals was determined using the method established by Halliwell et al.22 To the serial sample extracts (30, 60, 90, 120 and 150 µL) were added 2-deoxy-D-ribose (2,8 mM, 20 µL), Ethylenediaminetetraacetic acid (1 mM, 100 µL), FeCl3 (10 mM, 10 µL), H2O2 (1 mM, 10 µL) and ascorbic acid (1 mM, 100 µL) and phosphate buffer until a volume 1 mL. The solution was then incubated (37oC, 1 hour). After the incubation, TBA (1%, 500 µL) and TCA (2.8%, 500 µL) were added and re-incubated (80oC, 30 minutes). The absorbance was measured by the spectrophotometer (U-2900, Hitachi, Japan) at 532 nm. The effective concentration (IC50) is the value of antioxidants to inhibit 50% activity of DPPH.
Statistical Analysis
All experimental results were done in triplicates to test their reproducibility. The data was analyzed using SPSS version 6.0, and the result was presented as mean ± standard deviation (SD). Statistical analysis was done using ANOVA, while Tukey’s test was used for post-hoc analysis. A significant difference was determined at p<0.05.
Discussion
Physical Properties
The physical properties of Indonesian pigmented rice is presented in Table 1. The GW of samples ranged from 12.85-25.65 g. The highest of GW was Ketan Putri (25.65 g), followed by Ketan Hitam I (23.83 g) and Merah Saleman (21.22 g), while the lowest was observed in samples from Anak Doro Magelang (12.85 g). GW values influenced by the environmental and atmospheric factors at the moment of grain harvesting.23 Temperature is the most explored environmental aspect in relation to rice production and grain quality. GW range of 20-30 g for all samples indicates a high level of production.24 1000 grain weight is a critical measure of seed quality, which is useful on sprouting, seed potential, seedling growth, and plant performance.25
Table 1: Physical Properties of Indonesia Pigmented Rice
| Variety | GW*(g) | Length(mm) | Width(mm) | L:W ratio |
| Merah Saleman | 21.22 ± 0.50d | 4.92 ± 0.05ef | 1.75 ± 0.04abc | 2.81 ± 0.06cd |
| Mota | 17.58 ± 0.65c | 3.99 ± 0.04a | 1.82 ± 0.04bcd | 2.20 ± 0.06a |
| Beureum Taleus | 16.77 ± 1.05bc | 4.41 ± 0.04bc | 1.91 ± 0.08cd | 2.31 ± 0.08ab |
| Anak Doro M | 12.85 ± 0.37a | 4.37 ± 0.04bc | 1.62 ± 0.07ab | 2.71 ± 0.09cd |
| Cempo Salamet | 16.63 ± 0.44bc | 4.58 ± 0.05cd | 1.56 ± 0.02a | 2.94 ± 0.03d |
| Ketan Putri | 25.65 ± 0.63f | 4.51 ± 0.06c | 1.99 ± 0.03de | 2.26 ± 0.05a |
| Ketan Hitam I | 23.83 ± 0.44e | 4.73 ± 0.11de | 2,17 ± 0.04f | 2,18 ± 0.09a |
| Ketan Hitam II | 15.71 ± 0.82b | 5.09 ± 0.10fg | 1.82 ± 0.06bcd | 2.80 ± 0.04cd |
| Care Hitam | 17.34 ± 0.29bc | 4.26 ± 0.07b | 1.54 ± 0.19a | 2.78 ± 0.27cd |
| Gogo Niti II | 17.47 ± 0.24c | 5.20 ± 0.10g | 2.00 ± 0.11de | 2.61 ± 0.11bc |
Data shown as mean ± SD; n = 3, values followed by the same letters in the same column are not significantly different (p > 0.05), *GW; 1000 grain weight and L:W; Length divider width.
The length of grains ranged from 3.99-5.09 mm, while the width ranged from 1.54-2.00 mm. All samples may be categorized under the category of short because they were less than 5.5 mm that. The L:W ratio analyzed to determine the grain shape and ranged from 2.18-2.94, which described all samples that have medium shape. The size and shape of rice grains were important for assessing the level of marketing because it is used as the first selection criterion in the variety of improvement program.26
Table 2: Color Parameters Properties of Indonesia Pigmented Rice
| Variety | L* | a* | b* | ||||
| Merah Saleman | 64.20 ± 0.30d | 4.13 ± 0.06d | 13.60 ± 0.10e | ||||
| Mota | 65.43 ± 0.45e | 3.63 ± 0.15bc | 12.77 ± 0.06d | ||||
| Beureum Taleus | 64.53 ± 0.21d | 3.97 ± 0.12cd | 14.37 ± 0.06f | ||||
| Anak Doro M | 66.60 ± 0.20f | 4.30 ± 0.17d | 12.83 ± 0.06d | ||||
| Cempo Salamet | 67.33 ± 0.12f | 3.27 ± 0.21b | 15.60 ± 0.17g | ||||
| Ketan Putri | 64.47 ± 0.06d | 3.70 ± 0.10c | 12.37 ± 0.06c | ||||
| Ketan Hitam I | 59.40 ± 0.20c | 0.73 ± 0.12a | 9.33 ± 0.12b | ||||
| Ketan Hitam II | 58.23 ± 0.25b | 0.77 ± 0.15a | 8.77 ± 0.12a | ||||
| Care Hitam | 57.37 ± 0.25a | 0.87 ± 0.06a | 9.07 ± 0.12ab | ||||
| Gogo Niti II | 57.07 ± 0.29a | 0.80 ± 0.19a | 8.83 ± 0.21a | ||||
Data shown as mean ± SD; n = 3, values followed by the same letters in the same column are not significantly different (p > 0.05), L*: Brightness, a*: Redness and b*: Yellowness.
The color parameters varied significantly across samples (Table 2). The Brightness (L*) of samples ranged from 57.07-66.60. Gogo Niti II had the lowest brightness (57.07) followed by Care Hitam (57.37), Ketam Hitam II (58.23), and Ketan Hitam I (59.04). The most brightness of samples is Anak Doro Magelang (66.60). The red-green color quality (a*) of samples was measured to be positive with a range from 0.73-4.13 that indicates all samples had the redness color. The blue-yellow quality of samples (b*) was measured to range from 8.83-14.37. This range indicates that the samples were more yellow than blue. Color parameters can be attributed to genetic makeup. According to Anggareni et al.,10 variations of grain color are influenced by phenolic compounds such as anthocyanins, which produce blues and purples, proanthocyanidins, which produce reds, and carotenoids which produce yellows. The strong pigmentation of the rice flour reflects the phenolic and flavonoid content, both of which yield health benefits such as the prevention of chronic diseases such as type II diabetes, obesity, and ailments.27 Moreover, Shao et al.28 confirmed that there are correlations between L*, a*, b* colors, and antioxidant compounds of pigmented rice.
Chemical Properties
Proximate composition represented in Table 3. The results of ash content ranged from 0.95-2.02% and presented the amount of mineral content in rice flour. The lipid, crude fiber, protein and carbohydrate content ranged from 0.64-1.32%, 0.87-1.59%, 6.80-10.91%, and 74.48-78.80%, respectively. The fiber and ash contents of the rice flour were related to the amounts of bran in the flour.29 These results support those found by Kraithong et al.,16 who measured the ash content at 0.47-1.44 %, the lipid content at 0.50-3.50%, and carbohydrate at 77.06-85.58%. Interestingly, crude protein content was measured to be lower than in the present study (1.58-6.22%). According to Moralez-martínes et al.,30 protein content correlated with the texture of rice flour, where high levels of protein decrease the adhesiveness of cooked rice. The Carbohydrate content of all samples was greater than 70%, indicating that rice flour is a good energy source. The total energy represented in Table 4 ranged from 14441.97-14961.99 kJ/100g.
Table 4: Proximate Composition of Pigmented Rice
| Variety | Gross EnergykJ/100g | Amylose(%) |
| Merah Saleman | 14834.59 ± 50.96cd | 20.95 ± 0.31e |
| Mota | 14567.93 ± 212.29ab | 17.88 ± 0.56d |
| Beureum Taleus | 14961.99 ± 92.33e | 22.91 ± 0.63f |
| Anak Doro M | 14769.64 ± 268.21abc | 24.58 ± 0.47g |
| Cempo Salamet | 14723.84 ± 176.21abc | 26.14 ± 0.35h |
| Ketan Putri | 14676.91 ± 121.68ab | 21.08 ± 0.40e |
| Ketan Hitam I | 14441.97 ± 74.01a | 4.87 ± 0.58b |
| Ketan Hitam II | 14571.55 ± 146.68bc | 2.85 ± 0.56a |
| Care Hitam | 14534.62 ± 154.98ab | 15.54 ± 0.39c |
| Gogo Niti II | 14479.62 ± 74.01ab | 23.11 ± 0.78fg |
Data shown as mean ± SD; n = 3, values followed by the same letters in the same column are not significantly different (p > 0.05).
Rice with high amylose content exhibited high expansion volume during cooking, smooth, and become hard on cooling and rice with amylose content showed low expansion volume during cooking, rough, and become soft on cooling.7 Besides, Rice with high levels of amylose content is suitable for hard texture food products such as extruded products, noodles, and snacks because it can provide crispness and firmness to the food product, while rice with low levels of amylose content suitable for meat products, puddings, and soft cakes because it can provide dampness and softness to the food product.32
Pasting Properties
Pasting properties of all samples is represented in Table 5. The peak, trough, and final viscosity in order were 1743.00-3892.00 cP, 1294.00-3271.00 cP, and 3260.00-5481.00 cP, respectively. Peak time and pasting temperature were at 6.83-8.00 minutes and 84.25-90.20ºC. Ketan Hitam I has the highest pasting temperature, peak, trough, and final viscosity, but has a low peak time which has inversely proportional to Cempo Salamet. A high peak viscosity reflects the ability of rice flour granules to chain water through hydrogen bonds because it has much amylopectin, which is effected the capability of the swelling collapsing granule, which determined the texture product.27,33 Pigmented rice with a height peak viscosity is suitable for liquid and soft textured food products such as gravy, salad dressing, puddings, and soft cakes. Rice flour with a low peak viscosity is suitable for products with a rough texture and weak elasticity.34 The trough viscosity determines the viscosity of flour at a constant temperature, and the highest trough represents the least viscosity required to prevent a breakdown during refrigeration.9 The final viscosity reflects the capability of paste to form a jelly after refrigeration and cooking. High final viscosity represents high resistance to shear tension throughout stirring.32 According to Hsu et al.,35, the final viscosity represented the stability of cooked flour paste and the ability to form a gel after cooling.
The breakdown of pigmented rice flour ranged from 309.00-1077.00 cP. Breakdown viscosity reflects the sensitivity of flour to disintegration, resistance against heat, and shearing after cooking.4 Anak Doro Magelang has the lowest value for breakdown viscosity, indicating that the network structure of the molecules is easy to destroy. The setback viscosity of all samples ranged from 511.00-2333.00 cP. Setback viscosity reflects the re-crystallization of gelatin during cooling, or the tendency of flour paste to retrogradation.37 Ketan Hitam II has the highest value of setback viscosity. This indicates a greater tendency for retrogradation over other variety. High breakdown and low setback viscosity value indicate good cooking quality because the cooked flour will not retrograde or become stiff when cooled.36 The breakdown viscosity reflected flour paste resistance against heat and shear. Pasting temperature is the minimum temperature needed to form gelatin. Across all samples, the pasting temperature ranged from 84.25-90.20oC. Ketan Hitam I measured the highest pasting temperature, indicating that more considerable energy is needed during cooking. The peak time of all samples ranged from 6.40-7.47 minutes, and it determined the time of flour to pasting. Ketan Hitam II has the lowest peak time indicate the flour is easy to paste.
The compositions of pigmented rice influenced pasting properties. Amylose content can restrain swelling and increase the setback value because of the three-dimensional structure from the re-merging of amylose during refrigeration.38 The other components that can influence the pasting properties are lipid and protein. Amylose-lipid and amylose-protein formation can increase the setback and final viscosity, while these can reduce peak and breakdown viscosity.39
Table 5: Pasting Properties of Pigmented Rice
| Variety | PV(cP) | TR(cP) | BD(cP) | FV(cP) | SB(cP) | PTm(Minutes) | PT(ºC) |
| Merah Saleman | 2764.00 | 2081.00 | 683.00 | 3862.00 | 1098.00 | 7.47 | 87.83 |
| Mota | 2917.00 | 2589.00 | 328.00 | 4793.00 | 1876.00 | 6.66 | 88.25 |
| Beureum Taleus | 2876.00 | 1863.00 | 1013.00 | 3387.00 | 511.00 | 6.76 | 86.45 |
| Anak Doro M | 1862.00 | 1553.00 | 309.00 | 3459.00 | 1597.00 | 7.13 | 87.00 |
| Cempo Salamet | 1743.00 | 1294.00 | 449.00 | 3260.00 | 1517.00 | 7.68 | 84.25 |
| Ketan Putri | 2119.00 | 1962.00 | 157.00 | 4452.00 | 2333.00 | 7.47 | 87.36 |
| Ketan Hitam I | 3892.00 | 3271.00 | 621.00 | 5481.00 | 1589.00 | 6.97 | 90.20 |
| Ketan Hitam II | 3743.00 | 2684.00 | 1059.00 | 5473.00 | 2230.00 | 6.83 | 90.00 |
| Care Hitam | 3961.00 | 3253.00 | 708.00 | 4631.00 | 670.00 | 7.12 | 88.15 |
| Gogo Niti II | 2769.00 | 1692.00 | 1077.00 | 4457.00 | 1688.00 | 6.40 | 89.25 |
PV: Peak viscosity, TR: Trough viscosity, BD: Breakdown. FV: Final viscosity, SB: Setback, PTm: Peak time, PT: Pasting temperature
Rice flour with a high amylose content exhibited a low peak, trough, and breakdown viscosity.27 The other components that influenced the pasting properties are lipids and protein. The formation of complex bonds between amylose and lipids or amylose and proteins can decrease the peak and breakdown viscosity, but increase the setback and final viscosity.39
Thermal Properties
The pigmented rice variegated in thermal characteristics (Table. 5). The gelatinization onset temperature ranged from 78.30-84.10oC, peak temperature ranged from 80.90-88.00oC, conclusion temperature ranged from 84.60-91.30oC, and enthalpy ranged 0.82-1.36 J/g. The data was similar in that found by Odenigbo et al.,40 who reported a gelatinization onset temperature ranging from 63.42-78.34oC, peak temperature ranging from 67.66-81.27oC, conclusion temperature ranging from 74.02-90.18oC and enthalpy ranging from 0.62-2.51 J/g. sample with high amylose content tends to exhibit high onset (T0), peak (Tp), and conclusion (Tc) gelatinization temperature. The gelatinization endotherm interpreted the move from limited to maximum swollen of amylopectin molecules in flour granule and several dissolutions of amylose molecule in flour polymers. Ketan Hitam I exhibited the highest onset, peak, and conclusion gelatinization temperatures, all positively correlated with pasting temperature. Ketan Putri exhibited the lowest enthalpy, which reflects the small molecular weight. The endotherm is related to starch gelatinization and denaturation of rice flour are related to the presence of crystallinity.41of the protein.27 In addition, the thermal properties.
Table 6: Thermal Properties of Pigmented Rice
| Variety | To(°C) | Tp(°C) | Tc (°C) | ΔHg (J/g) |
| Merah Saleman | 81.50 | 84.40 | 87.70 | 0.91 |
| Mota | 82.80 | 86.60 | 89.70 | 1.26 |
| Beureum Taleus | 80.00 | 82.90 | 86.70 | 0.94 |
| Anak Doro M | 79.60 | 83.90 | 87.20 | 0.82 |
| Cempo Salamet | 78.30 | 80.90 | 84.60 | 0.88 |
| Ketan Putri | 80.50 | 83.80 | 87.20 | 0.82 |
| Ketan Hitam I | 84.10 | 87.10 | 90.70 | 1.05 |
| Ketan Hitam II | 84.00 | 88.00 | 91.30 | 1.36 |
| Care Hitam | 83.20 | 86.00 | 89.20 | 1.24 |
| Gogo Niti II | 82.40 | 85.30 | 88.40 | 0.86 |
To: Onset temperature, Tp: Peak temperature, Tc: conclusion temperature and ΔHg: gelatinization enthalpy
The variations in the thermal properties of pigmented rice are affected by amylose, amylopectin, lipid, and protein contents. The large amylopectin branch was reflected in the difficulty of destroying the large crystalline areas which are required large energy.42 The formation of intermolecular covalent disulfide crosslinks made the proteins less soluble and less prone to bind with other flour.43 Moreover, amylose-lipid and amylose-protein formation form a more rigid structure and thus required a higher temperature for gelatinization. An assessment of thermal properties was important for the applications of flour-based food products because they affect processing, elasticity, and swelling product.30
Functional Properties
The functional properties in this study is depicted in Table. 7. The WAC ranged from 4.22-7.63 g/g. The data were consistent with Kraithong et al.,16 who published a WAC value between 5.44-7.14 g/g. The WAI reflects the ability of rice flour to bind to water molecules in limited water conditions.40 The main factors that influence WAC values are carbohydrate, protein, lipid, and amylose content. The high carbohydrate and protein content in rice flour reflect a molecule structure that has a molar or charged side chain, which makes hydrogen bonds stronger, and the lipid content is revealed the structure of the molecule because it has a hydrophobic part which interrupts hydration of flour granule.16 The size of granules significantly influences. Flour with small particle size has a big surface area to which the water molecules may bind. WAC is an important consideration for baking applications. Beureum Taleus had the highest WAC, which indicates that it is composed of low structure polymers that make food products soft and smooth. In contrast, Ketan Hitam I had the lowest WAC, associated with compactness in the polymer structure. These results are in agreement with Aprianita et al.,44 who explained the highest WAI value indicated the flour has a high number of the hydrophilic group within flour molecules, and it provides softness and smoothness in the food product. In addition, the formation of a complex bond of amylose with lipids or proteins can interfere with water-binding capability through decreasing polarity of the charged molecule.4
The WSI range found in this study (3.62-7.40%) agreed with the findings of Kraithong et al.,16 who reported the WSI of Thai organic rice flour ranging between 2.97-7.05%. The WSI value describes the capability of the sample to disperse in aqueous solution. Ketan Hitam I had the highest WSI, indicating that the sample was highly adhesive and sticky. Cempo Salamet has the lowest value for WSI, indicating the high capability to prevent food structure throughout cooked and caused stiff and hard in the food product. Chung et al.45 found that low WSI values were associated with zone junction formation by amylose, which resulted in a rigid flour granule structure. Besides, the formation of amylose-lipid complexes or protein-amylose can reduce the insoluble portion of flour, causing a decrease in the WSI values.
The OAC value results (0.88-1.36 g/g) were similar to those of Sarangapani et al.,46 who reported OAC values ranging from 0.88-1.39 g/g. Care Hitam had the highest OAC value, indicating a relatively greater ability to the rice flour to binding oil molecules. OAC values are strongly influenced by protein and lipid content. Proteins are composed of hydrophilic and hydrophobic molecules. The side chains of non-polar amino acids with the hydrocarbon chain of lipids can form hydrophobic interactions.9 Increasing levels of lipid content in rice flour can increase the OAC because of the greater of hydrophobic molecules. The OAC is important in food production because it indicates flour to maintain oil, which acts to retaining flavor, rancid taste, and enhanced mouthfeel.
The swelling power of pigmented rice flour ranged from 5.31-8.42 g/g. The swelling power of flour indicates the level of associative power in flour granule and the water absorption index from the starch-based flour throughout cooking. Variations in swelling power are influenced by the ratio amylose to amylopectin, pasting properties, and molecules of flour, which have negatively charged phosphate groups.18 High amylopectin is associated with increased swelling power. Higher protein content in rice flour caused rice granules to be embedded in a rigid protein structure, which restricts the hydrocarbons from binding to water molecules.9 According to Chui and Zhu,47 the simple sugars, proteins, lipids, dietary fibers, and minerals played a significant role in the swelling properties of the flours
Table7: Functional Properties of Pigmented Rice
| Variety | WAC(g/g) | WSI(%) | OAC(g/g) | SP(g/g) |
| Merah Saleman | 6.52 ± 0.17d | 6.17 ± 0.13c | 0.90 ± 0.02a | 6.91 ± 0.06d |
| Mota | 6.04 ± 0.07cd | 5.06 ± 0.36b | 1.21 ± 0.03bc | 7.61 ± 0.10e |
| Beureum Taleus | 7.23 ± 0.08e | 5.55 ± 0.09bc | 0.88 ± 0.08a | 5.31 ± 0.09a |
| Anak Doro Magelang | 6.51 ± 0.10d | 5.35 ± 0.20b | 1.23 ± 0.03bcd | 6.62 ± 0.11d |
| Cempo Salamet | 7.63 ± 0.05e | 3.62 ± 0.23a | 1.12 ± 0.04b | 6.14 ± 0.07c |
| Ketan Putri | 5.82 ± 0.05c | 5.38 ± 0.46b | 1.34 ± 0.02d | 7.35 ± 0.17e |
| Ketan Hitam I | 4.22 ± 0.11a | 7.40 ± 0.24d | 1.16 ± 0.07bc | 8.42 ± 0.10e |
| Ketan Hitam II | 6.11 ± 0.60cd | 6.98 ± 0.18d | 1.11 ± 0.05b | 8.17 ± 0.13e |
| Care Hitam | 5.13 ± 0. 07b | 5.71 ± 0.17bc | 1.36 ± 0.06d | 7.47 ± 0.22e |
| Gogo Niti II | 6.55 ± 0.24d | 5.58 ± 0.31bc | 1.27 ± 0.03cd | 5.74 ± 0.17b |
Data shown as mean ± SD; n = 3, values followed by the same letters in the same column are not significantly different (p > 0.05). WAC: Water absorption capacity, WSI: Water solubility index, OAC: Oil absorption capacity, and SP: Swelling power.
Antioxidant Properties
Total phenolic and flavonoid ranged from 2.17-10.60 mg GAE/g and 0.43-2.84 mg QE/g (Table 8.). The result from the test about antioxidants properties are similar to those found by Shen et al.,47 who reported that the total phenolic content in pigmented rice ranged from 1.65-12.44 mg GAE/g for black rice and total flavonoid ranged from 1.08-2.86 mg QE/g. The percentage flavonoid in phenolic of all samples ranged from 17.63-26.77%. Ketan Hitam II has the highest total phenolic and flavonoids content, indicating that Ketan Hitam II has the highest healthy benefit.
Phenolic compounds are secondary metabolites in plants that have the scavenging ability due to the presence of hydroxyl groups. Phenolic compounds can decrease the oxidative rate of organic materials by transferring hydrocarbon atoms to radical molecules.5 Flavonoids are a group of polyphenolic compounds whose biosynthesis can trough shikimic and malonic acid pathways. Flavonoids include enzymes such as aldose reductase and xanthine oxidase, which are powerful phenolic hydroxyl groups and antioxidants.48 The flavonoids have antioxidant activities which when consumed protect against various forms of carcinogenesis and prevent cell damage and inflammation.49
DPPH is a free radical and becomes stable when received electrons or hydrogen from the flavonoid compound. The discoloration from purple to yellow indicates the capability of the sample to reduce radically.50,51 In this study, IC50 presented the concentration of extract to reduce radical 50%. The result ranged from 31.03-67.28 mg GAE/g. The highest antioxidant activity of DPPH observed in Gogo Niti II, followed by Gogo Niti II, Ketan Hitam I, and Care Hitam. Hydroxyl radical produced by Fenton reaction (Fe2+ + H2O2 à Fe3+ + OH– + OH*), then hydroxyl reacted with 2-deoxy-D-ribose to form malondialdehyde which caused pink color. The presence of phenolic compounds caused the competition between phenolic and 2—deoxy-D-ribose to reacted with hydroxyl radical.
Table 8: Antioxidant Properties of Pigmented Rice
| Variety | TP(mg GAE/g) | TF(mg QE/g) | TF/TP(%) | IC50 (µg/mL) | |
| DPPH scavenging | Hydroxyl scavenging | ||||
| Merah Saleman | 3.23 ± 0.05 b | 0.59 ± 0.03b | 18.27 ± 1.21a | 61.06 ± 0.92f | 132.32 ± 2.98 f |
| Mota | 2.17 ± 0.04 a | 0.43 ± 0.02a | 19.63 ± 1.26ab | 51.33 ± 0.79e | 116.08 ± 1.56 de |
| Beureum Taleus | 5.26 ± 0.10 d | 0.93 ± 0.02d | 17.63 ± 0.38a | 67.28 ± 0.89g | 132.48 ± 2.88 f |
| Anak Doro M | 4.80 ± 0.07 c | 1.03 ± 0.03e | 21.51 ± 0.65bc | 58.84 ± 2.02f | 121.66 ± 2.47 e |
| Cempo Salamet | 2,98 ± 0.05 b | 0.67 ± 0.04c | 22.49 ± 1.39cd | 46.78 ± 0.69d | 111.00 ± 2.74 d |
| Ketan Putri | 5.41 ± 0.06 d | 1.07 ± 0.01e | 19.85 ± 0.35ab | 53.34 ± 1.33e | 101.55 ± 4.69 c |
| Ketan Hitam I | 7.44 ± 0.17 e | 1.68 ± 0.01f | 22.62 ± 0.35cd | 36.68 ± 2.08b | 99.54 ± 3.89 c |
| Ketan Hitam II | 10.60 ± 0.34 g | 2.84 ± 0.02h | 26.77 ± 0.72e | 31.03 ± 1.26a | 72.74 ± 0.76 ab |
| Care Hitam | 7.19 ± 0.06 e | 1.72 ± 0.03f | 23.96 ± 0.38d | 41.01 ± 0.86c | 77.48 ± 2.31 b |
| Gogo Niti II | 9.51 ± 0.17 f | 2.32 ± 0.03g | 24.35 ± 0.15d | 32.48 ± 1.85a | 68.61 ± 2.66 a |
Data shown as the mean ± SD; n = 3, values followed by the same letters in the same column are not significantly different (p > 0.05), TP: Total Phenolic, TF: Total flavonoid. TF/TP: Percentage flavonoid in phenolic and IC50: The effective concentration of antioxidants to inhibit 50% activity of DPPH and hydroxyl radical.
The reaction of hydroxyl and phenolic can reduce malondialdehyde and decrease the intensity of the pink color.51 The result IC50 of Hydroxyl scavenging ranged from 68.61-132.48 mg GAE/g. Gogo Niti has the highest antioxidant, while Beureum Taleus has the lowest antioxidant. The various antioxidant activity influenced by genotype, grain color, and phenolic compound.10 The advantages of antioxidants were oxidative lipid damage and low-density lipoproteins, which inhibiting platelet aggregation and reducing coroner heart and cancer diseases. According to Nam et al.,50 plants the main sources of antioxidant; however, pigmented rice has also been found as a good source of antioxidant components. The extract of all samples is the potential resource of nature. According to Supriyadi et al.,52 (2019), natural resources with IC50 values bellow 500 μg/mL have great potential as nutraceutical resources. Besides, foodstuff and food products with high antioxidant activity attracted many people because of its superiority in the aspect of health.
Conclusion
The physicochemical properties of pigmented rice were significantly different. Amylose, lipid, and protein content in rice affected the pasting, thermal, and functional properties. The higher value of peak, trough, and final viscosities observed in low amylose flours but has a low pasting temperature. Lower thermal properties such as T0, TP, and TC found in Anak Doro M, and Cempo Salamet promoted a relatively high amylose content. The result of the antioxidant properties of all samples showed a potential activity for free radical scavenging, mainly observed in Ketan Hitam II and Gogo Niti. Further work on formulation food products using pigmented rice is highly recommended. All data from this research can be used to promote pigmented rice variety as ingredients in functional food products for the health-conscious consumer.
Acknowledgment
The research was supported by IsDB (Islamic Development Bank) 4-1 project, University of Jember and ministry of research and Technology/BRIN, Republik Indonesian,
Conflict of Interest
The author(s) declares no conflict of interest
References
- Murdifin M., Pakki E., Rahim A., Syaiful S. A., Ismail, Evari Y. M., Bahar M. A. Physicochemical properties of Indonesian pigmented rice (Oryza sativa) varieties from south Sulawesi. Asian Journal of Plant Science. 2015; 14(2):59-65.
CrossRef. - Goufo P., Trindade H. Rice antioxidants: phenolic acids, flavonoids, anthocyanins, proanthocyanidins, tocopherols, tocotrienols, c-oryzanol, and phytic acid. Food Science and Nutrition. 2014; 2(2): 75-104.
CrossRef. - Khoo H.E., Azlan A., Tang S.T., Lim S.M. Anthocyanidins and anthocyanins : colored pigments as food, pharmaceutical ingredients, and the potential health benefits. Food and Nutrition Research. 2017; 61(1): 1–20.
CrossRef. - Falade K. O., Christopher A. S. Physical, functional, pasting and thermal properties of flours and starches of six Nigerian rice varietys. Food Hydrocolloids. 2015; 44: 478-490.
CrossRef. - Deng G., Xu R., Zhang Y., Li D., Gan R., Li H. Phenolic compounds and bioactivities of pigmented rice. Critical Reviews in Food Science and Nutrition. 2013; 533(3): 296–306.
CrossRef. - Kadan R. S., Bryant R. J., Miller J. A. Effects of milling on functional properties of rice flour. Journal of Food Science. 2018; 73: 151-154.
CrossRef. - Thomas R., Wan-Nadiah W. A., Bhat R. Physiochemical properties, proximate composition, and cooking qualities of locally grown and imported rice varieties marketed in Penang, Malaysia. International Food Research Journal. 2013; 20(3): 1345-1351.
- Tavares A.C.K., Zanatta E., Zavareze E.R., Helbig E. The effects of acid and oxidative modification on the expansion properties of rice flours with varying levels of amylose. LWT – Food Science and Technology. 2010; 43(8): 1213–1219.
CrossRef. - Tharise N., Julianti E., Nurminah M. Evaluation of physico-chemical and functional properties of composite flour from cassava, rice, potato, soybean and xanthan gum as alternative of wheat flour. International Food Research Journal. 2014; 21(4): 1641-1649.
- Anggraini T., Novelina, Limber U., Amelia R. Antioxidant activities of some red, black and white rice cultivar from wes Sumatra, Indonesia. Pakistan Journal of Nutrition. 2015; 14(2): 112-117.
CrossRef. - IRRI (International Rice Research Institute). SES (Standart Evaluation System for Rice). Manila, Phipipines International Rice Research Institute; 2002: 55.
- AOAC International. Association of Official Analytical Chemists, Official Methods of Analysis, Gaithersburg, MD. USA., 2005.
- Amagloh F. K., Mutukumira A. N., Brough L., Weber J. L., Hardacre A., Coad J. Carbohydrate composition, viscosity, solubility, and sensory acceptance of sweetpotato and maize based complementary foods. Food & Nutrition Research. 2013; 57(1): 1-9.
CrossRef. - Bhat R., Yahya N. B. Evaluating belinjau (Gnetum gnemon) seed flour quality as a base for development of novel food products and food formulations. Food Chemistry. 2014; 42-49.
CrossRef. - Juliano B. O. A simplified assay for milled-rice amylose. Cereal Science Today. 1971; 16(11): 334-336.
- Kraithong S., Lee S., Rawdkuen S. Physicochemical and functional properties of Thai organic rice flour. Journal of Cereal Science. 2018; 79:2 59-266.
CrossRef. - Siswoyo T.A., Morita N. Thermal properties of partially hydrolyzed starch-glycerophosphatidylcholine complexes with various acyl chains. Journal of Agricultural and Food Chemistry. 2003; 51(10): 3162-3167.
CrossRef. - Ali A., Wani T. A., Wani I. A., Masoodi, F. A. Comparative study of the physico-chemical properties of rice and corn starches grown in Indian temperate climate. Journal of the Soudi Society of Agricultural Sciences. 2016; 15(1): 75-82.
CrossRef. - Taga M. S., Miller E. E., Prat D. E. Chua seeds as a source of natural lipids antioxidants. Journal of the American Oil Chemists’ Society. 1984; 62: 928-929.
CrossRef. - Itidiel C., Chokri M., Mohamed B., Yosr Antioxidant activity, total phenolic and flavonoid content variation among Tunisian natural populations of Rhus tripartita (Ucria) Grande and Rhus pentaphylla Desf. Industrial Crops and Product. 2013; 51: 171-177.
CrossRef. - Palombini S. V., Maruyama S. A., Claus T., Carbonera .F, Souza N. E. D., Visentainer J. V., Gomes S. T. M., Matsushita M. Evaluation of antioxidant potential of Brazilian rice cultivars. Food Science and Technology. 2013; 33(4): 699-704.
CrossRef. - Halliwell B., Gutteridge J. M. C., Aruoma O. The deoxyribose method: A simple “test-tube” assay for determination of rate constants for reactions of hydroxyl radicals. Analytical Biochemistry. 1987; 165(1): 215-219.
CrossRef. - Susiyanti S., Rusmana R., Maryani Y., Sjaifuddin S., Krisdianto N., Syabana M. A. The physicochemical properties of several Indonesian rice varieties. Biotropia. 2020; 27(1): 41-50.
- Adu-kwarteng E., Ellis W. O., Oduro I., Manful J. T. Rice grain quality: a comparison of local varietas with new varietas under study in Ghana. Food Control. 2003; 14(7): 507-514.
CrossRef. - Afshari H., Eftekhari M., Faraji M., Ebadi A.G., Ghanbarimalidareh A. Studying the effect of 1000 grain weight on the sprouting of different species of Salvia L . grown in Iran. Journal of medicinal plant research. 2011; 5(16): 3991–3993.
- Cuevas R. P., Pede V. O., McKinley J., Velarde O., Demont M. Rice grain quality and consumer preferences: a case study of two rural towns in the Philippines. Plos One. 2016; 11(3): 1-17.
CrossRef. - Ye L., Wang C., Wang S., Zhou S., Liu X. Thermal and rheological properties of brown flour from Indica Journal of Cereal Science. 2016; 70: 270-274.
CrossRef. - Shao Y., Hu Z., Yu Y., Mou R., Zhu Z., Beta T. Phenolic acids, anthocyanins, proanthocyanidins, antioxidant activity, minerals and their correlations in non‐pigmented, red, and black rice. Food Chemistry. 2018; 239: 733-741.
CrossRef. - Varastegani B., Zzaman W., Yang T.A. Investigation on physicochemical and sensory evaluation of cookies substituted with papaya pulp flour. Journal of Food Quality, 2015; 38(3): 175-183.
CrossRef. - Moralez-Martínez L. E., Bello-Pérres, Sánchez-Rivera M. M., Ventura-Zapata E., Jiménez-Aparicio A. R. Morphometric, physicochemical, thermal, and rheological properties of rice (Oryza sativa) cultivars Indica × Japonica. Food and nutrition Sciences. 2014; 5(03):271-279.
CrossRef. - Lawal O. S., Lapasin R., Bellich B., Olayiwola T. O., Cesàro A., Yoshimura M., Nishinari K. Rheology and functional properties of starches isolated from five improved rice varieties from West Africa. Food Hydrocolloids. 2011; 25:1785-1792.
CrossRef. - Wang L., Guo J., Wang R., Shen C., Li Y., Luo X., Li Y., Chen Z. Study on quality of potato flour blends with rice flour for making extruded noodles. Cereal Chemistry Journal. 2016; 93(6): 593-598.
CrossRef. - Otegbayo B., Oguniyan D., Akinwumi O. Physicochemical and functional characterization of yam starch for potential industrial applications. Starch. 2014; 66 (3-4): 235–250.
CrossRef. - Abioye V. F., Ade-Omowaye B. I. O., Babarinde G. O., Adesigbin M. K. Chemical, physico-chemical and sensory properties of soy-plantain flour. African Journal of Food Science. 2011; 5:176-180.
- Hsu R.J., Lu S., Chang Y., Chiang W. Effects of added water and retrogradation on starch digestibility of cooked rice flours with different amylose content. Journal of Cereal Science. 2014; 61: 1–7.
CrossRef. - Ahmed J., Al-Jassar S., Thomas L. A comparison in rheological, thermal, and structural properties between Indian Basmati and Egyptian Giza rice flour dispersions as influenced by particle size. Food Hydrocolloids. 2015; 48:72-83.
CrossRef. - Kong X., Zhu P., Sui Z., Bao J. Physicochemical properties of starches from diverse rice cultivars varying in apparent amylose content and gelatinisation temperature combinations. Food Chemistry. 2015; 172: 433–440.
CrossRef. - Jamal S., Qazi I. M., Ahmed I. Comparative studies on flour proximate compositions and functional properties of selected pakistani rice varieties. Life and Environmental Sciences. 2016; 53(1):47–56.
- Kaur P., Pingh N., Pal P., Kaur A. Variation in composition, protein and pasting characteristics of different pigmented and non pigmented rice (Oryza sativa) grown in Indian Himalayan region. Journal Food Science and Technology. 2018; 55(9): 3809–3820.
CrossRef. - Odenigbo A. M., Ngadi M., Ejebe C., Nwankpa C., Danbaba N., Ndindeng S., Manful J. Study on the gelatinization properties and amylose content of rice varieties from Nigeria and Cameroun. International Journal of Nutrition and Foods Sciences. 2013; 2(4): 181-186.
CrossRef. - Zeng F., Ma F., Kong F., Gao Q., Yu S.. Physicochemical properties and digestibility of hydrothermally treated waxy rice starch. Food Chemistry. 2015; 172: 92–98.
CrossRef. - Singh H., Lin J., Huang W., Chang Y. Influence of amylopectin structure on rheological and retrogradation properties of waxy rice starches. Journal of Cereal Science. 2012; 56(2): 367-373.
CrossRef. - Keawpeng I., Meenune M. Physicochemical properties of organic and inorganic Phatthalung Sungyod rice. International Food Research Journal. 2012; 19(3): 857-861.
- Aprianita A., Vasiljevic T., Bannikova A., Kasapis S. Physicochemical properties of flours and starches derived from traditional Indonesian tubers and roots. Jornal of Food Science and Technology. 2013; 51(12): 3669–3679.
CrossRef. - Chung H., Liu Q., Lee L., Wei D. Relationship between the structure, physicochemical properties and in vitro digestibility of rice starches with different amylose contents. Food Hydrocolloids. 2011; 25(5):968-975.
CrossRef. - Sarangpani C., Thirumdas R., Devi Y., Trimukhe A., Deshmukh R. R. , Annapure U. Effect of low-pressure plasma on physicoechemical and functional properties of parboiled rice flour. Food Science and Technology. 2016; 69:482-489.
CrossRef. - Shen Y., Jin L., Xiao P., Lu Y., Bao J. Total phenolics, flavonoids, antioxidant capacity in rice grain and their relations to grain color, size and weight. Food Chemistry. 2009; 49(1):106-111.
CrossRef. - Patel D., Kumar R., Laloo D., Hemalatha S. Natural medicines from plant source used for therapy of diabetes mellitus: An overview of its pharmacological aspects. Asian Pacific Journal of Tropical Disease. 2012; 2(3):239-250.
CrossRef. - Manukumar H. M., Thribhuvan K. R. In-vitro evaluation of physicochemical, antioxidant and anti-inflammatory activity of pomegranate (Punica granatum) juice and seed hydro extracts. International Journal of Pharma and Biosciences. 2014; 5(1):131-141.
- Yaqoob S., Sultana B., Mushtaq M. In vitroantioxidant activities of Trianthema portulacastrum Hydrolysates. Nutrition and Food Science. 2014; 19(1):27-33.
CrossRef. - Nam S. H., Choi S. P., Kang M. Y., Koh H. J., Kozukue N., Friedman M. Antioxidative activities of bran extracts from twenty one pigmented rice cultivars. Food Chemistry. 2006; 94(4):613-620.
CrossRef. - Supriyadi A., Arum L. S., Nugraha A. S., Ratnadewi A. A. I., Siswoyo T. A. Revealing Antioxidant and Antidiabetic Potency of Melinjo (Gnetum Gnemon) Seed Protein Hydrolysate at Different Stages of Seed Maturation. Current Research in Nutrition and Food Science. 2019; 7 (2): 479-487.
CrossRef.
Accepted on: 24/7/2020
Final Approval by: Dr. Pierluigi Plastina


Web of Science Coverage
Emerging Sources Citation Index (ESCI)
2024 Journal Impact Factor: 1.1
Scopus Journal Metrics
CiteScore 2025: 2.6
CiteScore Details
Sustainable Nutrition: Food Systems, Nutrient Retention, and Public Health Impact
![]()
This journal is a member of, and subscribes to the principles of, the Committee on Publication Ethics (COPE)


