Characterization of Rice Flour Quality Using Artificial Neural Network – Genetic Algorithm for Production of Zhero: An Ethnic Himalayan Snack Product
 , Sujata Jena1* and Sitesh Kumar2
 1Department of Processing and Food Engineering, Central Agricultural University, Ranipool, India
2Department of Agricultural and Food Engineering, Indian Institute of Technology Kharagpur, Kharagpur, India.
Corresponding Author’s Email: drsujatajena@gmail.com
DOI : http://dx.doi.org/10.12944/CRNFSJ.14.1.28
Download this article as:
![]()
Zhero is an indigenous popular snack product of Bhutia and Tamang tribe of Sikkim, India. The present study focusses on standardizing its process operations such as soaking and grinding for production of uniform quality rice flour to be used as raw material in Zhero preparation for commercial processing. The effects of soaking time, St (4 – 8 h) and temperature, ST (15-25 °C) and grinding time, GT (1 – 2 minutes) on the characteristics of rice flour have been studied. The process parameters were optimized using a multi-objective genetic algorithm (GA) along with a three-layer feed forward artificial neural network (ANN). The ANN model developed could satisfactorily predict all responses with R value of 0.999 for all training, testing, validation and global sets of data and MSE value 0.01883 for validated dataset. The final optimum conditions (St: ST: GT) were 4.2 h, 18 ℃, and 1 min respectively. The predicted rice flour quality at optimized process conditions were: 23.85 % w b moisture content, 0.543 g/cm3 bulk density, 0.57 g/cm3 tapped density, 28.09° angle of repose, 0.31 mm particle size, Carr’s index 5.055 and HR ratio 1.05. The experimental and ANN-GA model predicted responses had a relative percent error of < 10%, suggesting suitability of the developed model. This study represents a new attempt to conduct appropriate scientific research to determine the consistency of the production process and the quality of the final product, not only to confirm its origin and maintain its culture, but also to improve and standardize its technology for future commercial success.
KEYWORDS:ANN-GA; Grinding; Optimization; Rice Flour; Soaking; Traditional Snack; Zhero
Introduction
Traditional foods serve as a symbol of heritage, trademark, and culture, in addition to providing an important opportunity for food diversification. It is the cuisine of a nation or ethnic group that is considered culturally and socially acceptable to consumers outside of that ethnic group. The processing and preparation of ethnic meals not only demonstrates local people’s creativity and food heritage, but also their progressive learning to support life and the ecosystem altogether. Singh et al.1 Traditional food are indispensable in eating habits of ethnic and tribal groups worldwide, with distinct flavours and tastes.
Zhero is an indigenous rice-based snack food of North Eastern region of India widely popular in Bhutia and Tamang tribes of Sikkim. Tamang and Thapa2 The traditional processing method of Zhero is a crude method based mostly on experience of ethnic groups. The production of Zhero includes various unit operations viz., soaking, grinding, batter preparation (mixing), frying and packaging which are done using traditional methods, utensils and tools. Proper quality of rice flour and batter are crucial in the production of good quality Zhero. The traditional processing method is time consuming, labour-intensive and leads to unhygienic production and non-uniformity in the quality of rice flour, batter and final finished product. This necessitates proper scientific investigation of different unit operations involved and characterization of rice flour for ascertaining the uniformity in production process and best quality of finished product.
Any rice-based product’s quality is determined by the physico-chemical characteristics and particle size distribution of the rice flour. Singh and Prasad3 These properties are inherently dependent on the soaking and grinding parameters followed during the processing of the final product. Ogunnigbo et aI.4 In case of soaking, the rice flour quality is influenced by both soaking time and temperature. The moisture content of rice after soaking appears to be a significant factor in loosening and softening the structure of rice kernels, resulting in the formation of small particle flours with minimal starch degradation. Chiang and Yeh5 Grinding is an important size reduction process used to produce fine rice flour used in Zhero production. Grinding time is the key factor which determines the particle size of the rice flour used in Zhero. Singh and Prasad.3
Physico-chemical parameters of granular solids/powder influence its flow behaviour and storage. Rice flour properties such as bulk density, kernel density and porosity affect its handling characteristics. Bian et al.6 The flowability of rice flour after grinding is significantly influenced by its moisture level. Tran et al.7 The change in particle size distribution of grain flours affects the quality of their products. When rice flour is used to make rice foods, each product requires a different particle size distribution. Flour that is ground too finely can lead to transportation issues during manufacturing, whereas excessively large particles can give the final product an undesirably coarse texture. Generally, finer particles exhibit higher swelling power, forming a more rigid gel structure and providing greater stability compared to coarser particles. Qian and Zhang⁸ The particle size distribution of rice flour also plays a key role in determining its flowability. Jan et al.⁹ Investigating the combined effects of soaking and grinding on rice flour quality for Zhero batter production is a complex process that requires robust modelling approaches. Parrenin et al.¹⁰ Such approaches are essential for standardizing flour quality to enable consistent, large-scale commercial production of Zhero.
Artificial neural network (ANN) offers significant learning ability and promise for determining and modeling the complicated non-linear relationship between multiple variables of a system. ANN can be regarded as a powerful tool for predictive modelling of responses arising from complex nonlinear behaviour of independent variables of a process. The multi-objective genetic algorithm (MOGA) is a search-based optimization method that optimizes multiple conflicting goals simultaneously under specific circumstances. Sadhu et al.11 By employing a fitness function-based probabilistic frequentative global search method, this decision-making tool simulates biological evolution into a global optimum solution. Belna et al.12 Any complicated process model can be predicted and optimized with the help of ANN and GA. Rajendra et al.13 There are numerous uses of ANN and GA, including drying, Kalathingal et al.14 plant processing, Kumar et al.,15 Jaddu et al.,16 Yang et al.17 and process optimization for developing products. Sadhu et al.11
As per the literature survey, no research has been conducted on the standardization of traditional process, mechanization and quality of Zhero till date. Hence, proper study is required not just to validate its historical roots and conserve its culture, but also to enhance and standardise its technology for possible commercialization. In view of these research gaps, the adequate research is essential in addition to authenticate its originality and conserve its culture, but also to refine and standardise its technology for potential commercialization. The purpose of this study was to characterize the rice flour used in Zhero preparation and to optimize the soaking and grinding parameters using ANN-MOGA approach.
Materials and Methods
Material and rice flour preparation
Local variety of rice (LS1) of Sikkim was used from the local markets of Ranipool. India. Rice was soaked in water at different temperature (15 ℃ -25 ℃) and for different soaking time (4 to 8 h). The soaked rice was drained and shade dried for about 1.5-2 h based on preliminary trials to reduce the surface moisture. The dried rice was then ground for 1-2 mins at low speed (20875 rpm) using a kitchen grinder (Phillips HL7757,750 W, Netherland). The ground rice flour was stored in LDPE pouches till further analysis. The ground rice flour was analysed for various physical properties. Rice flour used for zhero preparation at villages was also collected and analysed for comparison. This was treated as the control sample.
Analysis of rice flour
The prepared rice flour and control flour were analysed for moisture content, particle size, angle of repose, bulk density, tapped density and flowability using following methods. All measurements were done in triplicate.
Moisture content
Moisture content of rice flour was measured as per the method described by Düsenberg et al.18 using moisture analyser (HC103, Mettler Toledo, UK) at 105 ℃.
Bulk density and Tapped density
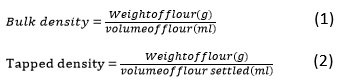
The bulk density of rice flour was measured by carefully pouring the sample into a standard graduated cylinder, following the specified procedure. The sample was first added until the cylinder reached a 100 ml volume and then weighed. The cylinder was tapped around ten times on a level surface for proper compaction. After tapping, more material was added to bring the volume back to 100 ml, and the cylinder was weighed again. The bulk and tapped densities of the rice flour were then calculated using the recorded weights and the volume of the cylinder.
Angle of repose
The angle of repose, Φ was measured as per the procedure described by Jan et al.9 On a level surface, a hollow cylinder was set, and rice flour was poured on top. In order to minimize the wall effect and assure consistent packing, the samples were tapped. The tube was progressively lifted off the ground so that the material could flow freely and form a cone. The following formula was used to determine Φ.

where h is the height of the cone (mm), Φ is the angle of repose (◦); D is the diameter of the cone (mm).
Flowability
Flowability was calculated as per the method outlined by Jan et al.9 Flowability was measured using the Carr index and the Hausner ratio, that depends on inter-particle friction and are derived by the difference between the bulk and tap density of the powders. It was measured based on the given equation:

Where ρb is the bulk density (g/cm3) and ρt is the tapped density (g/cm3)
Particle size distribution
The particle size distribution of the rice flour sample was determined using the method described by Subba and Katawal19 An ASTM-standard sieve set, consisting of sieves with aperture sizes of 600, 425, 300, 212, and 150 µm, was employed. The sieve stack was arranged with the largest mesh size at the top and the smallest at the bottom. The sample was placed on the top sieve, and the entire assembly was subjected to mechanical shaking to promote particle separation. The material retained on each sieve was carefully collected and weighed to determine the particle size distribution. The fineness modulus and average particle size were calculated using equations (6) and (7), respectively, as presented by Sonaye and Baxi.20

Experimental design
Box Behnken design was followed for soaking and grinding experiments using Design Expert 13.0 software. The experiments consisted of three independent variables viz., soaking temperature, soaking time and grinding time and seven dependent variables viz., moisture content, particle size, angle of repose, bulk density, tapped density, Carr index and Hausner ratio. There were three levels for each independent variable. The experimental design is given in Table 1. Total seventeen number of experiments were conducted during the study. The relative effects of the independent variables on the responses were evaluated by artificial neural network (ANN) Each independent variable had three levels. Table 1 depicts the experimental design. The ANN models developed were used for optimization of process parameters by applying multi-objective genetic algorithm (MOGA) using MATLAB software (Version R2017a, The MathWorks, Inc., Natick, MA, USA).
Modelling and Optimization
MATLAB software (Version R2017a, The MathWorks, Inc., Natick, MA, USA) was employed to model and optimize the independent parameters using a multilayer feed-forward neural network (MLFFN) design and a genetic algorithm, respectively. Khawas et al.²¹ The selected MLFFN architecture consisted of an input layer, one hidden layer, and an output layer. The complete experimental dataset (17 runs) was replicated three times (51 data points) and partitioned into training, validation, and testing sets in an 80:10:10 ratio. Srikanth et al.²²
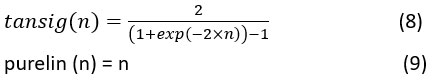
The input layer comprised three neurons corresponding to soaking temperature, soaking time, and grinding time, while the output layer consisted of seven neurons representing moisture content, particle size, bulk density, tapped density, angle of repose, Carr index, and Hausner ratio. The hidden layer contained 10 neurons, each connected by a bias value. The network was trained using the Levenberg–Marquardt backpropagation algorithm (trainlm). The hidden layer utilized a hyperbolic tangent sigmoid (tansig) transfer function, whereas the input layer had no transfer function and the output layer used a linear (purelin) transfer function. The mathematical representations of the tansig and purelin functions are provided in Equations (8) and (9).
To predict the dependent parameters, the network utilized the hidden layer to process information sequentially from the input layer to the output layer. During training, backpropagation was employed, propagating errors in the reverse direction to compute the difference between actual and predicted outputs. This error was then used to iteratively update the weights and biases of both the hidden and output layers. Kalathingal et al.¹⁴ Through repeated forward and backward computations, optimized weights and biases were obtained, enabling accurate prediction of outputs within the range of the training data. Model validation was performed using the test dataset.
The performance of the trained model was evaluated based on the mean squared error (MSE) and the regression correlation coefficient (R). Training was terminated once the network achieved the highest R and the lowest MSE across training, validation, and testing datasets. The MSE was calculated using the following equation:

where, n is the number of data sets, Ya is the experimental response, Yp is the predicted response of ith set, and Ym is the mean of experimental response.
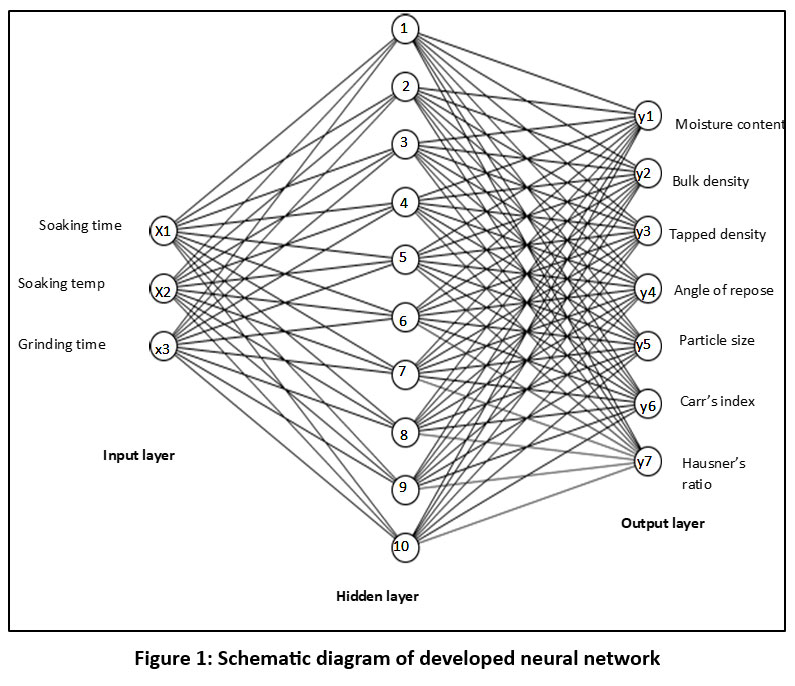 |
Figure 1: Schematic diagram of developed neural network |
Optimization using Genetic algorithm
The genetic algorithm was implemented to optimize for maximum values. Hence, minimization objectives were reformulated as maximization problems by adjusting the fitness values. This adjustment was performed either by inverting the objective function or by altering its sign. The resulting responses were then improved through iterative processes including selection, reproduction, crossover, and mutation. Erenturk and Erenturk.23 For optimization, the fitness function was constructed by maximizing the HR ratio and minimizing moisture content, angle of repose, particle size, and Carr’s index. Consequently, the fitness function is defined as follows:
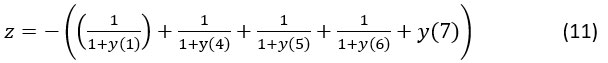
Where, y(1) is moisture content, y(4) is angle of repose, y(5) is particle size, y(6) is Carr’s index and y(7) is HR ratio. The ANN model was used to derive the expression for these variables. The program was run with 51 initial populations, and optimization was done in MATLAB® 2017a. While holding all other factors constant, each of these was changed one at a time. An optimal process parameter and associated fitness value were obtained after 93 iterations. The resulting figure showed the change in fitness levels over each interval.
Results
Experimentation
Rice flour samples were soaked and ground varying the soaking and grinding conditions as per the Box-Behnken design (Table 1). All the physico-chemical parameters of rice flour samples were evaluated. Table 1 depicts the values of all the responses measured.
Table 1: Experimental design and response values.
|
Run |
Soaking time (h) | Soaking temp, ℃ | Grinding time (mins) | Moisture content, % w.b. | Bulk density g/cm3 | Tapped density g/cm3 | Angle of repose, ° | Particle size, mm | Carl index | HR ratio |
|
1 |
8 | 20 | 1 | 25.29aeg (0.287) | 0.48bdg (0.014) | 0.527bdg (0.010) | 26.5adg (0.994) | 0.272adg (0.006) | 8.92beg (0.197) | 1.098bfg (0.041) |
| 2 | 6 | 20 | 1.5 | 26.09beg (0.296) | 0.46adg (0.013) | 0.526adh (0.008) | 26.4adg (0.990) | 0.284adg (0.006) | 12.55cei (0.277) |
1.143cfi (0.042) |
|
3 |
8 | 15 | 1.5 | 23.78adg (0.270) | 0.54beg (0.016) | 0.603beh (0.010) | 24.2adg (0.110) | 0.277adg (0.006) | 10.45bdi (0.023) |
1.117bdi (0.041) |
| 4 | 4 | 20 | 1 | 25.9aeg (0.294) | 0.5bdg (0.015) | 0.500adg (0.007) | 27.8adg (1.043) | 0.241adg (0.006) | 0.00aeg (0.000) |
1.000afg (0.037) |
|
5 |
6 | 15 | 2 | 25.13bdg (0.285) | 0.48aeg (0.014) | 0.516aeg (0.002) | 28.5adg (1.069) | 0.289adg (0.007) | 6.98cdh (0.154) | 1.075cdh (0.040) |
| 6 | 6 | 20 | 1.5 | 25.49bdeg (0.290) | 0.47adg (0.014) | 0.532adh (0.003) | 29.0adg (1.088) | 0.238adg (0.006) | 11.65cei (0.258) |
1.132cfi (0.042) |
|
7 |
6 | 25 | 2 | 25.75beg (0.292) | 0.47aeg (0.014) | 0.519aeg (0.008) | 28.2adg (0.958) | 0.261adg (0.006) | 9.44ceh (0.209) | 1.104ceh (0.041) |
| 8 | 6 | 20 | 1.5 | 26.09aeg (0.296) | 0.46adg (0.014) | 0.526adh (0.008) | 26.4adg (0.990) | 0.284adg (0.007) | 12.55cei (0.277) |
1.143cfi (0.042) |
|
9 |
4 | 20 | 2 | 25.79aeg (0.293) | 0.5bdg (0.015) | 0.55adg (0.003) | 27.5adg (0.110) | 0.287adg (0.006) | 9.09aeh (0.201) | 1.100afh (0.041) |
| 10 | 8 | 20 | 2 | 25.29aeg (0.287) | 0.48bdg (0.014) | 0.527bdg (0.008) | 26.5adg (0.994) | 0.272adg (0.006) | 8.92beh (0.197) |
1.098bfh (0.041) |
|
11 |
6 | 25 | 1 | 25.97bdeg (0.295) | 0.48aeg (0.014) | 0.533aeg (0.010) | 30.3adg (1.137) | 0.239adg (0.006) | 9.94ceg (0.220) | 1.110ceg (0.041) |
| 12 | 4 | 15 | 1.5 | 25.26adg (0.287) | 0.5beg (0.015) | 0.515aeg (0.006) | 27.7adg (1.039) | 0.299adg (0.007) | 2.91adi (0.064) |
1.030adi (0.038) |
|
13 |
6 | 20 | 1.5 | 26.09beg (0.296) | 0.46adg (0.014) | 0.526adh (0.006) | 26.4adg (0.990) | 0.284adg (0.007) | 12.55cei (0.277) | 1.143cfi (0.042) |
| 14 | 4 | 25 | 1.5 | 23.5adeg (0.267) | 0.51beg (0.015) | 0.550aeh (0.008) | 28.3adg (0.260) | 0.273adg (0.007) | 7.27aei (0.161) |
1.078aei (0.040) |
|
15 |
6 | 15 | 1 | 25.86bdg (0.294) | 0.49aeg (0.015) | 0.540aeg (0.007) | 28.4adg (1.066) | 0.261adg (0.006) | 9.26cdg (0.205) | 1.102cdg (0.041) |
| 16 | 8 | 25 | 1.5 | 26.08adeg (0.296) | 0.516beg (0.015) | 0.567beh (0.009) | 31.6adg (1.186) | 0.333adg (0.008) | 8.99bei (0.119) |
1.099bei (0.041) |
|
17 |
6 | 20 | 1.5 | 25.49beg (0.290) | 0.47adg (0.014) | 0.532adh (0.006) | 29.0adg (1.088) | 0.238adg (0.006) | 11.65cei (0.258) | 1.132cfi (0.042) |
| 18. | Control | 22.75 (1.58) | 0.503 (0.011) | 0.573 (0.008) | 29.3 (1.23) | 0.292 (0.027) | 5.15 (0.32) | 1.15 (0.13) | ||
Neural network modelling
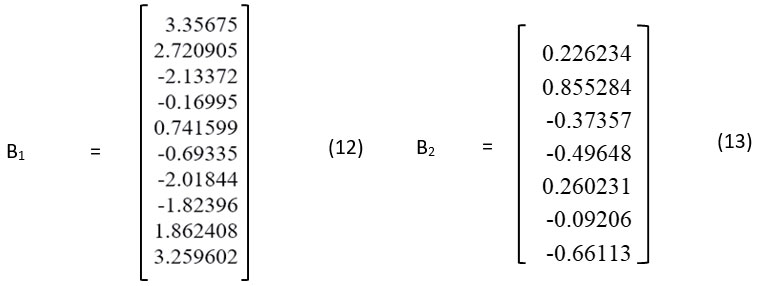
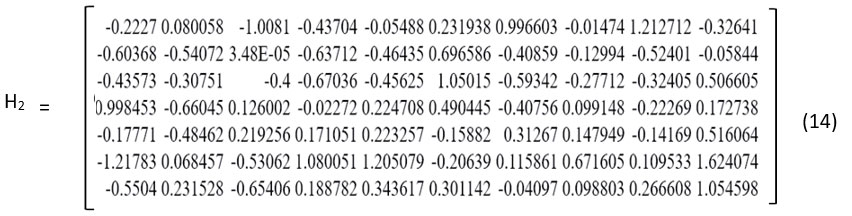
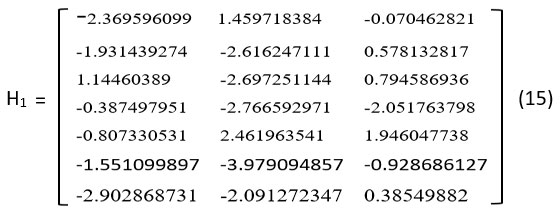
Using the experimental dataset, the neural network was trained and tested to evaluate its predictive performance. The model’s accuracy was assessed using the regression correlation coefficient (R) and mean squared error (MSE). The training, validation, and testing datasets each achieved a maximum R value of 0.999, indicating an excellent correlation between predicted and experimental results, along with a minimum MSE of 0.0188. The optimal weights and biases obtained for the trained neural network are presented in Equations (12) – (15).
The matrices H₁ and H₂ represent the connection weights between the input and hidden layers, and between the hidden and output layers, respectively. Similarly, the biases in the hidden and output layers are represented by B₁ and B₂. The regression analysis, error histogram, and performance metrics of the trained ANN are presented in Fig 2. The regression plot (Fig 2b) demonstrates the agreement between predicted and experimental values for all types of datasets. The R-values for the analysis are close to 1 (0.999), confirming a very strong correlation. The error histogram (Figure 2d) indicates that the largest error observed is minimal (0.0297), suggesting high prediction accuracy. Fig 2a shows the mean squared error (MSE) plotted against the number of training epochs, illustrating the progressive improvement of the network’s learning. The optimal validation performance was obtained after 30 epochs, yielding a minimum mean squared error (MSE) of 0.01883. Overall, these results confirm that the developed ANN model exhibits excellent predictive capability, with outputs closely matching the experimental data.
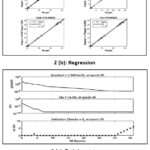 |
Figure 2: Post-training (a) performance, (b) Regression, and (c) Training state (d)) Error histogram analysis for the generated ANN model. |
Relative influence of process parameters on quality of rice flour
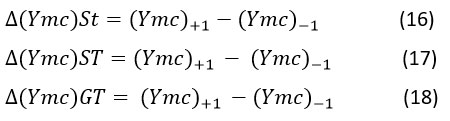
The relative significance of the independent variables (xSt, xST, xGT) for predicting responses (yMC, yBD, yTD, yAR, yPS, yCI and yHR) were determined by using neural network model. In order to analyse the effect of xSt, on yMC the coded value of xSt was set at ±1, and the other three independent variables xST and xGT were set to zero. Similar to this, the relative impact of independent parameters on the response MC(yMC), BD(yBD), TD(yTD), AR(yAR), PS(yPS), CI(yCI) and HR(yHR) were obtained by computing the values of Δymc(St)(ST)(Gt), Δybd(St)(ST)(Gt) Δytd(St)(ST)(Gt) Δyar(St)(ST)(Gt) Δyps(St)(ST)(Gt) Δyci(St)(ST)(Gt) Δyhr(St)(ST)(Gt) using Equations (16) to (18).24 The obtained relative influence of xSt, xST and xGT is presented in Table 2.
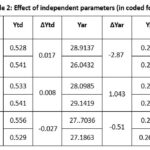 |
Table 2: Effect of independent parameters (in coded form) |
Discussion
The moisture content of rice flour for different treatments of St, GT and ST varied in the range 23.78 – 26.09 % w. b. (Table 1). This value is close to the moisture content of control flour (22.75 ± 1.58 % w. b). From the analysis given in Table 2, (∆Ymc)ST>(∆Ymc)St>(∆Ymc)GT trend was observed which suggests that xST has the highest effect on moisture content and grinding time has the least effect on moisture content of samples. The moisture content of the flour increased significantly with increased soaking time and temperature. Kajihausa et al.25 reported a similar tendency for sprouted sesame seed flour, as did5 for rice flour. This effect may be due to the increased rate of moisture diffusion into the rice kernels at higher temperature and longer time. According to Yeh et al.26 moisture diffusivity increases with temperature thereby leading to increased moisture diffusion in the rice kernels ate higher temperature.
The particle size of rice flour varied between 0.261 and 0.333 mm depending on the combination of independent variables (Table 1). The control flour had a particle size of 0.292 ± 0.027 mm, which is within the range for different treatments. From Table 2, it can be observed that (∆Yps)St>(∆Yps)GT>(∆Yps)ST which suggests that soaking time has the highest negative effect on particle size followed by the positive effects of grinding time and soaking temperature. Longer soaking time might have led to more moisture diffusion into the rice kernels making them softer and easily fragmentable to fine powder form.3 also cited similar behaviour where particle size distribution was influenced by semi wet grinding and soaking. Particle size of flour increased with increase in grinding time and soaking temperature which may be due to lump formation from finely ground rice flour caused by the heat released during longer grinding time. However, the effects of soaking and grinding conditions on the particle size were found to be non-significant which is in accordance with the findings reported by Kijima et al.27
The bulk density of prepared flour samples varied in the range 0.46-0.54 g/cm3 for different combination of independent variables (Table 1). These values are in agreement with the values determined for control rice flour (0.503 ±0.011). Similarly, Table 2 showed a trend of (∆Ybd)GT>(∆Ybd)St>(∆Ybd)ST, indicating that xGT has the greatest negative influence on bulk density. Likewise, for tapped density the values ranged between 0.5 and 0.603 as cited in Table 1 for different combination of independent variables. The control rice flour also showed similar range of tapped density values of 0.573 ± 0.008 g/cm3 (Table 1). From the comparison of relative influence of independent variables of tapped density, (∆Ytd)GT>(∆Ytd)St>(∆Ytd)ST trend was observed (Table 2). This could be attributed to the greater particle size of lumps at higher grinding times. According to Jung et al.28 the physical and chemical qualities of food powder determine its bulk properties, such as bulk density and flowability. The bulk density decreased with increasing soaking time Antarlina et al.29 showed similar results for white sorghum flour. At higher levels, the effects of soaking and grinding parameters on bulk density and tapped density were not significant (Table 1).
The angle of repose range of rice flour samples was 24.2° -31.6° for different combination of St, GT and ST (Table 1). The control zhero rice flour had an angle of repose of 29.3° ± 1.23, which was within the measured range of the flour samples investigated in this experiment. From the analysis shown in Table 2, a trend of (∆Yar)St>(∆Yar)ST>(∆Yar)GT was observed citing highest and lowest negative effect of xSt and xGT on angle of repose respectively. Soaking temperature showed positive effect on angle of repose of rice flours. This trend is similar to the trend observed for particle size. It could be due to more moisture absorption by rice kernels at longer soaking duration which might have led to formation of fine cohesive rice resulting in higher angle of repose. As per the report by Jan et al.9 angle of repose is influenced by the particle size reduction. During the process, the reduction in particle size is more because of the involvement of soaking process. The interstitial spaces between larger particles are occupied by smaller particles, and with the increase in contact points leading to greater cohesiveness, the angle of repose was observed to increase as particle size decreased. As shown in Table 1, all of the independent variables impact on angle of repose were found to be non-significant.
The value of HR for rice flour samples ranged between 1.00 and 1.143 for different combination of independent variables whereas Carr’s index varied between 2.91 and 12.55 (Table 1). The values of HR and CI for control rice flour were found to be 1.15 ± 0.13 and 5.15 ± 0.32 respectively. results fall within the range of those recorded for the rice flour samples under study. The values of HR and CI values for all studied samples were < 1.18 and < 15.0 respectively which indicated good to excellent flowability of the zhero rice flour. Nabavi et al.30 These Hausner’s ratio and Carr’s index are directly related to density and particle size of ground flour. From the present study, the trend observed was (∆Yci)St>(∆Yci)ST>(∆Yci) GT for Carr’s index and (∆Yhr)GT>(∆Yhr)St>(∆Yhr)St for HR, which implies that soaking conditions have highest effect on CI and HR. According to, Jan et al.9 enhanced interparticle forces or mechanical interlocking contribute to increased particle cohesion, resulting in reduced flowability as indicated by higher values of the Hausner Ratio and Carr’s Index. From the above discussion, it can be concluded that bulk and tapped density are directly related to grinding conditions, which also affect flour flowability, resulting in a favourable effect on HR values.
Optimisation using GA
The developed ANN model was combined with MOGA to optimize the independent variables viz., soaking time, soaking temperature and grinding time. After 93 iterations, the optimal process parameters and fitness values were determined. The generated plot showed the change in fitness levels over each interval. The optimization was carried out to maximise the HR ratio while minimising moisture content, angle of repose, particle size and Carr’s index. Fig. 3 illustrates the changes in fitness values over successive generations and the mean fitness value was – 8.05319 × 10⁶. After GA, the optimized values were obtained at 4.2 h soaking time, 18 ℃ soaking temperature and 1.0 min of grinding time. At the optimal conditions, the expected values of responses obtained were 23.85 % w b moisture content, 0.543 g/cm3 bulk density, 0.57 g/cm3 tapped density, 28.09° angle of repose, 0.31 mm particle size, Carr’s index 5.055 and HR ratio 1.05. These results were validated by conducting experiments under the optimized process conditions. The relative percentage error (RPE) between the experimental and predicted responses obtained was in the range of 1.01-4.44% (< 10%) which indicates good validation of model. (Table 3).
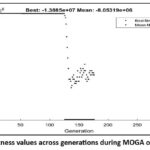 |
Figure 3: Fitness values across generations during MOGA optimization |
Table 3: Validation of the ANN-GA optimized results
|
Statistical parameters |
Moisture content, % wb |
Bulk density, g/cm3 |
Tapped density, g/cm3 |
Angle of repose, º |
Particle size, mm |
HR ratio | Carr’s index |
|
Actual value (ya) |
24.46
(0.53) |
0.533
(0.05) |
0.565
(0.012) |
27.81
(0.31) |
0.301
(0.012) |
1.10
(0.18) |
5.108
(0.234) |
| Predicted value (yp) | 23.85 | 0.543 | 0.576 | 28.095 | 0.315 | 1.055 |
5.055 |
|
RPE (%) |
2.56 | 1.84 | 1.91 | 1.01 | 4.44 | 4.27 |
1.05 |
Conclusion
In this study, an attempt was made to optimise the process parameters using ANN-MOGA for rice flour production of Zhero (an ethnic Himalayan snack). According to the research outcomes, a multilayer feed forward back propagation neural network comprising three input, ten hidden, and three output neurons was able to identify the relationship between different responses and the input parameters (soaking temperature, grinding temperature, and grinding time). The optimum soaking and grinding conditions for Zhero preparation were 4.2 h soaking time, 18 ℃ soaking temperature and 1 min of grinding time, which were found using a multi-objective ANN-GA approach. A strong statistical agreement between the predicted and validated values indicated that the proposed model was acceptable. In order to optimize the standardized process for Zhero, the quality parameters of rice flour can be successfully estimated using the developed ANN coupled with GA model. The results of this study will serve as a first step towards standardizing the Zhero production process, which will pave the path for its commercialization and mechanization while maintaining uniform quality.
Acknowledgement
The authors are thankful to Central Agricultural University, Imphal for providing the facilities to conduct the research.
Funding Sources
The author(s) received no financial support for the research, authorship, and/or publication of this article.
Conflicts of Interest
The authors do not have any conflict of interest.
Data Availability Statement
The data that support the findings of this study are available from the corresponding author upon reasonable request.
Ethics Statement
This research did not involve human participants, animal subjects, or any material that requires ethical approval.
Informed Consent Statement
This study did not involve human participants, and therefore, informed consent was not required.
Clinical Trial Registration
This research does not involve any clinical trials.
Permission to Reproduce Material from Other Sources
Not Applicable
Author Contributions
- Apeksha: Conceptualization, Methodology, Visualization, Investigation, Software, Data curation, Formal analysis, Writing – original draft
- Sujata Jena: Conceptualization; funding acquisition; project administration; supervision; writing-review and editing.
- Sitesh Kumar: Software, Data curation, Formal analysis
References
- Singh A., Singh R. K., Sureja A K. Cultural significance and diversities of ethnic foods of Northeast India. Indian J. Tradit. Knowl. 2007;6(1):79 – 94.
- Tamang J. P., Thapa N. Some non-fermented ethnic foods of Sikkim in India. Ethn. Foods. 2014; 1(1): 29-33. https://doi.org/10.1016/j.jef.2014.11.008
CrossRef - Singh Y., Prasad K. Effect of grinding methods for flour characterisation of Pusa 1121 basmati rice brokens. Food Meas. Charact. 2016; 10 :80-87. https://doi.org/10.1007/s11694-015-9279-7
CrossRef - Ogunnigbo O. C., Adetan D., Olusola O F. Effect of soaking time on some engineering properties of cowpea (Vigna unguiculata). Agric. Eng. J.2018; 20(1):143-149. http://www.cigrjournal.org
- Chiang P. Y., Yeh A. I. Effect of soaking on wet-milling of rice. Cereal Sci. 2002; 35(1):85-94. https://doi.org/10.1006/jcrs.2001.0419
CrossRef - Bian Q., Sittipod S., Garg A., et al. Bulk flow properties of hard and soft wheat flours. Cereal Sci. 2015; 63:88-94. https://doi.org/10.1016/j.jcs.2015.03.010
CrossRef - Tran T. B., Shelat K. J., Tang D., Li E., et al. Milling of rice grains. The degradation on three structural levels of starch in rice flour can be independently controlled during grinding. Agric. Food Chem. 2011; 59(8): 3964–3973. https://pubs.acs.org/doi/abs/10.1021/jf105021r
CrossRef - Qian H., Zhang H. Rice flour and related products. In Handbook of Food Powders. 2024; Woodhead Publishing. 437-452. https://doi.org/10.1016/B978-0-323-98820-9.00074-0
CrossRef - Jan S., Rafiq S. I., Saxena D. C., et al. Effect of physical properties on flow ability of commercial rice flour powder for effective bulk handling. J. Comput. Appl. 2015; 975,: 8887.
- Parrenin L., Danjou C., Agard B., et al. Predicting the moisture content of organic wheat in the first stage of tempering. IFAC-Papers OnLine. 2022;55(10): 678-683. https://doi.org/10.1016/j.ifacol.2022.09.484
CrossRef - Sadhu T., Lahiri S. K., Roy J., et al. Optimization of frying process for maintaining nutritional quality to satisfy consumers’ sensory attributes: A novel application of multi‐criteria decision‐making approach. Multi-Criteria Decis. Anal. 2023; 30(1-2): 44-61. https://doi.org/10.1002/mcda.1799
CrossRef - Belna M., Ndiaye A., Taillandier F., et al. Multi objective optimization of skim milk microfiltration based on expert knowledge. Expert Syst Appl.2022; 205. 117624. https://doi.org/10.1016/j.eswa.2022.117624
CrossRef - Rajendra M., Jena P. C., Raheman H. Prediction of optimized pretreatment process parameters for biodiesel production using ANN and GA. 2009; 88(5): 868–875. https://doi.org/10.1016/j.fuel.2008.12.008
CrossRef - Kalathingal M. S. H., Basak S., Mitra J. Artificial neural network modelling and genetic algorithm optimization of process parameters in fluidized bed drying of green tea leaves. Food Process Eng. 2020; 43(1):13128. https://doi.org/10.1111/jfpe.13128
CrossRef - Kumar S., Pipliya S., Srivastav P. P. Effect of cold plasma processing on physicochemical and nutritional quality attributes of kiwifruit juice. J. Food Sci. 2023; 88(4): 1533-1552. https://doi.org/10.1111/1750-3841.16494
CrossRef - Jaddu S., Abdullah S., Dwivedi M., et al. Optimization of functional properties of plasma treated kodo millet (open air multipin) using response surface methodology (RSM) and artificial neural network with genetic algorithm (ANN‐GA). Food Process Eng. 2023; 46(10): e14207. https://doi.org/10.1111/jfpe.14207
CrossRef - Yang T., Zheng X., Vidyarthi S. K., et al. Artificial Neural Network Modeling and Genetic Algorithm Multi objective Optimization of Process of Drying-Assisted Walnut Breaking. 2023; 12(9): 1897. https://doi.org/10.3390/ foods12091897
CrossRef - Düsenberg B., Schmidt J., Sensoy I., et al. Flowability of plant-based food powders: Almond, chestnut, chickpea, coconut, hazelnut and rice. Food Eng.2023; 357: 111606. https://doi.org/10.1016/j.jfoodeng.2023.111606
CrossRef - Subba D., Katawal S. B. Effect of particle size of rice flour on physical and sensory properties of Sel-roti. Food Sci. Technol. 2013; 50: 181-185. https://doi.org/10.1007/s13197-011-0314-3
CrossRef - Sonaye S.Y., Baxi R. N. Particle size measurement and analysis of flour. Int J Eng Res Appl. 2012; 2(3): 1839-1842.
- Khawas P., Dash K. K., Das A. J., et al. Modeling and optimization of the process parameters in vacuum drying of culinary banana (Musa ABB) slices by application of artificial neural network and genetic algorithm. Dry Technol. 2016; 34(4): 491–503. https://doi.org/10.1080/07373937.2015.1060605
CrossRef - Srikanth V., Rajesh G. K., Kothakota A., et al. Modeling and optimization of developed cocoa beans extractor parameters using box behnken design and artificial neural network. Electron. Agric.2020; 177: 105715. https://doi.org/10.1016/j.compag.2020.105715 .
CrossRef - Erenturk S., Erenturk K. Comparison of genetic algorithm and neural network approaches for the drying process of carrot. Food Eng.2007;78(3): 905–912. https://doi.org/10.1016/j.jfoodeng.2005.11.031
CrossRef - Dash K. K., Das S. K. Modeling and optimization of microwave puffing of rice using artificial neural network and genetic algorithm. Food Process Eng. 2021; 44(1): e13577. https://doi.org/10.1111/jfpe.13577
CrossRef - Kajihausa O. E., Fasasi R. A., Atolagbe Y. M. Effect of different soaking time and boiling on the proximate composition and functional properties of sprouted sesame seed flour. Food J. 2014; 32(2): 8-15. https://doi.org/10.1016/S0189-7241(15)30112-0
CrossRef - Yeh A. I., Hsin W. H., Shen J. S., et al. Moisture diffusion and gelatinization in extruded rice noodles. Food extrusion science and technology. 1992; 7 :189-199.
- Kijima N., Katumi N., Takasago T., et al. Characterization of rice flour milled with water and effects of soaking conditions. Food Sci. Technol. Res., 2015,21(6), :771-778.
CrossRef - Jung H., Lee Y. J., Yoon W. B. Effect of moisture content on the grinding process and powder properties in food: A review. Processes.2018; 6(6): 69. https://doi.org/10.3390/pr6060069
CrossRef - Antarlina S. S. The physicochemical properties of white sorghum (Sorghum bicolor L.) flour in various particle sizes by soaking the seeds before and after dehulling. Food Res.2021; 5(3): 129 – 143. https://doi.org/10.26656/fr.2017.5(3).541
CrossRef - Nabavi Z., Basiri A., Milani E. Design of gluten-free instant whole acorn-maize blended flour by extrusion process. Agrophys.2024; 38(4): 393-405. DOI: https://doi.org/10.31545/intagr/192022
CrossRef
Abbreviations List
ar – Angle of repose
Bd – Bulk density
ci – Carr’s index
GT – Grinding time
hr – Hausner’s ratio
Mc – Moisture content
ps – Particle size
St – Soaking time
ST – Soaking temperature
td – Tapped density
Accepted on: 09 Sep 2025
Second Review by: Poojitha Pushparaj
Final Approval by: Dr. Angelo Maria Giuffre


Web of Science Coverage
Emerging Sources Citation Index (ESCI)
2024 Journal Impact Factor: 1.1
Scopus Journal Metrics
CiteScore 2025: 2.6
CiteScore Details
Sustainable Nutrition: Food Systems, Nutrient Retention, and Public Health Impact
![]()
This journal is a member of, and subscribes to the principles of, the Committee on Publication Ethics (COPE)


