Kinetic Study of Water and Total Soluble Solid Changes of Black Cherry Tomato (Solanum Lycopersicum cv. OG) Sauce using Rotary Vacuum Evaporation
 and Nguyen Minh Thuy3
 1Faculty of Agriculture and Natural Resources, An Giang University, Vietnam.
2Vietnam National University Ho Chi Minh City, Vietnam.
3College of Agriculture, Can Tho University, Vietnam.
Corresponding Author Email: htnha@agu.edu.vn
DOI : http://dx.doi.org/10.12944/CRNFSJ.8.3.30
Download this article as:
![]()
Kinetics of water removal and total soluble solid (TSS) content change of black cherry tomato (cv. OG) sauce by rotary vacuum evaporation (RVE) were investigated. The effect of different vacuum conditions (vacuum levels and boiling temperatures of 500 mmHg - 80oC, 550 mmHg - 75oC, 600 mmHg - 70oC and 650 mmHg - 65oC) during evaporation /concentration was examined. Tomatoes puree with an initial TSS of 13.47±0.18oBrix was concentrated to 39.83±0.30oBrix. There was a linear relationship between water removal and time during the concentration of black cherry tomato sauce by RVE. The TSS change of tomato sauce during the concentration was applied to three exponential mathematical models (two-parameter, three-parameter, and four-parameter). In studying the consistency of all models, some statistical indicators, namely the coefficient of determination (R2), the chi-square (χ2) as well as the root mean square error (RMSE) were considered. Among the models, the three-parameter exponential model was proven to best describe the concentration behavior of the tomato sauce using rotary vacuum evaporation with the highest R2, the lowest χ2, and the lowest RMSE. The validation with the experimental data at other vacuum levels had also confirmed the consistency of the selected model. This knowledge is very important for process optimization and product quality improvement.
KEYWORDS:Black Cherry Tomato Sauce; Kinetic; Rotary Vacuum Evaporation; Total Soluble Solid; Vacuum Level
Introduction
The “black” or “purple” cherry tomatoes are subspecies of Solanum lycopersicum1 and exhibit a dirty purplish-brown color2. In addition to the known bioactive compounds such as lycopene, vitamin C, black cherry tomatoes also can produce a phytochemical of anthocyanin predominantly in the skin3. Anthocyanin has been proven to be associated with many health benefits, reduced cancer cell proliferation, protected against cardiovascular disease, prevented obesity and diabetes4.
Because of their health benefits, black cherry tomatoes can be used as fresh vegetables or processed into many popular products1. Especially, tomato sauces have been widely produced at the industrial scale because they may be consumed as an ingredient in prepared food including pizza, pasta, snack, and a variety of vegetable dishes5. Concentration is an important stage in the processing of these products as it determines the quality properties such as appearance, color, aroma, and moutfeel6. During the concentration, water evaporates rapidly when the solution reaches boiling point, while solid components such as sugar, minerals, vitamins may be remained7, therefore, the product becomes more concentrated and has a higher nutritional value. Furthermore, tomato sauces, because of their low water activity (aw), have a long shelf-life and commercial operation time8. The concentration also provides a reduction in product transport, packaging, and storage costs9. However, it is found that, if the concentration is carried out by conventional heating methods, the color could be degraded and most bioactive compounds could be lost results in a significant decline of product quality6. Moreover, the high temperature during conventional evaporation can also create some “cooked-flavors”10. Therefore, the evaporation process could be assisted by the vacuum system to reduce the boiling point of the product9, thereby avoiding the quality change due to thermal effect and long time processing8. Thipayarat (2007) proved that in the vacuum dehydration of banana paste, the enhance in the vacuum level helped to reduce the operating temperature and accelerate the evaporation on the surface lead to decrease the moisture content of the final product11. Similarly, pomegranate juice was concentrated from the initial concentration of 17.5oBrix to the final concentration of 60.5oBrix in 190 and 108 min by using the atmospheric heating method and rotary vacuum evaporation, respectively6.
Mathematical modeling is a helpful method for predicting reaction rate in processing and designing heat treatment processes to maximize food quality12. The kinetic models provide a clear understanding of mass transfer processes during concentration and may be essential for controlling or optimizing the operation of the evaporation system13,14. However, studies on the kinetic of tomato sauce concentration are still limited. Therefore, the present work aimed at analysis and quantification of the effect of vacuum levels on evaporation rate and total soluble solid (TSS) change using rotary vacuum evaporator (RVE) and finding the most appropriate mathematical model in order to predict the concentration behavior of black cherry tomato (cv. OG) sauce.
Materials and Methods
Preparation of black cherry tomato puree
Black cherry tomato (cv. OG) seeds were provided by the F1508 seed store (Ho Chi Minh City, Vietnam) and grown at Nam Long farm, Vinh Long province, Vietnam. Tomatoes were harvested at full ripeness (32 days after fruit formation). All fruits with diseases and defects were removed. Fruits were packed into perforated PVC and then cardboard boxes. They were transported to the Food Technology Laboratory of Can Tho University, Vietnam within 1 hr. Tomatoes were washed and dipped into the water which was aerated with ozone for 15 min by a 2-nozzle ozone generator (Z755, Vietnam, the ozone-generating capacity of 80.4 mg/h, the sample weight of 1500 g, the ratio of fruits and water was 1:2). The infiltration process was then carried out in the vacuum equipment (Rocker 400, Laftech, Australia). The vacuum level and treatment time were chosen as 620 mmHg and 22 min, respectively and the ratio of material and water was 1:1. After vacuum infiltration, the mixture was brought to the atmospheric condition and kept for another 15 min. Fruits were drained and blanched at 89oC for 80s. The blanching was carried out in a water bath (Rex C-90, Memmert, Germany) with the ratio of material and water was 1:2). After that, fruits were cooled quickly by ice water to stop the thermal degradation. The fruits were then ground in a blender (MX-GM1011, Panasonic, Japan) for 5 min and rubbed through a stainless steel sieve (mesh size of 0.355mm). Tomato puree was mixed with flavor enhancers including of 8% of extra refined sugar (Bien Hoa, Vietnam), 7% of vinegar (Ottogi, Vietnam, 6-7% acid), 0.5% of iodine salt (Bac Lieu, Vietnam), 0.4% of monosodium glutamate (Ajinomoto, Vietnam) and additives of 0.2% xanthan gum (Hodgson Mill, U.S.A) and 0.1% pectin (high methoxyl pectin, Sure Jell, U.S.A).
Experimental Design
Before the experiment, the TSS content of tomato puree was determined by a refractometer (0-32%, Atago, Japan) at 20oC and expressed in oBrix. A one-liter round bottom flask containing 500 g of black cherry tomato purees with an initial TSS content of 13.47±0.18oBrix was concentrated until obtaining the desired final content of 39.83±0.30oBrix by a laboratory-scale vacuum rotary evaporator (RV10, IKA, Germany) under adjusted vacuum levels of 500, 550, 600, 650 mmHg corresponding to pressure values of 260, 210, 160, and 110 mmHg. During the concentration process, the flask was immersed in an 80oC water bath heated by an electric heater (HB10, IKA, Germany) and rotated at a fixed speed of 20 rpm.Three replications were made.The water removal and TSS content were evaluated every 5 min during concentration. The water loss was determined by an analytical balance of 4 odd numbers (PR-series, Ohaus, U.S.A.).
Kinetic Study
The relationship between the water removal and concentrated time was fit to a linear model (Equation 1)9 .
![]()
Where, WR is the water removal (as a percentage of original total water content) (%), r is the evaporation rate (%water/min), t is the concentrated time (min).
The change of TSS content over concentrated time was applied to three models namely two-parameter exponential, three-parameter exponential, and four-parameter exponential as shown in Equation 2, 3, and 4 to describe the evaporation behavior of black cherry tomato sauce produced by RVE. These models have been also tested by numerous researchers to find an appropriate representation for the concentration of pomegranate juice6 and pineapple juice7,8 by various heating methods.
Two-parameter exponential model
B = Bo + exp(kt) (2)
Three-parameter exponential model
B = Bo + B1exp(kt) (3)
Four-parameter exponential model
B = Bo + B1exp(ktn) (4)
Where, Bo and B are the TSS content of black cherry tomato puree at the beginning and any time during concentration, respectively; B1 is the model constant; k is the evaporation rate constant (min-1), n is the consistency of the model, and t is the concentrated time (min).
Three statistical indicators were evaluated for selecting the most suitable model to describe the evaporation curve were the coefficient of determination (R2), the chi-square (χ2), and the root mean square error (RMSE). The R2 value indicated the goodness of fit of the models, which means, the higher R2 the better fit of the curve9. On the contrary, two parameters of χ2 and RMSE showed the difference between experimentally observed and predictive data15, therefore, their low values present the better fitting of models. The coefficient of determination (R2), chi-square (χ2), and root mean square error (RMSE) were determined using Equation 5, 6, and 79,15,16.
R2 = 1 – (Residual SS) / (Corrected total SS) (5)

![]()
Where, ΔBexp,i and ΔBpred,i are experimental and predicted TSS content, respectively; N is the number of observations, and np is the number of parameters in the model.
All the kinetic studies were carried out by the Microsoft Excel 2010 and Statgraphics Centurion XV software (U.S.A.).
Results and Discussion
Change of water removal during rotary vacuum evaporation
Vacuum evaporation is an operation by which the final product has better quality than evaporated by the conventional methods under atmospheric pressure due to operating temperature may be lower7. Fig. 1 showed the linear relationship between water removal and concentrated time during the concentration of black cherry tomato sauce by RVE. The rate of evaporation (%water/min) could be determined from the slope of this line. As shown in Table 1, at the same temperature (80oC), the high vacuum level (low absolute pressure) gave a greater evaporation rate than the low vacuum level (high absolute pressure). The evaporation rate at vacuum levels of 500, 550, 600, and 650 mmHg corresponding to boiling temperatures of 80, 75, 70, and 65oC were 0.7130, 0.9395, 1.2757, and 1.5476% water/min, respectively. It might be due to the boiling point temperature of tomato sauce under low absolute pressure was relatively less than that under high absolute pressure17, therefore, the evaporation process requires low-phase change energy9. Besides, under the vacuum condition of the rotary evaporator, water vapor easily moves out of the system, which supports continuous and rapid evaporation from the surface9. Conversely, at a low vacuum level, the poor vapor movement can lead to the formation of residual vapor during concentration, which in turn increases the vapor pressure in the device and reduces the efficiency of evaporation9.
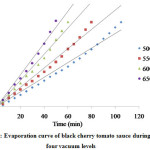 |
Figure 1: Evaporation curve of black cherry tomato sauce during RVE at four vacuum levels. |
Table 1: Evaporation rate of black cherry tomato sauce during RVE at four vacuum levels
| Vacuum level (mmHg) | Linear equation | R2 | Evaporation rate ± SE (%water/min) |
| 500 | Y = 0.7130X | 0.9812 | 0.7130 ± 0.012 |
| 550 | Y = 0.9395X | 0.9838 | 0.9395 ± 0.017 |
| 600 | Y = 1.2757X | 0.9855 | 1.2757 ± 0.025 |
| 650 | Y = 1.5476X | 0.9849 | 1.5476 ± 0.034 |
Note: X, evaporation time (min); Y, water removal (%); SE, standard error
Change of TSS content during rotary vacuum evaporation
The relationship between the TSS and the evaporation time of black cherry tomato sauce under different levels of vacuum (500, 550, 600, and 650 mmHg) was represented in Fig. 2. It could be seen that all experimental data at four pressures exhibited concentration behavior in a type of exponential.
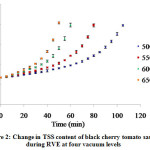 |
Figure 2: Change in TSS content of black cherry tomato sauce during RVE at four vacuum levels. |
The time required to concentrate the black cherry tomato sauce from the initial content of 13.47±0.18oBrix to the final content of 39.83±0.30oBrix by using the rotary vacuum evaporator was achieved in 105, 80, 60 and 50 min at vacuum levels of 500, 550, 600 and 650 mmHg, respectively. It could be seen that the vacuum level had a remarkable effect on the evaporation behavior of tomato sauce during RVE. At higher vacuum levels, due to the rapid evaporation rate, the concentrated time was shortened.
Mathematical modeling of TSS change during rotary vacuum evaporation
The TSS content data of black cherry tomato sauce observed during the concentration process at different vacuum levels were analyzed using non-linear regression. They were applied in three models of exponential. As the results of the kinetic analysis, Table 2 depicted each parameter of models. The compatibility of the curves of three mathematical models at various vacuum levels was evaluated through a higher coefficient of determination (R2), a lower Chi-square (χ2), and a lower Root mean square error (RMSE). For all cases, the R2, χ2, and RMSE values for three models varied from 0.9778 to 0.9973, 0.262 to 3.523, 0.441 to 1.703, respectively. The value of R2 exceeding 0.97 indicating a good correlation between these models and empirical data. However, it was found that the three-parameter exponential model gave the higher R2 and the lower χ2 and RMSE than values of the two-parameter and four-parameter exponential models. The R2, χ2, and RMSE values of the three-parameter exponential model were between 0.9965 and 0.9973, 0.214 and 0.262, 0.441 and 0.480, respectively. Therefore, the three-parameter exponential model was the best presentation of the evaporation behavior of black cherry tomato sauce during RVE. This was clearly illustrated by the predicted curves for three models (Fig. 3, 4, and 5).
Table 2: Coefficients and statistical parameters for three mathematical models at four vacuum levels
| Mathematical model | Vacuum level (mmHg) | Coefficients | Stastistical parameters | |||||
| Bo±SE (oBrix) | B1±SE | n±SE | k±SE (min-1× 10⁻²) | R2 | χ2 | RSME | ||
| Two-parameter exponential | 500 | 13.47±0.18 | 3.060±0.012 | 0.9936 | 0.360 | 0.586 | ||
| 550 | 13.47±0.18 | 4.015±0.018 | 0.9938 | 0.365 | 0.586 | |||
| 600 | 13.47±0.18 | 5.407±0.023 | 0.9960 | 0.273 | 0.502 | |||
| 650 | 13.47±0.18 | 6.555±0.032 | 0.9955 | 0.357 | 0.570 | |||
| Three-parameter exponential | 500 | 13.47±0.18 | 0.794±0.045 | 3.306±0.057 | 0.9965 | 0.214 | 0.441 | |
| 550 | 13.47±0.18 | 0.815±0.056 | 4.297±0.093 | 0.9961 | 0.261 | 0.480 | ||
| 600 | 13.47±0.18 | 0.862±0.060 | 5.679±0.124 | 0.9972 | 0.227 | 0.439 | ||
| 650 | 13.47±0.18 | 0.824±0.065 | 6.976±0.169 | 0.9973 | 0.262 | 0.463 | ||
| Four-parameter exponential | 500 | 13.47±0.18 | 0.038±0.011 | 0.395±0.089 | 102.18±5.44 | 0.9870 | 0.839 | 0.851 |
| 550 | 13.47±0.18 | 0.283±0.021 | 0.504±0.024 | 49.01±5.63 | 0.9778 | 3.523 | 1.703 | |
| 600 | 13.47±0.18 | 0.153±0.054 | 0.516±0.115 | 61.19±3.54 | 0.9930 | 0.863 | 0.815 | |
| 650 | 13.47±0.18 | 0.290±0.097 | 0.621±0.103 | 39.22±1.89 | 0.9947 | 1.047 | 0.873 | |
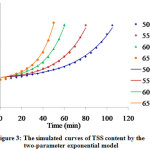 |
Figure 3: The simulated curves of TSS content by the two-parameter exponential model. |
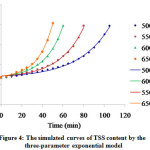 |
Figure 4: The simulated curves of TSS content by the three-parameter exponential model. |
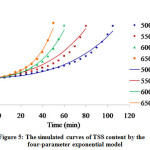 |
Figure 5:The simulated curves of TSS content by the four-parameter exponential model |
Empirical validation of the three-parameter exponential model
The suitability of the three-parameter exponential model to predict the TSS change of black cherry tomato sauce was validated under the experimental condition. The concentration of tomato sauce to 40oBrix final content was implemented under vacuum levels of 520, 570, and 620 mmHg. The change of TSS was fitted to the three-parameter exponential model and the values of the evaporation rate constant (k) and the model constant (B1) were determined (Table 3). The R2 value of the three-parameter model at vacuum levels of 520, 570, and 620 mmHg were 0.9977, 0.9975, and 0.9968, respectively. The three-parameter model giving the R2 value higher than 0.99, which showed the suitability of this in describing the vacuum evaporation behavior of black cherry tomato sauce. A comparison had been made between measured TSS content and predicted values using the three-parameter model during RVE under three vacuum levels (Fig. 6). The data fluctuated along the straight line with a slope of 45o indicated that the predicted model had good compatibility with the change of experimental TSS content.
Table 3: Empirical constants of the three-parameter model for TSS change prediction during RVE at vacuum levels of 520, 570 and 620 mmHg
| Vacuum level (mmHg) | Empirical constants of the three-parameter model | R2 | |
| B1±SE | k±SE (min-1× 10⁻²) | ||
| 520 | 0.925±0.043 | 3.435±0.050 | 0.9977 |
| 570 | 0.990±0.056 | 4.522±0.082 | 0.9974 |
| 620 | 1.136±0.082 | 5.576±0.131 | 0.9969 |
Note: Values were expressed as the mean±standard error
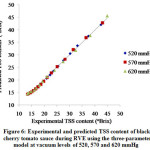 |
Figure 6: Experimental and predicted TSS content of black cherry tomato sauce during RVE using the three-parameter model at vacuum levels of 520, 570 and 620 mmHg. |
Conclusion
The increase in the vacuum level (the decrease in absolute pressure) significantly increased the evaporation rate lead to reduce evaporation time of black cherry tomato sauce by RVE. The three-parameter exponential model gave the best fit to the concentration curve compared to the two-parameter exponential model and four-parameter exponential model and therefore was selected to describe the TSS change of black cherry tomato sauce during concentration (the highest R2 and the lowest χ2 and RMSE). This work also verified the compatibility of the three-parameter model at more other vacuum levels. Kinetic knowledge of the evaporation process of black cherry tomato sauce under the negative pressure gives a basic understanding for controlling and increasing the efficiency of the vacuum concentration system in the industry.
Acknowledgments
We would like to thank MT’ Team of the College of Agriculture, Can Tho University, Vietnam for supporting the implementation of experiments during this study.
Funding Sources
The authors received no financial support for the research, authorship, and/or publication of this article.
Conflict of interest
The authors declare no conflict of interest.
References
- Zhang W., Xie F., Lan X., Gong S.,Wang, Z. Characteristics of pectin from black cherry tomato waste modified by dynamic high-pressure microfluidization. Journal of Food Engineering. 2018; 216: 90-97.
CrossRef - Mes P. J., Boches P., Myers J. R., Durst R. Characterization of tomatoes expressing anthocyanin in the fruit. Journal of the American Society for Horticultural Science. 2008; 133(2): 262-269.
CrossRef - Li H., Deng Z., Liu R., Young J. C., Zhu H., Loewen S., Tsao R. Characterization of phytochemicals and antioxidant activities of a purple tomato (Solanum lycopersicum). Journal of Agricultural and Food Chemistry. 2011; 59(21): 11803-11811.
- Lila M. A. Anthocyanins and human health: an in vitro investigative approach. BioMed Research International. 2004; 2004(5): 306-313.
- Di Lecce G., Martínez-Huélamo M., Tulipani S., Vallverdú-Queralt A., Lamuela-Raventós R. M. Setup of a UHPLC–QqQ-MS method for the analysis of phenolic compounds in cherry tomatoes, tomato sauce, and tomato juice. Journal of Agricultural and Food Chemistry. 2013; 61(35): 8373-8380.
CrossRef - Maskan M. Production of pomegranate (Punica granatum) juice concentrate by various heating methods: colour degradation and kinetics. Journal of Food Engineering. 2006; 72(3): 218-224.
- Assawarachan R., Noomhorm A. Changes in color and rheological behavior of pineapple concentrate through various evaporation methods. International Journal of Agricultural and Biological Engineering. 2010; 3(1): 74-84.
- Assawarachan R., Noomhorm A. Effect of operating condition on the kinetic of color change of concentrated pineapple juice by microwave vacuum evaporation. International Journal Food Agricultural and Development. 2008; 6 (3&4): 47-53.
- Assawarachan R., Noomhorm A. Mathematical models for vacuum‐microwave concentration behavior of pineapple juice. Journal of Food Process Engineering. 2011; 34(5): 1485-1505.
CrossRef - Cassano A., Jiao B., Drioli E. Production of concentrated kiwifruit juice by integrated membrane process. Food Research International. 2004; 37(2): 139-148.
CrossRef - Thipayarat A. Quality and physiochemical properties of banana paste under vacuum dehydration. International Journal of Food Engineering. 2007; 3(4).
- Deylami M. Z., Rahman R. A., Tan C. P., Bakar J., Olusegun L. Effect of blanching on enzyme activity, color changes, anthocyanin stability and extractability of mangosteen pericarp: A kinetic study. Journal of Food Engineering. 2016; 178: 12-19.
CrossRef - Akpinar E. K., Bicer Y. Mathematical modeling and experimental study on thin layer drying of strawberry. International Journal of Food Engineering. 2006; 2(1).
CrossRef - Bingol G., Pan Z., Roberts J. S., Devres Y. O., Balaban M. O. Mathematical modeling of microwave-assisted convective heating and drying of grapes. International Journal of Agricultural and Biological Engineering. 2008; 1(2): 46-54.
- Roberts J. S., Kidd D. R., Padilla-Zakour O. Drying kinetics of grape seeds. Journal of Food Engineering. 2008; 89(4): 460-465.
CrossRef - Dandamrongrak R., Young G., Mason R. Evaluation of various pre-treatments for the dehydration of banana and selection of suitable drying models. Journal of Food Engineering. 2002; 55(2): 139-146.
CrossRef - Saengrayup R., Tansakul A. Mathematical modeling of microwave-vacuum drying of asparagus. In Proceedings of the International Agricultural Engineering Conference, Bangkok, Thailand, 3-6 December 2007. Cutting edge technologies and innovations on sustainable resources for world food sufficiency. 2007. Asian Association for Agricultural Engineering.
Accepted on: 13 Nov 2020
Second Review by: Asaad Alhilphy Iraq
Final Approval by: Daniel Cozzolino


Web of Science Coverage
Emerging Sources Citation Index (ESCI)
2024 Journal Impact Factor: 1.1
Scopus Journal Metrics
CiteScore 2025: 2.6
CiteScore Details
Sustainable Nutrition: Food Systems, Nutrient Retention, and Public Health Impact
![]()
This journal is a member of, and subscribes to the principles of, the Committee on Publication Ethics (COPE)


