
Introduction
Measuring hydration status is challenging due to complex dynamics associated with fluid regulation. Water balance is a continuous process of water losses from kidneys, lungs and skin and occasional uptake through oral intakes. Many assessment methods exist, and these were established for different purposes such as clinical, academic or industrial settings. There have been numerous attempts to establish the most reliable assessment method that could be used for different population groups,1-7 but so far the superiority of any one of these has not been established.8
Assessment techniques aim to measure one or more fluid compartments either directly or indirectly. Some of the methods attempt to compare the sizes of the individual compartments, other rely on biomarkers estimating the concentration of the solutes found in bodily fluids, or attempt to assess the hydration status using the physiological signs and symptoms.
Isotope tracers
This assessment method is often cited in the literature as the gold-standard for measuring hydration status,6,9 although some authors raise important concerns regarding this method. 1-3,5,7 This method uses stable isotopes and relies on the theory that fluid is constantly exchanged between compartments and is distributed throughout the body in equal amounts if sufficient time is given. The sample with known concentration of isotopes is administered either orally or intravenously and allowed to equilibrate for about 3-4 hours. After this time the fluid volume can be calculated using the following formula10:
PV1 x PC1 = PV2 x Pc2
Where PV means plasma volume and PC means plasma concentration. This method can directly measure the Total Body Water (TBW), Extracellular (ECV) and Intracellular (ICV) fluid compartments using a range of different tracers. The physical properties of appropriate tracers are considered when calculating different compartments.
When calculating total body water, the isotopes used must have an ability to enter all compartments freely. The most common agents used are the stable isotopes of hydrogen and oxygen: deuterium (2H), deuterium oxide (2H2O) and oxygen-18 (18O). These isotopes can substitute the hydrogen and oxygen in normal biochemical and metabolic reactions and diffuse quickly through the body in the matter similar to that observed in water. They are rare in nature and practically absent in living matter, thus allowing for accurate estimation of the TBW. Tritium (3H) or tritiated water (3H2O) have been used in the past but are less common since they are highly radioactive.7,8,10
Bromides are also now widely used as isotope tracers. Bromine is slightly soluble in water, but readily soluble in organic solvents and easily absorbed from GI tract. Bromides have an ability to diffuse easily through capillaries but they do not pass through the cell membranes, making them ideal candidate for estimation of extracellular fluid volume. They also have a long half-life of 12 days and virtually nothing is lost for the first few hours after the administration. These unique properties make the bromides superior to thiocyanate and 22Na, 24Na, 36Cl isotopes that were used for estimating ECV in the past.7,8,10
Apart from red and white blood cells and some plasma proteins, intravascular and interstitial fluid compartments have similar composition. The substance measuring the plasma volume needs to have an ability to diffuse easily through the blood but must not escape to the interstitial fluid. Small molecules do not have an ability to do this as they would be pushed out from capillaries by the hydrostatic force. For this reason, the substances that combine with either red blood cells or plasma proteins can be used; and they typically include the radioactive isotopes of iron, phosphate, chromium or iodine.
7,8,10
The interstitial and ICV fluids can be measured indirectly when the volumes of the TBW, ECV and IVF are obtained.
The greatest advantage of this method is its direct measurement of most of the fluid compartments. It is accurate in determination of the hydration status in a controlled environment of the research lab where many internal and external factors are taken into account. In clinical setting, where these factors are not controlled and the results are required quickly; isotope tracers have little application.7 The costly administration as well as complicated and lengthy analyses of individual fluid compartments require a great level of expertise and would be a burden to clinical and laboratory staff. Radioactive tracers are also hazardous substances, which do not pose the problem when administered once in small doses, but do not allow for repetitive assessments often required in the clinical setting. Despite its accuracy and apparent ‘gold standard’ status, there is no reference to this method of assessment in relation to dehydration. Although the fluid compartments can be measured and compared to the rest of the body, academic literature does not describe any variations from a ‘normal’ hydrated state and does not provide the threshold values to determine hypo or hyperhydration states.
Neutron activation analysis (NAA)
This technique is widely used in academic research in fields such as forensic science, archaeology and geology. The subject is placed in the nuclear reactor and exposed to low dose of irradiation. The process results in production of unstable radionuclides that emit characteristic rays during the decay.8 The decay pathways have been identified for most elements and can be used as a reference to determine the amount of each element present. Certain elements are well known to be mostly confined to major body compartments, such as 98% of potassium in ICV or 90% of chloride in ECV, therefore directly proportional to the intra and extracellular fluid volumes. The efficacy of this technique in assessment of hydration status was first used by Yasumura, et al11 who demonstrated its validity by showing a strong correlation against the isotope dilutions; and its superiority because it is less time consuming and not invasive. It does however require specialist equipment and technical expertise only available in few research facilities and does not allow for repetitive measurements.8 As with isotope dilution method, literature does not provide the threshold values to describe variations from euhydration.
Bioelectrical Impedance Analysis (BIA)
BIA estimates the amount of body water by assessing a conduction of a mild electrical current sent through the body. The technique has been widely used in the nutrition field to estimate body composition.12 It utilizes a mild electrical current that travels between electrodes placed on hands and feet while the resistance of its flow is measured. The higher resistance is expected in the less conductive tissues such as fat. The obtained resistance is used to calculate the water volume. Since low frequency current cannot penetrate the cell membranes, a 5Hz frequency provides a good estimation of ECV, while a higher 200Hz reading provides the estimation of TBW.12,13 The technique is cheap, non-invasive and widely available across different settings. Its greatest limitation is the fact that the values have been generated from statistical models and that the method is largely dependent on many variables.7,13,14
This method has been validated against the isotope tracers in some populations such healthy men15-17 and women15,16,18 and the elderly19 and was found to be well correlated (r2 ranging from 0.87 to 0.98).7,20 Its reliability still remains controversial since it is based on a false assumption that the body is a conductor of a homogenous composition; it has not yet been standardised; is not reliable to detect the changes smaller than 1000ml; and it has been shown to be affected by as much as 10% by some physiological factors such as dehydration or sweating.8,13 As with two previous methods the threshold values to describe abnormal states are not discussed in the literature. The technique may be reliable in monitoring the changes in hydration status if used repeatedly on the same individuals in short time intervals.8
Changes in body weight
Daily fluctuations in the body weight are related to the changes in hydration status because the body has limited ability to utilise the adipose tissue for energy.21 It can be assumed that a day to day change in weight is directly proportional to the amount of water gained or lost. Since one litre equals one kilogram of water, the proportion of TBW changes can be easily calculated and may provide a quick assessment of hydration status.22-24 This technique requires the baseline body weight and precludes an immediate assessment in acute setting. The method is only reliable for short periods of time during which the potential amount of adipose tissue loss would be insignificant.8 Severe dehydration should be considered if the body weight rapidly decreases by 3%.25 Since the body weight is also immediately influenced by the weight of foods consumed, this assessment method needs to ensure that the measurements are taken at the same times during the day, preferably after the first urine voiding and before breakfast and wearing as little clothing as possible. This method also relies on adequately calibrated equipment, especially if more than one scale is in use.
Heamatological Indices
Many heamatological parameters have been used to describe the hydration status. Since they are relatively easy to obtain and require equipment and expertise widely available in hospitals, they are often used in clinical setting. They may be performed in most of the research laboratories, which are usually equipped with similar facilities. These indices rely on trained professionals to perform a venupuncture and draw a blood sample; a technique that is seldom used in community and care home settings.
In theory, reduced fluid volume should be followed by the decrease in the blood volume and subsequent haemoconcentration. In reality, there are many other factors that prevent this from occurring, and these need to be taken into account. Since the body largely relies on adequate blood flow for exchange of nutrients and waste products; the volume of vascular tree is usually tightly regulated despite the influence of osmotic pressure;26 blood parameters may not be reliable in diagnosis until severe fluid loss occurs.27 Furthermore, if the water losses were accompanied by the losses of the salt, haemoconcentration may not be the reliable indicator and diagnosis relies on close inspection of different parameters.
Sodium is an extracellular ion and primary determinant of ECV osmolality; its homeostasis is closely related to the water balance and the body has an ability to excrete any excess sodium via kidneys. Increased levels are rarely associated with sodium load; but they usually develop as a consequence of chronic water deficit.28 Hypernatremia normally triggers a response of thirst to restore water balance; but this mechanism often fails in the elderly subjects who suffer from diminishing thirst. Many elderly people such as those physically and cognitively impaired may also have difficulties to communicate their needs efficiently. Consequently, fluid intakes may never be replenished despite the sodium levels rising. When hypernatremia is present, it is almost exclusively due to dehydration.28 On the other hand, since water losses are sometimes accompanied by the salt losses; normal or hyponatremic state does not rule out the possibility of hypohydration.26
Plasma osmolality (the concentration of solutes in the blood) is arguably the most valuable hematologic parameter to assess hydration status and is considered by some a gold standard technique to detect dehydration in the clinical setting.8,29 In clinical laboratory setting, plasma osmolality can be either measured by osmometer or calculated from the following formula30:
Osmolality greater than 300 mOsm/kg is considered to be a threshold value for clinical dehydration5,30 while the value of 295 mOsm/kg is often cited as a mild or impending dehydration.26 The value of this technique as a dehydration marker is still debatable. Armstrong8 argues that plasma osmolality changes with many stimuli and its correlation with dehydration or rehydration is not linear. This is supported by the study of Popowski et al31 who demonstrated that the rapid water turnover resulting from heat and exercise dehydration up to 5% and a rehydration that aimed to recover the lost body weight was not followed by equally prompt changes in plasma osmolality. They concluded that the lag behind the rapid water turnover is most likely the result of perturbed fluid compartments and that acute changes in water balance cannot be measured by plasma osmolality. Furthermore, plasma osmolality is a known key regulator of fluid balance as its action indirectly influences kidneys to reabsorb water in attempt to return it to bloodstream and restore the balance.32 Despite its controversy it is still the widely accepted method in clinical setting.26
Changes in water and electrolyte balance are often associated with changes in concentration of other biomarkers and these are sometimes used to measure hydration status. They may be particularly useful when losses of water and sodium are suspected, but are more likely to be associated with hypovolemia rather than intracellular dehydration. Measurement of urea (or Blood Urea Nitrogen or BUN as reported in some countries representing 0.466 molecular weight of urea) or creatinine often used in assessment of renal function may also be utilised to assess plasma concentration. Blood urea of 6.7 mmol/L and creatinine of 150 µmol/L or higher may suggest fluid and electrolyte imbalance.30 Haemoconcentration due to dehydration would result in rising levels of all blood components including sodium and other osmotically active molecules; hypovolemia on the other hand due to both water and salt loss will affect other blood components without a significant change in osmolality and natremia.33,34 Distinguishing between these two conditions in clinical setting is important because the diagnosis influences the type of rehydration therapy. Replenishing fluids without the salt in case of hypovolemia may lead to congestive heart failure and result in death.34 Careful consideration must also be taken when these parameters are being used as these can be affected by renal function, diet, or increased catabolism.30 In a similar manner, urea/creatinine ratio may be used in assessment of dehydration. The rationale behind using the ratio is supported by the evidence that while creatinine loss via urine occurs at the constant rate, the rates of urea excretion may change depending on hydration status. As an osmotically active molecule, urea is absorbed during water reabsorption, resulting in increased levels of urea compared to those of creatinine; the ratio higher than 100 may suggest dehydration,35 although it is also present in Acute Kidney Injury,30 and has been observed in increased protein intake or increased catabolism.36 Due to progressive muscle loss with age, this ratio may also be naturally increased in the elderly population to the levels suggesting impending dehydration.36,37
Packed cell volume (PCV), also known as haematocrit measures the volume of red blood cells in blood. The normal values are 0.54L/L in men and 0.47L/L in women.30 As with urea and creatinine, this measurement is associated with solute concentration. As opposed to other components, red blood cells cannot escape the bloodstream and their increasing concentration should be closely correlated with decrease in intravascular fluid. Haemoconcentration caused by heat has been demonstrated as early as 19th century.38 Studies showing a similar trend following exercise were reported in the early 1970s.39 Since it was previously observed that the red blood volume and haematocrit were also affected by osmolality and not proportional to the amount of intravascular fluid volume lost; the authors adjusted the values based on concentration of haemoglobin and have successfully calculated the loss of plasma volume, a technique still widely used today.7 These calculations have little use outside laboratory field as they rely on presence of the baseline values which are not always available in clinical setting. Increased haemoglobin and haematocrit can be an indication of dehydration or hypovolemia, but cannot be relied on when used alone in diagnosis. PCV may also be affected by other conditions and is seen increased in polycythemia.30 Increased production of red blood cells due to hypoxia is often seen in people suffering from Chronic Obstructive Pulmonary Disease and some athletes, and this measurement needs to be evaluated together with erythropoietin levels to take these factors into account.40 Furthermore, haemoglobin and PCV values do not rule out dehydration as many elderly patients also suffer from anaemia. This was demonstrated in the study by Akimoto et al41 who reported that 16 out of 28 patients treated for dehydration were ultimately diagnosed with anaemia as haemoglobin and haematocrit declined to lower than the normal ranges after restoring hydration status.
Human serum albumin is a protein circulating in the blood and is responsible for colloid osmotic pressure that facilitates the return of water from interstitial fluid compartment to the blood stream.42 The normal laboratory values do not exceed 50g/L and except for dehydration, there are no conditions that could explain its elevation.30 Despite its high sensitivity, the measurement is not routinely used to assess the hydration status. The possible explanation is its specificity, which could be highly affected by other states; low albumin levels are a frequent finding in clinical setting and are associated with liver disease, nutritional status and malignancies43; hence many dehydrated subjects are likely to present with normal values. This limitation may be a reason why measurement of albumin to detect dehydration has little application, but considering the fact that this marker is routinely taken in clinical setting, hyperalbuminaemia should alert the clinician to a high possibility of dehydration.
One of the greatest limitations of blood biochemistry parameters is their little usability to detect a mild or impending dehydration. Especially in chronic dehydration, the laboratory values may climb slowly as hydration deteriorates, therefore it might be useful to monitor biochemistry frequently and compare with previous values.27 This approach could be particularly useful in care home setting, where long time monitoring is necessary. Since care homes usually do not have staff and facilities to perform venepuncture and laboratory analyses, the data could be requested from GPs when routine tests are performed.27
Urinary Indices
Due to tightly controlled mechanisms to maintain fluid balance and the relatively small insensible water losses; the amount of urine excretion is roughly proportional to amount of fluid consumed.8 In healthy subjects, diluted and concentrated urine is expected with increased and decreased water intakes respectively. This assumption is taken into account when assessing hydration status using urine parameters. This may not always be true as it is well known that upon ingestion of large bulk of fluid, the body will attempt to excrete the water overload to reduce the chance of overhydration despite of the hydration status.8
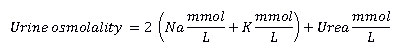
Urine osmolality (concentration of solutes in the urine); can be measured by osmometer or calculated from the following formula30:
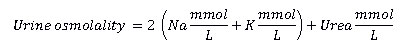
Although urine concentration may vary, osmolality above 1000mOsm/L is considered elevated and may be a sign of dehydration.30 Urine osmolality is the best tool for measuring the concentration of the solutes and is the best indicator of kidney concentrating ability7; but it is less reliable in measuring hydration status as the concentration of solutes is determined by many variables independent of water balance. In a study by Manz and Wenz5 it was evident that variation in urine osmolality depends on diet and differs between cultures. Osmolality also depends on physiological states of protein metabolism and may be affected by concentrating ability of the kidneys. This method has also been shown to be less effective when used immediately after exercise.44 Although the method may not be reliable to assess hydration status when singular measurement is obtained, it may be useful in monitoring hydration status over a period of time. This monitoring method has been used in training athletes1 and in women with recurrent urinary tract infections.45
Urine specific gravity (SG) relates to concentration of solutes and is presented as a ratio of the weight of the urine to the weight of equal amount of water. SG of distilled water equals 1 and the urine values above 1.025 indicate concentrated urine that may be a result of dehydration.30 SG over 1.020 indicate a mild or impending dehydration.3,46 This method requires a use of refractometer, which has been shown to be as effective as osmometer.47 Dipsticks that could easily be used in clinical or home setting are also available and may provide a quick reference for untrained individuals to monitor and maintain appropriate fluid balance.48 Since specific gravity is associated with osmolality, similar factors influence its accuracy. Besides some normal physiologic states described above, urine specific gravity may be increased due to heart failure, Diabetes Mellitus and liver disease. Some less precise methods may also underestimate the reading by 0.001 per every three degrees above 16°C.30
A series of experiments performed by Armstrong et al47,49,50 have demonstrated the potential of urine colour in monitoring and managing hydration status. Urine monitoring can be achieved by using a urine colour chart against a numbered scale, ranging from 1 (pale yellow) to 8 (greenish brown). In the first experiment49 performed in tennis players, the authors demonstrated that the individuals who maintained a pale yellow colour of urine were always within 1% of their baseline euhydrated status, although the chart was less accurate than measurement of urine osmolality or specific gravity. The authors concluded that despite this technique not being sufficiently precise to assess hydration status in clinical setting, it may be effective enough in other settings where high precision is not required or not possible. Similar observations were confirmed by follow up studies.47,50 This assessment method was also validated against urine specific gravity in nursing home residents.37 The authors concluded that this assessment method may be efficient and easy to use, especially since the toileting is a major component of care delivered in this setting. They also acknowledged that there may be many confounding factors that limit the usefulness of this method, as renal insufficiency and incontinence are frequent conditions in care homes. Certain medications such as B vitamins and foods could also influence the urine colour. The authors recommended obtaining a few baseline readings of urine for each individual and when possible taking the urine specimens from the first or second voiding of the day. They also reported difficulty in obtaining the specimens from incontinent residents; the limitation that was described in the study by Rowat et al51 who reported that despite great efforts to obtain urine from incontinent stroke patients (e.g. squeezing out pads and bedding), many samples were lost.
Clinical signs and symptoms
Physiological and physical signs and symptoms usually have poor sensitivity and specificity26,52 and may differ in different age groups.53-55 Despite their limitations, Thomas et al34 demonstrated that many physicians tend to rely on the signs and symptoms and often diagnose dehydration without a consideration for biochemical findings. These indices may not distinguish between different types of dehydration and may prompt inappropriate treatment. The authors reported that about a third of the hospital diagnoses for dehydration were not supported by haematological tests and some conditions should have been diagnosed as hypovolemia. This could be a serious mistake as rehydration therapy without an appropriate electrolyte replacement may lead to overhydration, congestive heart failure and death in the elderly.56 It has also been reported that dehydration is given as a clinical diagnosis for patients admitted for social reasons.57
While clinical signs and symptoms may not be a reliable method to assess hydration status, they may be a useful tool to suspect water and electrolyte disturbances and prompt clinical investigations for confirmation. Clinical signs may also be useful in recognizing mild or impending dehydration35; these could be used for monitoring in conjunction with a series of biochemical data to assess deterioration of hydration status.27 The greatest limitation associated with assessment of signs and symptoms is the fact that most signs are subjective and there are usually no ‘normal’ ranges associated with them. They may also be associated with other diseases or normal physiological states.
The evident sign of dehydration in healthy subjects may be the thirst; but this is known to be diminished in elderly population. Some people such as young children or physically and cognitively impaired elderly may also not be able to express the needs for drinking despite the strong thirst sensation.
Dehydration is also associated with decreased secretion of bodily fluids and it is expected that small production of saliva may be an indication of deteriorating hydration status. In the studies assessing a variety of signs and symptoms it was found that dry mucosa (xerostomia) might be useful in measuring hydration status, these included dry tongue,35,58 tongue furrows35,59 and dry oral mucosa.35,59,60 Small saliva pool was also reported in dehydrated elderly patients.59 Prompted by these findings Whyte,61 which has been tested in acute setting. The chart identifies four stages of dehydration (severe, moderate, mild and no dehydration) based on degree of dryness of oral cavity. The chart has been found to be 85% accurate for identifying patients with moderate or severe dehydration, but the author mentioned that some of the charts have not been completed accurately. Certain conditions such as Alzheimer’s disease are associated with dry oral mucosa30; some medications such as chemotherapy or antidepressants are known to have a similar effect59; xerostomia could also be a result of breathing through the mouth.58
Reduction of axillary sweat has also been mentioned in the literature. This could be assessed by placing a piece of tissue or blotting paper under the arm of the subject and absence of perspiration could be an indicator of dehydration. Studies performed by Gross et al59 and Eaton et al62 found that this was not a reliable indicator. The measurement of axillary moisture using skin moisture impedance meter in the elderly Japanese population found that the dehydration could be ruled out if axillary moisture exceeded 50% (sensitivity 80%, specificity 0%) but was likely to be present when the moisture was less than 30% (sensitivity 12%, specificity 91%).63 The limitations of this study were small sample size; and the question whether it can be generalised to the settings outside the acute care. There also remains the question of cost and availability of the meters as these are not widely available in clinical setting.
Skin turgor (elasticity) has been mentioned by few studies, but most report its limitations when assessing hydration status in the elderly. The turgor is usually assessed by pulling the skin and observing how long it takes to return to the baseline state; with values longer than 2 seconds associated with dehydration.30 Chassagne et al60 have found that turgor of the thigh, forearm, clavicle and sternum may indicate dehydration in the elderly, these values have not been supported by other studies. Gross et al59 found that forearm, but not the sternum may indicate dehydration, while Vivanti et al35 found no relationship with turgor of the sternum.
Changes of consciousness have been reported by some studies and dehydration is frequently mentioned as a risk factor for delirium.22,37,64-66 Any change of consciousness was assessed by Chassagne et al60, who found that these signs were 49% sensitive and 99% specific. Gross et al59 found that some parameters were associated with dehydration (e.g. lethargy and confusion), while other (such as irritability and aggression were not). Changes in consciousness may be difficult to diagnose in the elderly since many may suffer from dementia and are also susceptible to delirium due to other reasons.66
Some other signs often reported in literature include sunken eyes37,59,67, tachycardia35,59,60, hypotension or postural hypotension35,58,60, speech difficulty59, muscle weakness63 and increased capillary refill.59
Fluid intake and fluid balance charts
Certain patients in hospitals require close observation and monitoring and fluid balance charts may provide additional support in making clinical decisions. The charts aim to capture the data on both, fluid intakes and outputs and identify individuals who are in positive or negative balance. While this is important in critically ill patients, studies have shown that these charts are often not filled out appropriately.37,69-71 Watkins et al72 also reported that some dehydrated stroke patients did not have fluid charts available as they were not considered to be needed. Similar findings were observed in NCEPOD AKI report where it was found that fluid balance charts were not seen as integral part of the care plans.73
The difficulties with accuracy of fluid balance charts arise when capturing the data on urine output for patients who are not catheterised; in particular many urine specimens are not measurable in incontinent subjects and those fully mobile may forget to notify the staff about passing urine independently. A small study by Reid et al70 assessed 46 fluid balance charts in acute hospital and found that neither was filled accurately. Some of them had data missing while others had some inappropriate comments (e.g. forgot to measure). The authors reported lack of time, training, communication and accountability as the barriers to this occurring; they also mentioned that some wards did not have necessary equipment to measure the fluids precisely. Balance charts are also limited to urine and gastrointestinal output and do not aim to measure other insensible losses of water from lungs and sweat, which may underestimate fluid excretion. The inaccuracy of fluid balance chart was demonstrated by Perren et al74 who showed that the charts did not correspond with changes in body weight in ICU patients, despite the great efforts to measure all fluids precisely. This may be a particular problem for patients experiencing pyrexia since large amounts of water could be lost through perspiration. Experts recommend increasing fluid intakes by 500ml with every degree of fever above 38°C.53 Low urine output may be associated with dehydration or hypovolemia and this should be suspected in patients producing less than 0.5ml/kg/day; although other conditions such as renal failure or shock may induce oliguria as well.30
Fluid intakes alone have also been reported to be inaccurately measured in both, acute and care home setting.37,69 Fluid intake measurements are usually imprecise because it takes a great amount of time and commitment of all staff members involved in fluid provision; these include the subjects themselves, nurses and nursing assistants and often the housekeeping staff and family. Also, in the study performed by Armstrong-Esther et al75 it was evident that nurses did not know the volumes of the standard cup or glass. Similar findings were confirmed by Simmons et al76 who reported that the food and fluid intakes in nursing home residents were significantly over reported; Iggulden77 also reported that staff tended to guess the amounts consumed and often assume that empty contents meant consumption of the entire drink. This is in line with another study performed by Jimoh et al78 who found no correlation between observed and documented fluid intakes in residential care homes and demonstrated a potential of some residents to complete their own drink diaries. Armstrong-Esther et al75 also reported that the staff did not think the fluid balance charts were useful in assessing hydration status as they thought they were inaccurate. It is unlikely that the staff would bother to take time to fill the charts appropriately if they believed they were not a reliable tool. While fluid balance charts have a potential to monitor hydration status; they need a careful consideration of the above limitations. These charts also need to be reviewed regularly if they are to be reliable in identifying people at risk of dehydration; and this task has been often found neglected due to time constraints.69,72
Conclusion
As of now, there are no reliable tools to determine hydration status. From physiological point of view, direct measurement of fluid compartments may be the only reliable method, but it is time consuming, costly and unsafe.8 Clinically, dehydration is often diagnosed based on haematological and urinary markers supported by physical signs and symptoms.34 The question remains if these are appropriate tools as well. A recent diagnostic review comparing non-invasive methods of fluid assessment status in older people concluded that neither was reliable when compared to serum osmolality.79 Armstrong8 argues that blood indices do not reflect changes in fluid status either and urine markers may be more suitable. It may be so that different markers may be more appropriate for different cohorts of subjects as they reflect different types of dehydration. For example, urine may be more sensitive to acute changes in fluid status and may be more appropriate for athletes who frequently experience acute mild dehydration following the exercise or heat stress; while haematological indices may be more suitable to chronic fluid deficit as observed in the elderly subjects. More studies need to be performed to determine this.
Dehydration may appear in a course of days or even hours and a person may quickly develop subsequent life-threatening conditions. Also, dehydration is often overlooked in a picture of other issues, often seen by healthcare workers as more important than basic need of hydration care. In light of the evidence that hydration status is not easy to assess, hydration care needs to be taken more seriously and appropriate action needs to be taken to prevent dehydration. Particular attention needs to be given to those at increased risk and the vulnerable elderly are such population.
Conflict of interest: no conflict of interest declared
References
- Shirreffs SM, Maughan RJ. Urine osmolality and conductivity as indices of hydration status in athletes in the heat. Med Sci Sports Exerc 1998;30(11):1598.
CrossRef - Oppliger RA, Bartok C. Hydration testing of athletes. Sports Med 2002;32(15):959
CrossRef - Kavouras SA. Assessing hydration status. Curr Opin Clin Nutr Metab Care 2002;5(5):519.
CrossRef - Shirreffs SM. Markers of hydration status. Eur J Clin Nutr 2003;57(S2):S6-S9.
- Manz F, Wentz A. 24-h hydration status: parameters, epidemiology and recommendations. Eur J Clin Nutr 2003 Dec;57(S2):S10-S18.
- Cheuvront S, Sawka M. Hydration assessment of athletes. SSE 97 2005;18(2):1-12.
- Armstrong LE. Hydration Assessment Techniques. Nutr Rev 2005;63(S1):40-54.
CrossRef - Armstrong LE. Assessing hydration status: The elusive gold standard. J Am Coll Nutr 2007 Oct;26(5 Suppl):575S-584S.
CrossRef - Ritz P, Source Study, for the Source Study. Bioelectrical impedance analysis estimation of water compartments in elderly diseased patients: the source study. J. Gerontol. A Biol. Sci. Med. Sci. 2001;56(6):M344-M348.
CrossRef - Guyton A. Textbook of medical physiology. 5th ed. Philadelphia: Saunders; 1976.
- Yasumura S, Cohn SH, Ellis KJ. Measurement of extracellular space by total body neutron activation. Am J Physiol Regul Integr Comp Physiol. 1983;13(1):R36-R40.
- Shanholtzer B, Patterson S. Use of bioelectrical impedance in hydration status assessment: reliability of a new tool in psychophysiology research. Int J Psychophysiol 2003 Sep;49(3):217-226.
CrossRef - NIH Technology Assessment Conference Statement. Bioelectrical Impedance Analysis in Body Composition Measurement. Nutr. 1994;12(11):749-759.
- Walter-Kroker A, Kroker A, Mattiucci-Guehlke M, Glaab T. A practical guide to bioelectrical impedance analysis using the example of chronic obstructive pulmonary disease. Nutr. J. 2010;10(1):35-35.
CrossRef - Van Loan MD, Mayclin PL. Use of multi-frequency bioelectrical impedance analysis for the estimation of extracellular fluid. Eur J Clin Nutr 1992;46(2):117.
- Gudivaka R, Schoeller D, Kushner RF. Effect of skin temperature on multifrequency bioelectrical impedance analysis. J. Appl. Physiol. 1996;81(2):838.
- Pialoux V, Mischler I, Mounier R, Gachon P, Ritz P, Coudert J, et al. Effect of equilibrated hydration changes on total body water estimates by bioelectrical impedance analysis. Br J Nutr 2004;91(1):153-159.
CrossRef - Deurenberg P, Tagliabue A, Schouten F. Multifrequency impedance for the prediction of extracellular water and total body water. Br J Nutr 1995;73(349):358.
- Visser M, Deurenberg P, van Staveren W. Multifrequency bioelectrical impedance for assessing total body water and extracellular water in elderly subjects. Eur J Clin Nutr 1995;49:256-266.
- O’Brien C, Young AJ, Sawka MN. Bioelectrical impedance to estimate changes in hydration status. Int J Sports Med 2002;23(5):361.
CrossRef - Whitney EN, Rolfes SR. Understanding Nutrition. 9th ed. Belmont, CA: Wadsworth/Thomas Learning; 2002.
- Dimant J. Delivery of Nutrition and Hydration Care in Nursing Homes: Assessment and Interventions to Prevent and Treat Dehydration, Malnutrition, and Weight Loss. J Am Med Dir Assoc 2001 Jul-Aug;2(4):175-182.
CrossRef - Nightingale J, Woodward JM, Small Bowel and Nutrition Committee of the British Society of Gastroenterology. Guidelines for management of patients with a short bowel. Gut 2006 Jan;55(Suppl 4):iv1-iv12.
CrossRef - Lunn J, Foxen R. How much water do we really need? Nutr Bull 2008 Nov;33(4):336-342.
CrossRef - Hodgkinson B, Evans D, Wood J. Maintaining oral hydration in older adults: A systematic review. Int J Nurs Pract 2003 Jun;9(3):S19-S28.
CrossRef - Thomas DR, Cote TR, Lawhorne L, Levenson SA, Rubenstein LZ, Smith DA, et al. Understanding clinical dehydration and its treatment. J Am Med Dir Assoc 2008 Jun;9(5):292-301.
CrossRef - Zembrzuski CD. A three-dimensional approach to hydration of elders: administration, clinical staff, and in-service education. Geriatr Nurs 1997 Jun;18(1):20-26.
CrossRef - Himmelstein DU, Jones AA, Woolhandler S. Hypernatremic dehydration in nursing home patients: An indicator of neglect. J Am Geriatr Soc 1983 Aug;31(8):466-471.
CrossRef - Sollanek KJ, Kenefick RW, Cheuvront SN, Axtell RS. Potential impact of a 500-mL water bolus and body mass on plasma osmolality dilution. Eur J Appl Physiol 2011;111(9):1999.
CrossRef - Longmore JM. Oxford handbook of clinical medicine. Oxford: Oxford University Press; 2007.
- Popowski LA, Oppliger RA, Patrick Lambert G, Johnson RF, Kim Johnson A, Gisolf CV. Blood and urinary measures of hydration status during progressive acute dehydration. Med Sci Sports Exerc 2001;33(5):747.
CrossRef - Armstrong LE, Maughan RJ, Senay LC, Shirreffs SM. Limitations to the use of plasma osmolality as a hydration biomarker. Am J Clin Nutr 2013 Aug;98(2):503-504.
CrossRef - Mange K, Matsuura D, Cizman B, Soto H, Ziyadeh FN, Goldfarb S, et al. Language guiding therapy: the case of dehydration versus volume depletion. Ann Intern Med 1997 Nov;127(9):848.
CrossRef - Thomas D, Tariq S, Makhdomm S, Haddad R, Moinuddin A. Physician Misdiagnosis of Dehydration in Older Adults. J Am Med Dir Assoc 2003 Sep-Oct;4(5):251-254.
CrossRef - Vivanti A, Harvey K, Ash S, Battistutta D. Clinical assessment of dehydration in older people admitted to hospital: what are the strongest indicators? Arch Gerontol Geriatr 2008 Nov;47(3):340.
CrossRef - Feinfeld DA, Bargouthi H, Niaz Q, Carvounis CP. Massive and disproportionate elevation of blood urea nitrogen in acute azotemia. Int Urol Nephrol 2002;34(1):143.
CrossRef - Mentes J, Wakefield B, Culp K. Use of a urine color chart to monitor hydration status in nursing home residents. Biol Res Nurs 2006 Jan;7(3):197-203.
CrossRef - Harrison MH. Effects of thermal stress and exercise on blood volume in humans. Physiol Rev 1985 1985;65(1):149-209.
- Dill DB, Costill DL. Calculation of percentage changes in volumes of blood, plasma, and red cells in dehydration. J Appl Physiol 1974 1974;37(2):247-248.
- Martini F. Fundamentals of anatomy & physiology. 6th ed. Boston: Pearson; 2004.
- Akimoto T, Ito C, Kato M, Ogura M, Muto S, Kusano E. Reduced hydration status characterized by disproportionate elevation of blood urea nitrogen to serum creatinine among the patients with cerebral infarction. Med Hypotheses 2011;77(4):601-604.
CrossRef - Caraceni P, Domenicali M, Tovoli A, Napoli L, Ricci CS, Tufoni M, et al. Clinical indications for the albumin use: Still a controversial issue. Eur J Intern Med. 2013;24(8):721-728.
CrossRef - Barchel D, Almoznino-Sarafian D, Shteinshnaider M, Tzur I, Cohen N, Gorelik O. Clinical characteristics and prognostic significance of serum albumin changes in an internal medicine ward. Eur J Intern Med. 2013 Dec;24(8):772-778.
CrossRef - Kovacs EM, Senden JM, Brouns F. Urine color, osmolality and specific electrical conductance are not accurate measures of hydration status during postexercise rehydration. J Sports Med Phys Fitness 1999;39(1):47.
- Eckford SD, Keane DP, Lamond E, Jackson SR, Abrams P. Hydration monitoring is the prevention of recurrent idiopathic urinary tract infections in pre-menopausal women. Br J Urol 1995 Jul;76(1):90-93.
CrossRef - Mentes JC, Culp K. Reducing hydration-linked events in nursing home residents. Clin Nurs Res 2003 Aug;12(3):210-225.
CrossRef - Armstrong LE, Soto JA, Hacker J,F T., Casa DJ, Kavouras SA, Maresh CM. Urinary indices during dehydration, exercise, and rehydration. Int J Sport Nutr 1998;8(4):345.
CrossRef - Khorami MH, Hashemi R, Bagherian-Sararoudi R, Sichani MM, Tadayon F, Shahdoost AA, et al. The assessment of 24 24-h urine volume by measurement of urine specific gravity with dipstick in adults with nephrolithiasis. Adv Biomed Res 2012;1:86.
CrossRef - Armstrong L, Maresh C, Castellani J, Bergeron M, Kenefick R, LaGasse K, et al. Urinary indices of hydration status. Int J Sport Nutr 1994 Sep;4(3):265-79.
CrossRef - Ormerod JK, Elliott TA, Scheett TP, VanHeest JL, Armstrong LE, Maresh CM. Drinking behavior and perception of thirst in untrained women during 6 weeks of heat acclimation and outdoor training. Int J Sport Nutr Exerc Metab 2003;13(1):15. 51 Rowat, 2011
- McGee S, Abernethy 3,W B., Simel DL. The rational clinical examination. Is this patient hypovolemic? JAMA 1999;281(11):1022.
CrossRef - Ferry M, Dal Canton A, Manz F, Armstrong L, Sawka M, Ritz P, et al. Strategies for ensuring good hydration in the elderly. Nutr Rev 2005 Jun;63(6):S22-29. 54 Smith S. Clinical signs of dehydration in children. Emerg Med J 2007 Aug;24(8):605-605.
- Rikkert MG, Melis RJ, Claassen JA. Heat waves and dehydration in the elderly. BMJ 2009 Jul;339:b2663.
CrossRef - Weinberg A, Minaker K, and the Council on Scientific Affairs, American Medical Association. Dehydration: Evaluation and Management in Older Adults. JAMA 1995 Nov;274(19):1552-1556.
CrossRef - Anonymous. Florida initiative aims to slash unnecessary admissions due to ‘catch-all’ dehydration diagnosis. Clin Resour Manag 2001;2(5):77.
- Vivanti A, Harvey K, Ash S. Developing a quick and practical screen to improve the identification of poor hydration in geriatric and rehabilitative care. Arch Gerontol Geriatr 2010 Mar-Apr;50(2):156-164.
CrossRef - Gross CR, Lindquist RD, Woolley AC, Granieri R, Allard K, Webster B. Clinical indicators of dehydration severity in elderly patients. J Emerg Med 1992 Feb;10(3):267-274.
CrossRef - Chassagne P, Druesne L, Capet C, Ménard J, Bercoff E. Clinical Presentation of Hypernatremia in Elderly Patients: A Case Control Study. J Am Geriatr Soc 2006 Aug;54(8):1225-1230.
CrossRef - Whyte D. Using oral mucosa to assess for dehydration. Nurs Times 2014;110.
- Eaton D, Bannister P, Mulley GP, Connolly MJ. Axillary Sweating in Clinical Assessment of Dehydration in Ill Elderly Patients. BMJ 1994 May 14;308(6939):1271.
CrossRef - Kinoshita K, Hattori K, Ota Y, Kanai T, Shimizu M, Kobayashi H, et al. The measurement of axillary moisture for the assessment of dehydration among older patients: A pilot study. Exp Gerontol 2013 Oct;48(2):255-258.
CrossRef - George J, Rockwood K. Dehydration and Delirium — Not a Simple Relationship. J Gerontol A Biol Sci Med Sci 2004 Aug;59(8):M811-M812.
CrossRef - Voyer P, McCusker J, Cole M, St-Jacques S, Khomenko L. Factors associated with delirium severity among older patients. J Clin Nurs 2007 May;16(5):819-831.
CrossRef - Voyer P, Richard S, Doucet L, Cyr N, Carmichael PH. Examination of the multifactorial model of delirium among demented long-term care residents: P2104. Geriatr Nurs 2010 Mar-Apr;31(2):105-114.
CrossRef - Woodward M. Guidelines to effective hydration in aged care facilities. 2007.
- Hodgkinson B, Evans D, Wood J. Maintaining oral hydration in older people: a systematic review. JBISRIR 2001;4(1).
- Callum K, Gray A, Hoile R, Ingram G, Martin I, Sherry K, et al. Extremes of age. The 1999 Report of the National Confidential Enquiry into Perioperative Deaths. 2013; Available at: http://www.ncepod.org.uk/1999ea.htm. Accessed Apr 07, 2014.
- Reid J, Robb E, Stone D, Bowen P, Baker R, Irving AS, et al. Improving the monitoring and assessment of fluid balance. Nurs Times 2004 May;100(20):36.
- Bennett C. At A Glance’ Fluid Balance Bar Chart. London: NHS Institute for Innovation and Improvement. 2010.
- Watkins C, Lightbody E, Theofanidis D, Sharma AK. Hydration in acute stroke: Where do we go from here? Clin Eff Nurs 1997 Apr;1(2):76-83.
CrossRef - Stewart J. Adding insult to injury : a review of the care of patients who died in hospital with a primary diagnosis of acute kidney injury (acute renal failure). 2009:1–100.
- Perren A, Markmann M, Merlani G, Marone C, Merlani P. Fluid balance in critically ill patients. Should we really rely on it? Minerva Anestesiol 2011 Aug;77(8):802-811.
- Armstrong-Esther CA, Armstrong-Esther DC, Browne KD, Sander L. The institutionalized elderly: dry to the bone. Int J Nurs Stud 1996 Dec;33(6):619-628.
CrossRef - Simmons SF, Alessi C, Schnelle JF. An intervention to increase fluid intake in nursing home residents: prompting and preference compliance. J Am Geriatr Soc 2001 Jul;49(7):926-933.
CrossRef - Iggulden H. Dehydration and electrolyte disturbance. Nurs Stand 1999 Jan;13(19):48.
CrossRef - Jimoh F, Bunn D, Hooper L. Assessment of a self-reported drinks diary for the estimation of drinks intake by care home residents: Fluid intake study in the elderly (FISE). J Nutr Health Aging. 2015;19(5):491-496.
CrossRef - Hooper L, Abdelhamid A, Campbell W, Chassagne P, Fletcher SJ, Fortes MB, et al. Non-invasive clinical and physical signs, symptoms and indications for identification of impending and current water-loss dehydration in older people: A diagnostic accuracy systematic review. Eur Geriatr Med 2014. September 2014;5:S69-S70.

This work is licensed under a Creative Commons Attribution 4.0 International License.


