Introduction
During adolescence, several physiological and social factors influence this period as one of increased physical growth and nutritional requirements. This makes the adolescent girls vulnerable to nutritional problems. Though studies in this area are scarce, there is increased incidence of iron deficiency anemia among all socio-economic groups. Inadequate energy intake led to underweight in a greater percentage of these girls. Obesity prevalence has also increased in this age group. This will result in chronic diseases such as heart disease, diabetes and hypertension in the near future.1
Intake of foods high in energy and fat, lack of physical exercise and sedentary lifestyle are some of the major reasons for increased prevalence of overweight and obesity among teenage girls. Such causes leads to early death in the long run. Any health education program should start with children and adolescents to prevent morbidity and mortality and to minimize the incidence of chronic diseases in future.2
Increased education and delayed age at marriage, has exposed the needs and problems of young girls. The well being of their lives and those of their families are due to their physical and mental health.3
Adolescence is a critical period of growth and development, so good nutrition is essential. During adolescence, the need for most nutrients including energy, protein, vitamins and minerals increases. As appetite is also likely to increase, it is important that food choices are made carefully. It can be tempting at this time to increase the intake of snack foods and fast foods that are high in fat, sugar and salt.4
Proper nutrition promotes the optimal growth and development of children. Healthy eating helps prevent high cholesterol and high blood pressure and helps reduce the risk of developing chronic diseases such as cardiovascular disease, cancer, and diabetes5 Healthy eating helps reduce one’s risk for developing obesity, osteoporosis, iron deficiency, and dental caries (cavities).5,6 Healthy eating is associated with reduced risk for many diseases, including several of the leading causes of death: heart disease, cancer, stroke, and diabetes.5 Healthy eating in childhood and adolescence is important for proper growth and development and can prevent health problems such as obesity, dental caries, iron deficiency, and osteoporosis .5,6
With this background an attempt has been made in this study to understand the frequency of food consumption of the subjects and their relationship to Body mass index (BMI).
Materials and Methods
Two hundred female subjects selected for the study (12-19 years of age) were by random sampling from the two schools in Abha province, which were randomly sampled from 30 schools in the same province. Height, weight, (calculation of BMI) and waist circumference were measured using standard equipment. BMI and waste circumference were calculated using the following formulas:
BMI = Weight in kg/Height² in meters7
Waist circumference = Risk factor for women if greater than 88cm.8
Thinness Grade 1 is otherwise described as underweight with a BMI of less than 18.5kg/m². (WHO defines thinness grades 1, 2, and 3 as BMI below 18.5, 17, and 16.)8
The BMI details of the parents and grandparents of the subjects were obtained from the subjects during the interview process. Details about physical activity (physical activity was assessed based on 30 minutes of walking daily) and meal number and consumption, were collected during the interview. A food frequency questionnaire was framed and validated to collect details on the frequency of food consumption from the subjects. Here fast food was included to mean pizzas, burgers, chips, French fries and cokes, etc. Data was collected after informed consent from the study subjects and the ethical committee approval of King Khalid University. The collected data was loaded on SPSS 17 software and the analysis using descriptive statistics such as Chi square was computed.
Results and Discussion
Dietary habits of the study subjects
Table 1: Total number of meals/day of the study subjects
|
No. of meals |
Number of subjects |
Percent |
|
< 3 |
27 |
13.5 |
|
3 |
133 |
66.5 |
|
>3 |
40 |
20.0 |
|
Total |
200 |
100.0 |
A majority of the subjects had at least 3 meals per day (66.5%), followed by 20% who had greater than 3 meals per day. A smaller percent of the study subjects had less than 3 meals per day (13.5 %).
Table 2: Place of breakfast of the study subjects
|
Place of breakfast |
Number of subjects |
Percent |
|
Home |
114 |
57.0 |
|
School cafetaria |
73 |
36.5 |
|
Restaurant |
13 |
6.5 |
|
Total |
200 |
100.0 |
A majority of the subjects had their breakfast at home (57%), followed by 36.5 % of the study subjects who had their breakfast in the school cafeteria. Only 6.5% of the subjects had their breakfast in a restaurant.
Table 3: Intake of Fast food by the study subjects
|
Intake of fast food |
Number of subjects |
Percent |
|
Yes |
105 |
52.0 |
|
No |
95 |
48.0 |
|
Total |
200 |
100.0 |
Any food easily and quickly prepared and processed, served in snack bars and restaurants as a quick meal or to be taken away is termed as fast food.9 Thus fast food may include pizzas, burgers, chips, French fries, coke, etc. A majority of the subjects (52%) ate fast food, whereas 48% did not. Frequent intake of fast food will lead to an imbalanced diet and will have adverse effects on body weight and healthy well being.
Frequency of food consumption by the study subjects.
Table 4: Frequency of food consumption by the study subjects
|
Food item |
Daily
(%) |
Weekly 3-4 times
(%) |
Once per week (%) |
Monthly
(%) |
Never
(%) |
| Bread |
88.0 |
9.5 |
2.0 |
– |
0.5 |
| Vegetables |
61.0 |
34.5 |
4.0 |
– |
0.5 |
| Fruits |
61.5 |
31.0 |
4.5 |
2.0 |
1.0 |
| Milk |
70.5 |
19.0 |
6.0 |
2.0 |
2.5 |
| Meat, fish and eggs |
40.5 |
24.0 |
10.0 |
16.0 |
9.5 |
| Sweets |
44.5 |
32.0 |
11.0 |
9.5 |
3.0 |
| Juices |
68.5 |
21.0 |
5.5 |
4.5 |
0.5 |
| Fast food |
35.5 |
28.5 |
17.5 |
14.5 |
4.0 |
Pearson’s Chi square (frequency of food consumption vs BMI) – Not significant
From the above table it is evident that a majority of study subjects consumed bread daily (88%), vegetables and fruits daily (61% and 61.5% respectively), fast food daily (35.5 %), meat, fish and eggs daily, (40.5%), sweets daily (44.5%) and juices daily (68.5%). It was interesting to note that around 9.5 % of the subjects never consumed meat, fish and eggs.
Anthropometric profile of the study subjects
Table 5: Anthropometric profile of the study subjects
|
N |
Minimum |
Maximum |
Mean |
Std. Deviation |
|
| Weight (kg) |
200 |
38.00 |
98.00 |
58.4405 |
11.01744 |
| Height (cm) |
200 |
139.00 |
187.00 |
157.5200 |
7.34502 |
| Waist circumference (cm) |
146 |
48.00 |
66.00 |
35.7534 |
6.61267 |
From Table V, it is evident that the mean weight, height and waist circumference of the study subjects were 58.4kg, 157.5cm and 35.8cm respectively. It was interesting to note that the waist circumference of the study subjects ranged between 48cm to 66cm, which is below the cutoff point of 88cm for females.8 From the above we can conclude that none of the subjects had central obesity.
Table 6: Family history of obesity / (thinness grade 1-<18.5 BMI-underweight) of the study subjects
| Anthropometric criteria |
Number of subjects |
Percent |
| Obesity (>30 BMI) |
43 |
21.5 |
| Thinness Grade 1 (< 18.5 BMI-underweight) |
42 |
21.0 |
| No obesity or thinness |
115 |
57.5 |
| Total |
200 |
100.0 |
Family history of obesity vs. BMI group Chi square – p < 0.05
From the above table it is evident that a significant majority of the families of the study subjects (57.5%) were neither obese nor underweight. Only 21.5% and 21% of the families were significantly obese or underweight. Chi square was significant at p<0.05 when family history of obesity, underweight (thinness) vs BMI was studied.
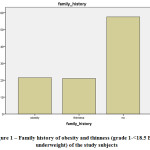 |
Figure 1: Family history of obesity and thinness (grade 1-<18.5 BMI-underweight) of the study subjects |
Table 7: BMI status of the study subjects
|
BMI category |
Frequency |
Percent |
| Underweight |
16 |
8.0 |
| Normal weight |
125 |
62.5 |
| Overweight |
50 |
25.0 |
| Obese` |
9 |
4.5 |
| Total |
200 |
100.0 |
It is evident from Table VII that a majority of the subjects were of normal weight (62.5%), followed by 25% who were overweight, 8% who were underweight and 4.5 % who were obese.
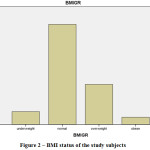 |
Figure 2: BMI status of the study subjects |
Discussion
From the above results it is evident that a majority of the study subjects were of normal weight, followed by 4.5% who were obese. When Chi square was computed between BMI and family history of obesity or underweight (thinness grade 1 is <18.5 BMI) it was significant at p<0.05. Waist circumference was within the cutoff point of less than 88cm for women,8 showing absence of central obesity. Correlations and Chi square drawn between BMI (Body Mass Index) and physical activity were not significant. Though a significant effect was not observed between physical activity and BMI, the importance of physical activity in maintaining normal weight BMI cannot be ruled out. Also no significant relation existed between frequency of food consumption and BMI, although a majority of the subjects consumed bread, vegetables, fruits, milk and products, sweets and fast foods daily.
Conclusion
This study throws light on the fact that family history of obesity or underweight (thinness grade 1) vs.BMI was significant (p<0.05). Also absence of central obesity was observed in the subjects. . The frequency of food consumption did not significantly relate to BMI. There was no significant relationship between BMI and physical activity. We can hereby conclude that hereditary involvement was significant in maintaining BMI of the study subjects than frequency of food consumption. Nutrition education to improve physical activity, especially when there is a heredity history of obesity or underweight in the family is recommended for overweight, obese and underweight subjects.
References
- American Dietetic Association. Nutrition management of adolescent pregnancy: Technical support paper. J Am Diet Assoc 1989; Vol.89, pp. 105-9.
- Abdulrahman 0. Musaiger, Health and Nutritional Profile for Adolescent Girls in the GCC Countries Bahrain Medical Bulletin, Vol.20, No.3, September 1998.
- UNICEF. Girl adolescence, the lost opportunity. MENA Regional Office, Amman, 1985.
- http://daa.asn.au/for-the-public/smart-eating-for-you/nutrition-a-/adolescent-nutrition/ Available online, Accessed on 24/02/2016
- Dietary Guidelines Advisory Committee Report of the Dietary Guidelines Advisory Committee on the Dietary Guidelines for Americans, 2010, to the Secretary of Agriculture and the Secretary of Health and Human Services. Washington, DC: U.S. Department of Agriculture; 2010. Available online, Accessed on 24/02/2016
- CDC. Recommendations to prevent and control iron deficiency in the United States. MMWR 1998; Vol.47, pp.1–29.
- Centers for disease control and prevention – BMI. Available online at www.cdc.gov/healthy weight/assessing/BMI/adult_BMI.
- WHO. Physical status: the use and interpretation of anthropometry Geneva: WHO, 1995 [PubMed]
- http:/www.merriam-webster.com/dictionary/fast–food. Available online, Accessed on 7/12/2016.

This work is licensed under a Creative Commons Attribution 4.0 International License.


