Sensory Profiles of Chocolate Drinks Made from Commercial Fermented Cocoa Powder and Unfermented Cocoa Beans
Laras Cempaka*
, Ardiansyah and Wahyudi David Department of Food Science and Technology, Universitas Bakrie, Jakarta, Indonesia.
Corresponding Author Email: laras.cempaka@bakrie.ac.id
DOI : http://dx.doi.org/10.12944/CRNFSJ.9.3.26
Download this article as:
![]()
Polyphenols are the major bioactive compounds of cocoa beans. The addition of unfermented cocoa beans powder is used to enhance the functional properties of the chocolate drink. This study aimed to analyze the sensory profile of chocolate drinks made from a mixture of commercial cocoa powder and non-fermented cocoa beans by the projective mapping method. Seventy-five naive panelists tested four types of chocolate drink formulations and one benchmark (BM). The beverage formulations based on commercial cocoa powder consist of Formulations 1 (F1), F2, F3, F4 namely with the addition of 0, 10%, 20%, and 30% unfermented cocoa powder, respectively. The result showed that samples F1, F2, F3, and F4 had the dominant attributes of chocolate aroma, bitter taste, and bitter aftertaste. Whereas, BM has a dominant sensory profile of chocolate aroma, sweet taste, and sweet aftertaste. The highest value elevation (95o) is the benchmark (commercial chocolate powder drink). The next height value is in sample F1 which is located at an altitude of 20o-30o. Samples F2, F3, and F4 are the samples that have the lowest elevation (20o). Thus, the addition of cocoa powder from unfermented cocoa beans has not been accepted by consumers due to its bitter taste and bitter aftertaste.
KEYWORDS:Chocolate Drink; Cocoa; Fermentation; Projective Mapping; Sensory Profile
Introduction
Cocoa (Theobroma Cacao L) is a plantation crop that is a leading commodity in Indonesia1. As one of the top five cocoa producing countries in the world, Indonesia has the potential to create and develop high quality chocolate final products2,3. The national cocoa production in 2016 amounted to 639.14 thousand tons. These data show an increase in cocoa production of 7.72% or 45.8 thousand tons compared to cocoa production in 2015 which amounted to 593.331 thousand tons4.
The processing of cocoa beans greatly affects the quality of the final chocolate product. One of the processes that contribute to the aroma of chocolate is the fermentation step. This process can produce a precursor to chocolate taste and aroma5,6. Typical flavor found in chocolate is formed from the processing of cocoa beans such as fermentation, drying, and roasting7. One of the parameters of cocoa that becomes a value for consumers in consuming cocoa powder is flavor attributes8. During the fermentation process, there are microbial metabolic activities take place in the pulp and the seeds. The process might reduce the level of polyphenols of the beans. These compounds diffuse when there is an increase in temperature due to microbial activity. Hence, fermented cocoa beans have lost some of polyphenol which are functional properties in chocolate9.
There have been studies on potential health benefits of polyphenols including of the cocoas, both in vitro or in vivo levels10,11. There are three groups of polyphenols in cocoa beans: proanthocyanins, catechin and anthocyanins6,9. The content of polyphenol compounds in cocoa beans varies depending on the level of fruit maturity, variety, and the environment in which to grow and process12. Unfermented cocoa has a higher total polyphenol content compared to grapes, black tea, and green tea13.
In Indonesia, cocoa is consumed in the form of processed chocolate and instant chocolate powder. In the year 2002-2015, the consumption of instant chocolate increased by 22.16% per year, while the consumption of powdered chocolate increased 57.77% per year. Cocoa consumption is expected to increase in 2016-2020 with an average growth of ± 1.17% per year14. In addition to using fermented cocoa, processed cocoa products on the market generally also contain high calories because it is mixed with other ingredients during the processing such as sugar and milk15,16. The high content of sugar and milk in the product is one of the risk factors of obesity17. If there is an imbalance between energy intake and energy expended, there will be excess energy. Excess energy will be stored in the form of fat in adipose tissue. Not only in conditions of excess fat, but also in the distribution of fat in the body. Fat distribution can increase the risk of developing degenerative and metabolic diseases such as diabetes18.
In contrast to its unpleasant taste, the unfermented cocoa is believed to have more health benefits compared to the fermented one20. The use of unfermented cocoa as a food ingredient in beverage making is still not popular. Most of the available chocolate drink products, both chocolate powder drink and ready to drink chocolate, use fermented cocoa beans. Through the substitution of sources of chocolate, sugar, and other ingredients, chocolate drink products that are healthier and more acceptable to consumers are still not available on the market. Hence, the development of unfermented cocoa beans-based chocolate drinks should be pursued. This study aims to analyze the sensory profile of cocoa-based drinks with a mixture of commercially fermented cocoa powder with unfermented cocoa powder.
Materials and Methods
The ingredients used for the formulation of chocolate drinks are unfermented cocoa beans obtained from the Small Medium Enterprise Sumedang, West Java, fermented cocoa powder “Oh Java”, vegetable creamer “Ellenka”, sweetener stevia “Tropicana Slim” and vanilla flavor “Koepoe Koepoe”. Besides the four formulations (Table 1), there is a benchmark, namely instant cocoa powder with the brand ‘Delfi’. Equipment used for projective mapping are 60×60 cardboard for placing samples according to the level of closeness to each other according to the panelists.
Table 1: Cocoa Beverage Formulations.
| Material Composition | BM | F1 | F2 | F3 | F4 |
| Commercial Fermented Cocoa Powder (g) | Commercial instant chocolate drinks | 4.2 | 3.78 | 3.36 | 2.94 |
| Unfermented Cocoa Powder (g) | – | 0.42 | 0.84 | 1.26 | |
| Stevia (sweetener) (g) | 2.2 | 2.2 | 2.2 | 2.2 | |
| Vegetable Cream (g) | 8.5 | 8.5 | 8.5 | 8.5 | |
| Flavor (g) | 0.1 | 0.1 | 0.1 | 0.1 | |
| Water (ml) | 85 | 85 | 85 | 85 | |
| Total (g) | 100 | 100 | 100 | 100 |
F 1 : 100% (F)
F 2 : 90% : 10% (F : UF)
F 3 : 80% : 20% (F : UF)
F 4 : 70% : 30% (F : UF)
F= Fermented Cocoa Powder; UF= Unfermented Cocoa Powder
Sensory Analysis
Sensory analysis in this study was conducted using the Projective Mapping method. This method is used to study consumer testing with the sensory properties of food products based on their attributes21. Panelists place samples according to the similarity of their attributes22. Seventy-five naive panelists aged 19-22 years (range age= 19-22) contributed to this study. They were selected based on their willingness to participate and time availability. They were mainly undergraduate students in Food Science and Technology at Universitas Bakrie. Panelists were briefed about the study but they were not informed about the products detail. The initial step of testing is that the entire sample is provided in front of the panelists. The sample is given consists of five samples with three different digit codes. Then the 60×60 cm cardboard paper was given to the panelists as a base to position the sample on it. The arrangement is based on grouping the samples according to the similarity level of the sensory attributes (Fig. 1). Similar samples are placed close together and different samples are placed far apart. After that, the panelists were asked to write down the sample code on the cardboard and add information about the aroma, taste, after taste, and overall sample acceptance.
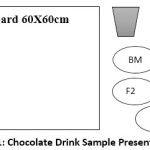 |
Figure 1: Chocolate Drink Sample Presentation. |
Data Analysis
Data from Projective Mapping sensory analysis was processed with R v3.6.0 software. Statistical analyses were conducted to assess the link between consumer preferences and perceptions of the product being tested. Apart from numbers, the sample descriptions from the panelists can also explain why the panelists put the sample positions. Table 2 shows the terms for the taste, aroma, aftertaste attributes of the entire sample by the panelists.
Table 2: Terms used in Descriptive Analysis of Chocolate Drink Sample.
| Attribute | Sensory Type | Definition |
| Sweet | Flavor, aroma, aftertaste | Taste elicited by table sugar |
| Chocolate | Flavor, aroma, aftertaste | Chocolate flavor and aroma |
| Sour/ acid/ tamarind | Flavor, aroma, aftertaste | Sour flavor |
| Salty | Flavor, aroma, aftertaste | Taste elicited by table salt |
| Vanilla | Flavor, aroma, aftertaste | Taste elicited by vanilla extract |
| Milk | Flavor, aroma, aftertaste | Flavor of whipping milk |
| Peanut/ bean | Flavor, aroma, aftertaste | Taste elicited by nuts |
| Caramel | Flavor, aroma, aftertaste | Aroma from heating the sugar to golden brown and producing a distinctive deep flavor |
| Astringent | Flavor, aroma, aftertaste | Taste that puckers the mouth, numbs the tongue, and constricts the throat |
| Bitter | Flavor, aroma, aftertaste | Having a sharp, pungent taste or smell; not sweet |
| Creamy | Flavor, aroma, aftertaste | Soft and melts in the mouth |
| Roasted/ burnt/ wood | Flavor, aroma, aftertaste | Smell of smoke from the wood burning |
| Fresh/floral/ flower | Flavor, aroma, aftertaste | Energizing fresh taste from floral/ flower |
| Roasted/ baked | Flavor, aroma, aftertaste | Smells of baked aroma |
| Soil/ground/ grassy/earth | Flavor, aroma, aftertaste | Smell of earth |
| Fruit | Aroma, aftertaste | Smell of sweet fruits |
| Tobacco | Aroma | The smell of cigarettes |
| Molasses | Aroma | The strong smell of sugar |
| Winey/ alcohol | Aroma | Strong aroma of alcoholic beverage |
| Herbs and spices | Aroma, aftertaste | Taste elicited by herbs and spices |
| Coffee | Aroma | Taste elicited by coffee |
| Wheat | Aroma, aftertaste | The aroma of flour |
| Candy | Aroma | Aroma of confectionary product |
| Savory | Aftertaste | Full of flavor, delicious and tasty |
Results and Discussion
Sensory analysis is an analysis to determine the description of sensory attributes, characteristics, and differences between products that can affect consumer acceptance. This purpose is also used in product development such as product reformulation23. The sample used consisted of four formulations with increased amounts of unfermented cocoa powder. The benchmark used is chocolate powder drink that is already on the market. The four samples were added with stevia sugar, this sweetener is considered to have a higher level of sweetness compared to sugar cane. However, it has lower calories24.
Figure 2. shows the sample chocolate drink used in the study. From the picture, it can be seen that there are differences in color and texture between the samples.
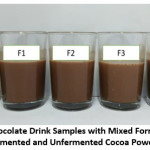 |
Figure 2: Chocolate Drink Samples with Mixed Formulations of Fermented and Unfermented Cocoa Powder. |
Sensory Profile of Fermented and Non-Fermented Cocoa-Based Drinks
Evaluation of this sensory profile produces a dominant sensory description in each sample which can be seen in Table 2. In the benchmark, it has the dominant attributes of sweet taste, chocolate taste, chocolate aroma, and sweet aftertaste. However, the samples F1, F2, F3, and F4 have dominant attributes of a bitter taste, sweet taste, chocolate taste, chocolate aroma, sweet aroma, and bitter aftertaste. The aroma and taste of chocolate are the characteristic sensory attributes of fermented cocoa beans. In this process, there is a breakdown of polyphenol compounds, proteins, and sugars by enzymes to form precursors for the distinctive taste of chocolate25. Furthermore, the sample descriptions are analyzed related to similarities and differences between samples. The similarity of aroma attribute between BM and F3 samples are chocolate, sweet, milk, nuts, coffee, vanilla, bitter, cream, wheat, and candy aroma. As for the difference, the BM sample has the aroma of roasting, coffee, grass, soil, and wood and the F1 sample has a burnt aroma. In samples F2, F3 and F4 have the same aroma, namely having the aroma of chocolate, sweet, milk, peanuts, cream, roasted, bitter, earth, and vanilla. The difference between the three samples is that the F2 sample has a smell of grass, fruit, and is tasteless. Sample F3 has a brownie and salty aroma and sample F4 has an aroma of wheat, leaves, and tamarind.
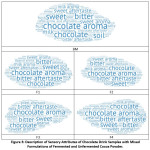 |
Figure 3: Description of Sensory Attributes of Chocolate Drink Samples with Mixed Formulations of Fermented and Unfermented Cocoa Powder. |
These aromas are formed due to the volatile components of the ingredient. Apart from the materials used, that can also be formed because of the processing of the product. For example, the fermentation process which involves microbial activity and Maillard reactions from sugar and protein26. In the taste attribute, the similarities between BM and F1 samples were both sweet, bitter, chocolate, earth, milk, baked, vanillin, fresh, salty, wood, sour, cream, wheat, peanuts, fruit, and astringent. However, different attributes include the BM sample having a taste of smoke, grass, coffee, burnt and tobacco, while the F1 sample has a taste of alcohol. Samples F2, F3, and F4 have the same taste attributes, namely bitter, sweet, chocolate, baked, milk, sour, cream, wood, peanut, salty, smoked, and ground. As for the difference, the F2 sample has a vanilla, spicy, and savory taste. Sample F3 had a fresh taste and F4 had floral, wheat, fruity, and burnt flavors.
The distinctive taste of chocolate is formed from a combination of basic bitter, sour, and sweet tastes which are composed of unique components in chocolate26. The sweet taste generally comes from the sweetener added to cocoa powder, usually, the sweetener used is sugar cane. While in the sample, the sweetener used was stevia. The purpose of using stevia sugar is to reduce calories but still be able to provide an appropriate sweet taste.
The bitter taste which is the characteristic taste of chocolate comes from alkaloid components such as caffeine and theobromine, pyrazine, phenolics as well as some peptides and amino acids8,27. The creamy taste that is formed is thought to come from a combination of a sharp chocolate taste with a soft texture28,40. The vanilla flavor that is present in the product comes from the additional of the flavor essence. The identified milk flavor may come from the vegetable creamer used. The herb is a characteristic taste of the unfermented cocoa beans. It comes from the high polyphenol content in the cocoa beans. Unfermented cocoa have a higher polyphenol content than those of fermented beans29.
The sour taste comes from the high content of lactic and acetic acids. It contributes to the distinctive chocolate flavor. However, if the sour taste is too high, this indicates the low quality of the cocoa beans. The taste of the beans identified comes from fermented cocoa bean components such as 2-Methylpyrazine, 2,5-Dimethylpyrazine, 2,6-Dimethylpyrazine, 2-Ethylpyrazine, and 2,3,5-Trimethylpyrazine. The identified taste of coffee comes from components 2,3,5,6-Tetramethyl-pyrazine and 2,6-Dimethylpyrazine8. The fruit flavors identified were derived from Benzyl alcohol, Ethyl acetate, Ethyl dodecanoate, while floral flavors derived from 1- Phenylethanol and ethyl dodecanoate30,41.
Similarities between the F1 and the benchmark were sweet, bitter, chocolate, sour, astringent, grass, peanut, and milk aftertaste. Meanwhile, the BM samples also have earthy, smoked and salty aftertaste. While the other three groups have the same attributes including the bitter, sweet, sour, astringent, chocolate, peanut, and caramel aftertaste. Whereas the difference is that the F2 sample has a vanilla, for the F3 sample it has a grass and for the F4 sample there is milk, soil, and salty aftertaste.
Individual Factor Map, Confidence Ellipses for the Napping and Sensory Descriptions
Individual factor maps are points that indicate the existence of each sample determined by the 75 panelists (Fig. 2). The points are then made Euclidean distance to be combined into one, which means that the panelists indirectly agree on the existence of the position of each sample31.
In addition to the individual factor map, the results of confidence ellipses for the napping are a matrix containing coordinates of different frequencies and variables determined by panelists indirectly32. Confidence ellipses for napping in Fig. 3 shows the results of the analysis of the sensory profile evaluation of beverage formulations based on a mixture of fermented and unfermented cocoa powder with variations in the percentage of the mixture. The ellipses section shows the alleged virtualization position determined by the panelists by 375 points. Based on the results of the plot, the first dimension up to the second dimension MFA explains 70.02% diversity.
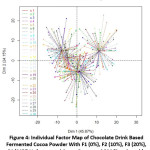 |
Figure 4: Individual Factor Map of Chocolate Drink Based Fermented Cocoa Powder With F1 (0%), F2 (10%), F3 (20%), F4 (30%) Unfermented Cocoa Beans and BM (Benchmark). |
Fig. 4 shows the sample divided into three clusters. The first group is samples BM; the second group consisted of samples F1 and F2; the third group of samples F3 and F4. The samples were divided into four clusters in which the greater the area means the more heterogenous the samples are. BM has a greater area (heterogeneous) compared to other samples. This shows that the panelists gave more diverse values to this sample. BM is located in a different quadrant to the sample, thus Panelists agree that BM has very different attributes from other samples. (Fig. 4). In the second group, the F1 and F2 samples have a smaller area compared to BM. The samples are in the same group because they are considered to have a high degree of similarity in the characteristics of the sensory attributes. Similarly, samples F3 and F4 are located in the same quadrant.
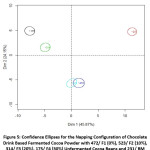 |
Figure 5: Confidence Ellipses for the Napping Configuration of Chocolate Drink Based Fermented Cocoa Powder with 472/ F1 (0%), 523/ F2 (10%), 314/ F3 (20%), 175/ F4 (30%) Unfermented Cocoa Beans and 231/ BM (Benchmark). |
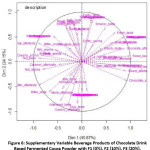 |
Figure 6: Supplementary Variable Beverage Products of Chocolate Drink Based Fermented Cocoa Powder with F1 (0%), F2 (10%), F3 (20%), F4 (30%) Unfermented Cocoa Beans and BM (Benchmark). |
Fig. 5 and 6 show the results of the sensory profile analysis found in quadrants one through four. Samples and sensory attributes located in the same quadrant show the characteristics of the sample. BM has the characteristics of sweetness, smoke, fresh, soil, vanilla, chocolate, and sour. Samples F1 and F2 located in quadrants two and three have sensory characteristics namely milk, astringent, sour, bitter, peanut aroma, and have caramel, bitter, and creamy aftertaste. F3 and F4 which are located in quadrant four have the sensory characteristics of peanut, salty, roasted, creamy, roasted, and beans taste. The sensory profile contained in each sample is influenced by the processing, the composition of the materials used, and the interactions between the components of the product33.
The aroma of chocolate, the bitter taste, and the bitter aftertaste formed are typical flavors of cocoa beans34. The distinctive flavors identified in the four samples were due to the composition of the ingredients derived from a mixture of fermented and unfermented cocoa powder. In fermented cocoa powder, a distinctive chocolate flavor is formed8. Whereas the unfermented cocoa powder has a more bitter taste than the fermented one. That is due to the cocoa powder there are polyphenol compounds that play a role in the formation of bitter and astringent flavors35. The taste is formed through the deposition mechanism of proteins that are rich in proline in saliva and contribute to the bitter taste of chocolate along with alkaloids, some amino acids and peptides, and pyrazines36. The higher the polyphenol content in chocolate the higher the bitter and astringent taste. High polyphenol content is found in unfermented cocoa37.
There are 12 characters commonly used to describe or assess the taste of cocoa. The characters are the aroma of cocoa (chocolate), nutty (nuts), fruity (fruits), tobacco, molasses, bright (fresh), caramel, grassy, bitter, winey (grapes), spicy (herbs), and floral (flowers). Generally, Indonesian cocoa has a weak chocolate flavor, fruit aroma, and sour aroma36.
Furthermore, the sample descriptions are analyzed in terms of similarities and differences between samples. The aroma attribute equation between samples BM and F3 is that there is chocolate, sweet, milk, bean, coffee, vanilla, bitter, cream, wheat, and candy. As for the difference, sample BM has the aroma of roast, coffee, grass, soil, and wood, and sample F1 has the scent of scorch. In the samples F2, F3 and F4 had the same aroma which had the aroma of chocolate, sweet, milk, beans, cream, roast, bitter, ground, and vanilla. The difference between the three samples is that sample F2 has a scent of grass, fruit, and tasteless. Sample F3 has the aroma of brownies and salty and sample F4 has the aroma of wheat, leaves, and acid.
The aromas are formed due to the presence of volatile compound in the ingredient used. Apart from the ingredients used, the aromas can also be formed due to product processing. For example, fermentation processes involving microbial activity and Maillard reactions involving sugars and proteins38.
In the taste attributes, sample BM and F1 panelists describe the similarity between the two, namely sweet, bitter, chocolate, earth, milk, roasted, vanilla, fresh, salty, wood, acid, cream, wheat, peanuts, fruit, and astringent. While the difference is in sample BM there is a sense of smoke, grass, coffee, burnt, and tobacco while in sample F1 there is a sense of alcohol. Samples F2, F3 and F4 had similarities to the taste attributes, they were bitter, sweet, chocolate, baked, milk, sour, astringent, cream, wood, peanuts, salty, smoke, and soil. Whereas the difference is sample F2 has vanilla, spice, and savory flavors. Sample F3 had a fresh taste and F4 had a flower, wheat, fruit, and charred flavor.
The distinctive taste of chocolate that is formed is a combination of basic tastes of bitter, sour, and sweet composed of unique components in chocolate39. The detected sweetness is a taste derived from sweeteners used in making products. In this study, sweeteners used in sample BM were sugar cane type sweeteners, and for other samples using stevia type. Stevia sweetener has a higher level of sweetness compared to sugar cane sweetener but has lower calories4.
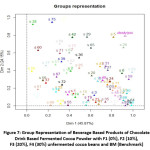 |
Figure 7: Group Representation of Beverage Based Products of Chocolate Drink Based Fermented Cocoa Powder with F1 (0%), F2 (10%), F3 (20%), F4 (30%) unfermented cocoa beans and BM (Benchmark). |
Group Representation
Group representation described the results of the assessment of the 75 panelists on samples of beverage products based on a mixture of fermented cocoa powder and unfermented. The results of the selected Group Representation value are based on the largest dimension diversity which is found in dimensions one and two (70.02%). The color in Group Representation correlates with the color of the sample ellipses in Fig. 7.
In this result, it is known that the panelists assess the sample in a variety of ways that are known based on the position of the representation of the panelists (Fig. 7) which corresponds to the sample representation in the Confidence Ellipses (Fig. 5). Fig. 7 shows that the panelist representation of a widespread sample is not close together or focused on one region. This indicates that the panelist’s assessment of the sample can be trusted. Although the results of the data obtained varied, the panelists still grouped the samples according to their level of similarity.
Points generated by the BM sample are in an adjacent area.. It indicates that Panelists have similarities in analyzing the characteristics of sensory attributes of BM samples. Panelist agreed that sample BM is a differentiator from other samples. This is consistent with the fact that sample BM is the benchmark in this study. As for samples F1, F2, F3, and F4 panelist representations are more widespread than those in sample BM. It can be seen that panelist assessments of the four samples are more diverse but panelists still group them according to their similarities as can be seen in Fig. 5.
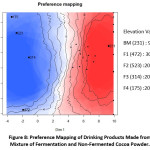 |
Figure 8: Preference Mapping of Drinking Products Made from Mixture of Fermentation and Non-Fermented Cocoa Powder. |
Preferences Mapping
The Preference Mapping Method is a method that connects hedonic data with descriptive data on the product being tested42. In Fig. 6, Preference Mapping divides the area into two parts. In addition, the elevation value of the panelist preference level for the sample was also obtained. The higher the elevation value of the sample, the higher the preference of the panelists for that sample43. The sample that has the highest elevation value is BM which is at 95o elevation. Thus, BM is the sample that is most widely accepted and chosen by the panelists. This is evidenced by its sensory attributes, namely the aroma of chocolate, chocolate taste, sweetness, and sweet aroma that consumers like (Table 3). These results follow the BM sample which is the benchmark in this study. The next highest elevation value is found in the F1 sample which is located at an elevation of 20o-30o. Sample F1 is a sample of chocolate drink product with 10% unfermented cocoa powder. Thus, it can be interpreted that the panelist preference level for this sample is higher than samples F2, F3 and F4. However, BM with F1 samples is located at a different pole. Therefore, when compared with the BM sample, this F1 sample was not acceptable to the panelists. Nevertheless, the sensory attributes of the F1 sample are considered better than the other samples. Samples F2, F3 and F4 are the samples that have the lowest elevation at 20o elevations.
Hence, Fig. 7 shows that panelists prefer samples with 100% fermented cocoa powder (BM). The fermentation process in cocoa beans can result in the formation of precursor compounds that play a role in forming a distinctive chocolate taste30. In terms of preference, chocolate products with good processing of cocoa beans will be preferred compared to those without good processing. Included in this study, fermentation plays an important role in the formation of flavor precursors and color attributes. Due to the fermentation process will increase the color preference of cocoa beans44.
Conclusion
The results of the sensory analysis of drinks made from a mixture of fermented and unfermented cocoa powder showed various descriptions in each sample. On the Individual Factor Map and Ellipses Confidence for the Napping, the sample results are divided into three groups according to the percentage of that beverage. The dominant sensory attributes obtained in samples F1, F2, F3 and F4 are the chocolate aroma, bitter taste, and bitter aftertaste. Whereas sample BM has the dominant attributes of chocolate aroma, sweet taste, and sweet aftertaste. It can be seen that the mixture between fermented and unfermented cocoa powder used was not detected by panelists. The description given by the panelists in each sample was not much different. In the preference mapping results obtained panelist preference level results on the sample. The sample that has the highest elevation value is sample BM (benchmark) is at elevation 95o. The next highest elevation value is in sample F1 which is located at an elevation of 20o-30o. Sample F1 is a sample of chocolate drink products with raw material for commercial fermented cocoa powder 100%. Samples F2, F3 and F4 are the samples that have the lowest elevation at elevation 200. Thus, the addition of cocoa powder from unfermented cocoa beans decreases the level of preference of panelists against chocolate drinks. Sensory attributes show that unfermented cocoa powder addition into the fermented cocoa have not been able to compete with the benchmark so there needs to be an improvement in the sample formulation. The addition of cocoa powder from unfermented cocoa beans has not been accepted by consumers due to its bitter taste and bitter aftertaste.
Acknowledgments
The authors would like to thank Hegar Pramastya for his assistance and guidance in proofreading the manuscript.
Funding Sources
This research has been funded by Ministry Education, Culture, Research and Technology, Indonesia, with contract number 163/E4.1/AK.04.PT/2021; 3487/LL3/KR/2021; 118/SPK/LPP-UB/VII/2021 and Universitas Bakrie with contract number 133/SPK/LPP-UB/VII/2021.
Conflict of Interest
All authors declare no conflict of interest.
References
- Rosmawaty; Baka LR, Taridala AA, Saediman SH. Development Potential Of Cocoa Agroindustry In Southeast Sulawesi, Indonesia. IOSR J Agric Vet Sci Ver I. 2015;8(9):2319-2372. doi:10.9790/2380-08913944
- Witjaksono, Asmin J. Cocoa Farming System in Indonesia and Its Sustainability Under Climate Change. Agric For Fish. 2016;5(5):170. doi:10.11648/j.aff.20160505.15.
CrossRef - Rifin A. Competitiveness of Indonesia’s Cocoa Beans Export in the World Market. Int J Trade, Econ Financ. 2013;4(5):279-281. doi:10.7763/ijtef.2013.v4.301.
CrossRef - Statistik Kakao Indonesia: Indonesian Cocoa Statistics. BPS-Statistics Indonesia; 2017.
- Di Mattia CD, Sacchetti G, Mastrocola D, Serafini M. From cocoa to chocolate: The impact of processing on in vitro antioxidant activity and the effects of chocolate on antioxidant markers in vivo. Front Immunol. 2017;8(SEP):1-7. doi:10.3389/fimmu.2017.01207.
CrossRef - Giacometti J, Jolic SM, Josic D. Cocoa Processing and Impancton Composition. Process Impact Act Components Food. 2015;4:604-612. doi:http://dx.doi.org/10.1016/B978-0-12-404699-3.00073-1 605.
CrossRef - Sudibyo A. Peran Cokelat sebagai Produk Pangan Derivat Kakao yang Menyehatkan. J Riset, Ind. 2012;VI(1):23-40.
- Aprotosoaie AC, Luca SV, Miron A. Flavor Chemistry of Cocoa and Cocoa Products-An Overview. Compr Rev Food Sci Food Saf. 2016;15(1):73-91. doi:10.1111/1541-4337.12180.
CrossRef - Urbańska B, Derewiaka D, Lenart A, Kowalska J. Changes in the composition and content of polyphenols in chocolate resulting from pre-treatment method of cocoa beans and technological process. Eur Food Res Technol. 2019;245(10):2101-2112. doi:10.1007/s00217-019-03333-w.
CrossRef - Lippi D. Chocolate in history: Food, medicine, medi-food. Nutrients. 2013;5(5):1573-1584. doi:10.3390/nu5051573.
CrossRef - Visioli F, Bernaert H, Corti R, et al. Chocolate, lifestyle, and health. Crit Rev Food Sci Nutr. 2009;49(4):299-312. doi:10.1080/10408390802066805.
CrossRef - Oracz J, Zyzelewicz D, Nebesny E. The Content of Polyphenolic Compounds in Cocoa Beans (Theobroma cacao L.), Depending on Variety, Growing Region, and Processing Operations: A Review. Crit Rev Food Sci Nutr. 2015;55(9):1176-1192. doi:10.1080/10408398.2012.686934.
CrossRef - Shahidi F, Ambigaipalan P. Phenolics and polyphenolics in foods, beverages and spices: Antioxidant activity and health effects – A review. J Funct Foods. 2015;18:820-897. doi:10.1016/j.jff.2015.06.018.
CrossRef - Agriculture M of. Outlook Kakao.; 2016.
- Ramlah S. Karakteristik Mutu Dan Citarasa Cokelat Kaya Polifenol. J Ind Has Perkeb. 2016;11(1):23-32. doi:10.33104/jihp.v11i1.3553.
CrossRef - Katz DL, Doughty K, Ali A. Cocoa and chocolate in human health and disease. Antioxidants Redox Signal. 2011;15(10):2779-2811. doi:10.1089/ars.2010.3697.
CrossRef - Stanhope KL. Sugar consumption, metabolic disease and obesity: The state of the controversy. Crit Rev Clin Lab Sci. 2016;53(1):52-67. doi:10.3109/10408363.2015.1084990.
CrossRef - Wiskin AE, Davies JH, Wootton SA, Beattie RM. Energy expenditure, nutrition and growth. Arch Dis Child. 2011;96(6):567-572. doi:10.1136/adc.2009.158303.
CrossRef - Fang Y, Li R, Chu Z, Zhu K, Gu F, Zhang Y. Chemical and flavor profile changes of cocoa beans (Theobroma cacao L.) during primary fermentation. Food Sci Nutr. 2020;8(8):4121-4133. doi:10.1002/fsn3.1701.
CrossRef - Eyamo Evina VJ, De Taeye C, Niemenak N, Youmbi E, Collin S. Influence of acetic and lactic acids on cocoa flavan-3-ol degradation through fermentation-like incubations. LWT – Food Sci Technol. 2016;68:514-522. doi:10.1016/j.lwt.2015.12.047.
CrossRef - Kaaki D, Baghdadi OK, Najm NE, Olabi A. Preference mapping of commercial Labneh ( strained yogurt ) products in the Lebanese market. J Dairy Sci. 2020;95(2):521-532. doi:10.3168/jds.2011-4409.
CrossRef - Elgaard L, Mielby LA, Hopfer H, Byrne D V. A comparison of two sensory panels trained with different feedback calibration range specifications via sensory description of five beers. Foods. 2019;8(11). doi:10.3390/foods8110534.
CrossRef - Singh-Ackbarali D, Maharaj R. Sensory Evaluation as a Tool in Determining Acceptability of Innovative Products Developed by Undergraduate Students in Food Science and Technology at The University of Trinidad and Tobago. J Curric Teach. 2014;3(1):10-27. doi:10.5430/jct.v3n1p10.
CrossRef - Sudan P, Kaur R, Sharma S, Jain UK. A critical review on natural and artificial sweeteners. Pharm Chem J. 2016;3(1):21-29. www.tpcj.org
- Kiyat W El, Monica A, Qomariyah N, Manurung BS. Enzymes Involving in Chocolate Processing. Enzym Involv Choc Process. 2018;6(1):1-6. doi:10.14499/jfps
- Velez APE, Pagán J, Ibarz A. Melanoidins Formed by Maillard Reaction in Food and Their Biological Activity. Food Eng Rev. 2012;4(4):203-223. doi:10.1007/s12393-012-9057-9.
CrossRef - Moreira IM da V, Vilela L de F, Santos C, Lima N, Schwan RF. Volatile compounds and protein profiles analyses of fermented cocoa beans and chocolates from different hybrids cultivated in Brazil. Food Res Int. 2018;109(September 2017):196-203. doi:10.1016/j.foodres.2018.04.012.
CrossRef - Papalexandratou Z, Lefeber T, Bahrim B, Lee OS, Daniel HM, De Vuyst L. Hanseniaspora opuntiae, Saccharomyces cerevisiae, Lactobacillus fermentum, and Acetobacter pasteurianus predominate during well-performed Malaysian cocoa bean box fermentations, underlining the importance of these microbial species for a successful cocoa . Food Microbiol. 2013;35(2):73-85. doi:10.1016/j.fm.2013.02.015.
CrossRef - Ryan, C. M., Khoo, W., Ye, L., Lambert, J. D., Okeefe, S. F., & Neilson, A. P. Loss of Native Flavanols during Fermentation and Roasting Does Not Necessarily Reduce Digestive Enzyme-Inhibiting Bioactivities of Cocoa. Journal of Agricultural and Food Chemistry, 2016;64(18), 3616–3625. https://doi.org/10.1021/acs.jafc.6b01725.
CrossRef - Crafack M, Keul H, Eskildsen CE, et al. Impact of starter cultures and fermentation techniques on the volatile aroma and sensory profile of chocolate. Food Res Int. 2014;63:306-316. doi:10.1016/j.foodres.2014.04.032.
CrossRef - Husson F, Lê S, Pagès J. Confidence ellipse for the sensory profiles obtained by principal component analysis. Food Qual Prefer. 2005;16(3):245-250. doi:10.1016/j.foodqual.2004.04.019.
CrossRef - Dehlholm C, Brockhoff PB, Bredie WLP. Confidence ellipses: A variation based on parametric bootstrapping applicable on Multiple Factor Analysis results for rapid graphical evaluation. Food Qual Prefer. 2012;26(2):278-280. doi:10.1016/j.foodqual.2012.04.010.
CrossRef - Yang J, Lee J. Application of Sensory Descriptive Analysis and Consumer Studies to Investigate Traditional and Authentic Foods : A Review. Published online 2019:1-17. doi:10.3390/foods8020054.
CrossRef - Sudibyo A. Effect of Processing Techniques on Flavour and Characteristics of Cocoa Processed and Chocolate Products. J Ind Has Perkeb. 2017;12(1):1-13.
CrossRef - Lesschaeve I, Noble AC. Polyphenols: factors influencing their sensory properties and their effects on food and beverage preferences. Am J Clin Nutr. 2005;81(1 Suppl). doi:10.1093/ajcn/81.1.330s.
CrossRef - Afoakwa EO, Paterson A, Fowler M, Ryan A. Matrix effects on flavour volatiles release in dark chocolates varying in particle size distribution and fat content using GC-mass spectrometry and GC-olfactometry. Food Chem. 2009;113(1):208-215. doi:10.1016/j.foodchem.2008.07.088.
CrossRef - Mazor Jolić S, Radojčic Redovnikovic I, Marković K, Ivanec Šipušić D, Delonga K. Changes of phenolic compounds and antioxidant capacity in cocoa beans processing. Int J Food Sci Technol. 2011;46(9):1793-1800. doi:10.1111/j.1365-2621.2011.02670.x.
CrossRef - Oracz J, Nebesny E. Effect of roasting parameters on the physicochemical characteristics of high-molecular-weight Maillard reaction products isolated from cocoa beans of different Theobroma cacao L. groups. Eur Food Res Technol. 2019;245(1):111-128. doi:10.1007/s00217-018-3144-y.
CrossRef - Qin XW, Lai JX, Tan LH, et al. Characterization of volatile compounds in Criollo, Forastero, and Trinitario cocoa seeds (Theobroma cacao L.) in China. Int J Food Prop. 2017;20(10):2261-2275. doi:10.1080/10942912.2016.1236270.
CrossRef - Miguel MG da CP, Reis LV de C, Efraim P, Santos C, Lima N, Schwan RF. Cocoa fermentation: Microbial identification by MALDI-TOF MS, and sensory evaluation of produced chocolate. LWT – Food Sci Technol. 2017;77:362-369. doi:10.1016/j.lwt.2016.11.076.
CrossRef - Aprea E, Biasioli F, Gasperi F. Volatile compounds of raspberry fruit: From analytical methods to biological role and sensory impact. Molecules. 2015;20(2):2445-2474. doi:10.3390/molecules20022445.
CrossRef - Bi K, Qiu T, Huang Y. A deep learning method for yogurt preferences prediction using sensory attributes. Processes. 2020;8(5). doi:10.3390/PR8050518.
CrossRef - Saldaña E, Martins MM, Menegali BS, Selani MM, Contreras-Castillo CJ. Obtaining the ideal smoked bacon: What is the influence of the product space and multivariate procedure to construct the external preference mapping? Sci Agropecu. 2019;10(1):29-37. doi:10.17268/sci.agropecu.2019.01.03.
CrossRef - Cempaka L, Aliwarga L, Purwo S, Penia Kresnowati MTA. Dynamics of cocoa bean pulp degradation during cocoa bean fermentation: Effects of yeast starter culture addition. J Math Fundam Sci. 2014;46(1):14-25. doi:10.5614/j.math.fund.sci.2014.46.1.2.
CrossRef
Accepted on: 07 May 2021
Second Review by: Arthur Kwena Kenya
Final Approval by: Prof. Daniel Cozzolino


Web of Science Coverage
Emerging Sources Citation Index (ESCI)
2024 Journal Impact Factor: 1.1
Scopus Journal Metrics
CiteScore 2025: 2.6
CiteScore Details
Sustainable Nutrition: Food Systems, Nutrient Retention, and Public Health Impact
![]()
This journal is a member of, and subscribes to the principles of, the Committee on Publication Ethics (COPE)


