Toxic Effects of Food Colorants Erythrosine and Tartrazine on Zebrafish Embryo Development
Radhika Gupta1
, Chitra Bhasin2, Padmshree Mudgal1* 1Department of Biochemistry, Daulat Ram College, University of Delhi, Delhi, India.
2Department of Zoology, Daulat Ram College, University of Delhi, Delhi, India.
3Sansriti Foundation, Qutab Institutional Area, Delhi, India.
Corresponding Author Email: padmshree.m@gmail.com
DOI : http://dx.doi.org/10.12944/CRNFSJ.7.3.26
Download this article as:
![]()
Erythrosine and tartrazine are common artificial food additives which have become a part of daily human consumption. Advised daily intake values for these agents are set strictly, however, the actual intake is much higher than the recommended ADI. A higher intake of erythrosine and tartrazine is shown to exhibit adverse effects in mammalian models, and is thus a matter of public health concern.
In this study we have assessed and compared the dose-dependent effects of erythrosine and tartrazine on inducing oxidative stress in zebrafish embryos. We performed the superoxide dismutase (SOD) enzyme activity assay to test the effect of the two food colorants on reactive oxygen species (ROS) production. Erythrosine and tartrazine treated embryos showed significantly increased SOD activity in an enzyme assay. Additionally SOD mRNA transcripts in the treated embryos were found to be upregulated. Erythrosine and tartrazine treatment specifically altered SOD1 mRNA transcript levels while it had no effect on SOD2 mRNA, the other isoform found in zebrafish. Our study shows that erythrosine at a concentration of 0.05% is embryotoxic in a dose and time dependent manner. Tartrazine treated embryos exhibit similar toxicity at a concentration of 0.5%. Erythrosine treated zebrafish embryos hatch much slower when compared to tartrazine treated embryos and control embryos. While erythrosine affects the yolk utilization, tartrazine exhibits teratogenic effects on early zebrafish embryos. The mRNA expression as well as biochemical analysis indicates that exposure to food colorants induces cytoplasmic SOD transcription to combat the ROS toxicity in zebrafish embryos.
Erythrosine; Tartrazine; Yolk; Oxidative Damage; Superoxide Dismutase
Introduction
Food colorants are natural or synthetic substances used to artificially color and enhance the appearance of food products. Natural food dyes though are safe to use but, do not provide a bright Thus, artificial food colorants (AFCs) such as erythrosine which provide bright color are popular in food industry.1 Most of the AFCs are approved by food regulatory authorities, yet long term effects of consumption are a major health concern. Some of the reasons include lack of scientific data describing the side effects of long term regular consumption. Food manufacturing companies often use AFCs in quantity more than the ADI (Advised daily intake).2 Such an unregulated consumption may impose significant public health risks, especially in young children and adolescents. Therefore, it is necessary to regularly evaluate the safety conditions of AFC use and revise the mandatory regulatory ADI recommendations.
In India, children undertake high consumption of colored solid (2–465 g/day) and liquid foods (25–840 ml/day) with the predominant consumption of two colorants -tartrazine mainly from sweetmeats, beverages and fast foods, and erythrosine used in confectioneries, jams and jellies.2 In a study by Indian researchers, data collected from eastern states showed that 80.3% of sweets and savories were adulterated with AFCs, 72% of the food manufacturers flouted the permissible limits, and 28% used non permitted colors. Tartrazine usage ranged from 12.5 to 1091 mg/kg.3 Another study from Uttar Pradesh reported that 59% of food items contained more than the maximum limit, with average quantities crossing the threshold of 100 mg/kg in most food commodities. For tartrazine, saturation of ADI ranged from 27.4% to 90.3% in children and adolescents, and from 10.8% to 47.6% in adult subjects.4 Thus, children and young adults are consuming higher intake of food colorants. In another study done in Hyderabad on children and young adults aged 1-18 years, the consumption exceeded ADI for both tartrazine and erythrosine.5
Tartrazine a synthetic organic azo dye is often used as a low-cost alternative for saffron in Indian sweets, and biryanis. In addition, it is used in soft drinks and sport drinks, flavoured chips, sauces, ice creams, jams, jellies, and chewing gum. Tartrazine is metabolized by the intestinal microflora into sulfanilic acid and aminopyrazolone-metabolites which generate reactive oxygen species (ROS), leading to oxidative stress.6 Tartrazine induced oxidative stress damages rat brain tissue7 and alters Ca2+ signaling and enzyme secretion in pancreatic AR42J cells8 via sulfanilic acid production. Rats fed on tartrazine show an inflammation of stomach lining.9 Tartrazine induced ROS production damages the hepatic and renal tissues resulting in altered levels of glutathione peroxidase (GPx), superoxide dismutase (SOD), and catalase (CAT) and causes genotoxic effects in rats.5,10,11,12 Tartrazine binds directly to DNA and exerts cytotoxic, genotoxic and clastogenic effects.13,14,15,16,17,18
Erythrosine is a poly-iodinated xanthene dye, widely used in foods, cosmetics and pharmaceuticals.19 Erythrosine exerts cytotoxic and cytostatic effects on human peripheral blood cells,13 and induces endotoxic and mutagenic effects in HepG2 cells.20 Long term erythrosine usage influences childhood behavior,21 thyroid function,22 and results in inhibition of drug-metabolizing enzymes23 and mitochondrial respiration.10,23,24
It would be interesting to delineate specific effects of erythrosine and tartrazine on a living system and understand the long-term effects of oxidative damage/stress on developmental toxicity. In the present study we have used zebrafish (Danio rerio) as an animal model to assess the oxidative stress induced by erythrosine and tartrazine. Zebrafish are complex vertebrates and share 70% genetic homology with humans and approximately 84% of proteins in humans, are conserved in zebrafish.25 Early embryonic developmental stages are finely described in zebrafish.26 Zebrafish larvae are transparent and develop all the vital organ systems including nervous system, cardiovascular system, liver and kidneys within 3-4 days post fertilization (dpf) which allows study of organs and tissues in real time and provide feasibility for performing chemical and drug toxicity assays.27
Previous studies..28,29 have reported effects of these two food colorants on larval growth and development till 5 days post fertilization. However, there are no reports that compare the oxidative stress induced by erythrosine and tartrazine in zebrafish embryos. In the present study we have employed the zebrafish model to compare the oxidative stress induced by long term exposure (10 dpf) of two commonly used food additives, erythrosine and tartrazine in a wild type sequenced strain (ASWT). In addition, we have described a few developmental defects not reported by earlier studies.
Material and Methods
Zebrafish Maintenance, Breeding and Egg Collection
Wild type ASWT Zebrafish (Danio rerio) was obtained from CSIR-Institute of Genomics and Integrative Biology in New Delhi.30 Adult fish were maintained at 28 ± 20C, in a light controlled room (14 hours light and 10 hours dark cycle). Male and female fish were housed separately in a Recirculating Aquatic Eco-System (PENTAIR B262-2-B) in1.5 litres and 3 litres tanks with an optimum density of approximately 10 fishes per litre. Fishes were fed a combination diet of live artemia and adult dry feed (TetraMin ~ 0.05g/10 fishes). While handling the fish, utmost care was taken to minimize animal suffering.
Breeding tanks were set up in the evening, a day before, for egg collection. A plastic separator was placed in the middle of the breeding tank to separate male and female fish. The fish were allowed to mate, and spawn and fertilized eggs were collected next morning. The fertilization rate was found to be > 90%. Fertilized eggs were transferred into petri-plates containing embryo water (0.06 g ocean sea salt/litre of RO water) and grown in the incubator at 280C.
Erythrosine and Tartrazine Treatment
Embryos that had developmentally progressed to 1000 cell stage (3.5 hours post fertilization (hpf) were transferred into 6-well experimental plates with a density of 25 embryos/8ml/well. Four replicates each for test samples and control were set up for the study (n=100 embryos per treatment). For all experiments, embryo water (EW) was used as control. Embryos were exposed to and grown in the different concentrations of erythrosine (0.001%, 0.005%, 0.01%, 0.02%, 0.04%, 0.05% and 0.1%) and tartrazine (0.01%, 0.05%, 0.1% and 0.5%). All the treatment studies with zebrafish embryos were carried out till 10 dpf (days post fertilization). After every 24 hours, respective solutions were changed (water samples were brought to 280C before embryo transfers) and dead embryos, if any were removed. The embryos were visualized and photographed using EVOS inverted microscope. The embryos were monitored up to 264 hpf (hours post fertilization) for various parameters like mortality rate, hatching rate, heartbeat rate, and other morphological and developmental anomalies were scored. All images were processed using Adobe Photoshop.
SOD Assay
25 embryos aged 96 hpf and treated with 0.01 % erythrosine and 0.1 % tartrazine were taken in 100 µl of embryo water (EW) and homogenized at 8,000 rpm for 30 seconds. After centrifugation at 12,000 rpm for 10 min, clear supernatant (crude lysate) was collected. In 1ml reaction mix, the final concentrations of 50mM potassium phosphate, 0.1mM ethylenediaminetetraacetic acid, 0.01mM cytochrome c, 0.05mM xanthine, 0.005 units xanthine oxidase and 50 µl of crude lysate31 were used. The increase in absorbance was noted at 550nm for approximately 5 minutes. Change in absorbance was used as the measure of SOD activity.31 The experiment was repeated in triplicates. Untreated embryos were used as controls.
Real-time PCR
For quantitative real-time PCR assays, RNA was extracted from treated and untreated embryos using the RNeasy mini kit (Qiagen). First-strand cDNA synthesis was performed using the quantitate ( Qiagen). The cDNA was analyzed with SYBR Green Mix (Takara) by quantitative RT–PCR using the Light Cycler 480II (Roche). All samples were prepared in triplicate, and each experiment was repeated at least three times using independent batches of embryos. The PCR cycle conditions were 95°C for 15 minutes, (94°C for 15 seconds, 60°C for 30 seconds, and 72°C for 30 seconds) for 40 cycles. The Ct value data were analyzed using the 2−ΔΔT method.32 Primer sequences used for PCR amplification are given below:
SOD1: Forward TGGTGACAACACAAACGGCT Reverse AGAATGTTGGCCTGACAGAGTC
SOD2: Forward GTCTGTTGGTTGGTCGCTTG Reverse GCATGGTGCTTGCTGTGATG
GAPDH: Forward ACCAACTGCCTGGCTCCT Reverse TACTTTGCCTACAGCCTTGG
Statistical Analysis
Data was expressed as mean ±S.E.M. (n= 3). The results were analyzed using a one-way ANOVA and Tukey’s test and were considered significantly different if the p values were 0.05 or less.
Results
1. Erythrosine shows higher embryotoxicity over tartrazine in zebrafish embryos.
Zebrafish embryos at the 1000 cell stage were grown in the presence of different concentrations of erythrosine ranging from 0.001% to 0.1%, and tartrazine from 0.01% to 0.5%. Survival rate of zebrafish embryos in different concentrations of erythrosine and tartrazine treatment was studied up to 264 hpf (Figure 1 and 2). In untreated embryo water (EW), the survival rate of the embryos was about 96% by 216 hpf. The survival rate of embryos treated with erythrosine up to 0.005% concentration was comparable to EW. Exposure to 0.05% erythrosine showed 90% survival in the treated embryos by 96 hpf but only 50% of the embryos survived by 120 hpf. Continued exposure was lethal. A treatment of 0.1% erythrosine resulted in 50% survival of the treated embryos by ~80 hpf which further reduced to 15% by 96 hpf (Figure 1A). Hence, erythrosine is embryo-toxic at 0.05% and above concentrations in a dose and time dependent manner. Survival rate of the embryos was observed to be much higher with tartrazine treatment. Up to 72 hpf the survival rate of tartrazine treated embryos at all the concentrations tested were more than 95%. After ten days (216 hpf) of treatment with 0.5% tartrazine more than 70% survival rate was observed (figure 1B). The maximum non-lethal non phenotypic concentration of erythrosine and tartrazine at 96 hpf zebrafish embryos was determined to be 0.01% (10ppm) and 0.1% (100ppm) respectively.
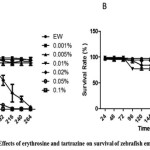 |
Figure 1: Effects of erythrosine and tartrazine on survival of zebrafish embryos. A) Survival rate of zebrafish embryos (n=100) treated with varied concentrations of erythrosine. B) Survival rate of zebrafish embryos (n=100) treated with varied concentrations of tartrazine. The data presented is for four replicates (n=25 embryos). Mean + SEM calculated by Graphpad Prism 5.0. Click here to View figure |
2. Tartrazine treatment enhances hatching rate in zebrafish embryos
Hatching rate, an index of developmental toxicity, was observed in embryos treated with erythrosine and tartrazine. Embryos hatched by 96 hpf in EW. Erythrosine treatment caused slight delay in hatching rate at higher concentrations. Embryos exposed to erythrosine at 0.005% and above concentrations hatched by 120 hpf (figure 1B). In contrast, tartrazine at higher concentration (0.5% and above) increased the hatching rate significantly with 55% of the embryos hatched by 48 hpf in 0.5% tartrazine and 100% hatched by 72 hpf (figure 2B).
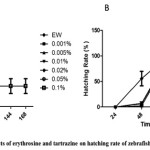 |
Figure 2: Effects of erythrosine and tartrazine on hatching rate of zebrafish embryos. A) Hatching rate of zebrafish embryos (n=100) treated with varied concentrations of erythrosine. B) Hatching rate of zebrafish embryos (n=100) treated with varied concentrations of tartrazine. The data presented is for four replicates (n=25 embryos). Mean + SEM calculated by Graphpad Prism 5.0. Click here to View figure |
3. Erythrosine inhibits yolk utilization in early zebrafish embryos.
All the sets of embryos that were treated with erythrosine and tartrazine were observed for teratogenic effects from 1 dpf till 10 dpf. At 24 hpf, embryos treated with all test concentrations of erythrosine appeared similar to that of the control embryos grown in EW. In the 0.1% erythrosine treated embryos, pink color could be observed inside the chorion suggesting uptake of the colorant (figure 3A). At 96 hpf, embryos treated with 0.01% and higher concentration of erythrosine displayed accumulation of erythrosine in the intestinal region (figure 3B). Embryos treated with erythrosine at concentration of 0.05% and above showed yolk edema. The degree of yolk edema increases with increase in the concentration of erythrosine treatment. The phenotype appears first at 72 hpf at 0.05% erythrosine treatment. Hence, erythrosine treatment delayed yolk utilization in zebrafish larvae.
Erythrosine also inhibited swim bladder formation. Defect in swim bladder formation was seen at treatment concentration as low as 0.01%. Curved body axis defects and bent tail morphology were primarily documented for 0.1% erythrosine treated embryos at 96 hpf (figure 3B).
Tartrazine inhibited swim bladder development in developing embryos at all concentrations similar to erythrosine treated embryos. Embryos growing in 0.01% tartrazine exhibited both axial and dorsal curvature defects by 120 hpf (figure 3B). Treatment of tartrazine at 0.2% concentration and above led to the development of other body deformities such as bent tail as early as 72 hpf. Exposures after 120 hpf led to the development of other defects such as heart edema and mouth deformities.
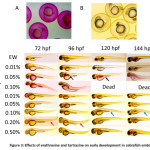 |
Figure 3: Effects of erythrosine and tartrazine on early development in zebrafish embryos. A and B. The presence of erythrosine and tartrazine is detected inside the chorion in erythrosine and tartrazine treated embryos at 24 hpf respectively. C Erythrosine treated embryos at 96 hpf (at concentrations 0.05% and 0.1%) exhibit unutilized yolk. Erythrosine is detected in the intestine of the treated embryos (Black Arrowheads). Tartrazine yielded a bent tail morphology (red arrowheads) and curved body axis (blue arrowheads) suggestive of teratogenicity. Embryo water was used as control. Absence of swim bladder is seen in embryos treated with both erythrosine and tartrazine. (Magnification = 4X). Click here to View figure |
4. Erythrosine and tartrazine treatment specifically alters SOD1 activity while it has no effect on SOD2
The maximum non-lethal non phenotypic concentration of erythrosine and tartrazine at 96 hpf zebrafish embryos was determined to be 0.01% (10ppm) and 0.1 % (100ppm) respectively. Embryos treated with erythrosine (0.01%) and tartrazine (0.1%) were collected at 96 hpf and superoxide dismutase activity was determined using cytochrome C as the substrate. A 3-fold and 2-fold increase in SOD activity in erythrosine treated (185.3 µmol/min/ml) and tartrazine treated (78.6µmol/min/ml) embryos respectively was observed as compared to untreated embryos (39 µmol/min/ml). Further, to determine whether both SOD1 and SOD2 isozymes show an increased activity, real time PCR was performed using SOD1 and SOD2 specific primers and GAPDH as control. SOD1 mRNA levels were found to be 2.3-fold higher in erythrosine treated embryos as compared to untreated embryos. There was no significant difference in the SOD2 mRNA levels of erythrosine treated versus untreated larval samples. The tartrazine treated samples also showed a similar trend with 1.9-fold differences in SOD1 mRNA levels as compared to untreated and no difference was observed in the SOD2 mRNA levels.
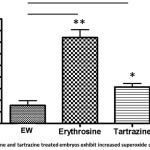 |
Figure 4: Erythrosine and tartrazine treated embryos exhibit increased superoxide dismutase activity. Embryos treated with erythrosine (0.01%; n=25) and tartrazine (0.1%; n=25) were used for the assay. Embryos grown in embryos water served as control. Data is expressed as mean ±S.E.M. (n= 3). The values are significantly different from control embryos and are indicated as stars. One star is p<0.05 and two stars is p<0.01. (one-way ANOVA by Tukey’s test). Click here to View figure |
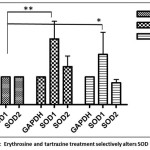 |
Figure 5: Erythrosine and tartrazine treatment selectively alters mRNA of SOD isoforms. mRNA profile of SOD1 and SOD2 transcripts of 5 dpf larvae in embryo water (EW) versus erythrosine and tartrazine treated larvae as compared to GAPDH. mRNA was isolated from 5 dpf larvae treated with erythrosine (0.01%) or tartrazine (0.1%) or with embryo water. GAPDH was used as control. Data is expressed as mean ±S.E.M. (n= 3). The values are significantly different from control larvae and are indicated as stars (one-way ANOVA by Tukey’s test). One star is p<0.05 and two stars is p<0.01. (one-way ANOVA by Tukey’s test). Click here to View figure |
Discussion
Our studies with zebrafish embryos have shown that erythrosine is teratogenic at 0.05% (500 ppm) by 120 hpf exposure. Hatching delay, which is an index of developmental delay in zebrafish embryos, is observed in embryos treated with 0.005% (50 ppm) and higher concentration of erythrosine. There was complete absence of swim bladder at concentrations as low as 0.01% (100 ppm) of erythrosine treatment. The degree of defects detected was observed to be enhanced in a concentration and time dependent pattern.
Previous study by Manimaran et al.,28 and Joshi et al.,29 on impact of erythrosine and tartrazine treatment on early zebrafish embryo development up to 96 hpf showed similar developmental phenotypes.
The present study has taken into account the impact of long term exposure (up to 10 days) of erythrosine on inducing oxidative stress in zebrafish larvae. Further, for all the experiments in this study, we have used a wild type ASWT strain for which the sequence information is available,30 as compared to previous studies,28, 29 where aquarium or farm bred zebrafish has been used.
Oxidative stress which involves production of ROS such as hydroxyl radical, hydrogen peroxyl radical, superoxyl radical, is a mechanism underlying a number of toxicity processes. Excess of oxygen radicals damage DNA, lipids, proteins and carbohydrates. Hence, organisms have defense mechanisms to neutralize ROS. These include enzymes such as glutathione-S-transferase, SOD, Catalase, Glutathione peroxidase.
Oxidative stress markers such as SOD, catalase and GSH are known to increase in both erythrosine and tartrazine treated mice.7 In young male rat tartrazine effects biochemical parameters such as oxidative biomarkers and renal and hepatic functions.7 In our study, SOD1 enzyme activity was found to increase by 4.5-fold and 2 fold in erythrosine and tartrazine treated embryos respectively when compared to controls. The increased SOD1 activity was consistent with rise in the SOD transcripts and expression as measured by RT-PCR. It is interesting to note that erythrosine and tartrazine selectively alter the activity and expression of the SOD isoforms in zebrafish. SOD1 which is expressed in the cytoplasm is significantly increased compared to SOD2 which has a mitochondrial expression. This observation has not been reported in previous studies on effects of food colorants in zebrafish.
In comparison to previous studies.,28, 29 we tracked the zebrafish larvae development for a longer duration (10 dpf) and used a broader concentration range of erythrosine and tartrazine exposure for documenting developmental abnormalities. We have shown additional toxicity induced morphological and developmental defects, such as, absent or reduced swim bladder, altered body curvature and mouth deformities.
Both, erythrosine and tartrazine inhibited swim bladder development. This deformity was observed at 0.01% (100 ppm) and above concentrations for . Wnt/β-catenin signaling and the crosstalk between Wnt and Hh in the developing endoderm may play a role in early swim bladder development.20 It would be interesting to observe expression of components active in these signaling pathways in the erythrosine and tartrazine treated embryos. Wnt signaling plays critical roles in mammalian lung development.33 In this light, studies to investigate the long-term impact of food colorants on human development need to be undertaken.
Zebrafish embryos exposed to tartrazine above 0.1% (1000 ppm) developed bent tail phenotype as early as 72 hpf. These phenotypes could result from neuro- muscular or cytoskeletal deformities.
Erythrosine treated embryos were unable to utilize the yolk during early development. In zebrafish embryos the yolk is covered by a syncytium of nuclei organized into a cytoplasmic layer called Yolk syncytial layer which allows uptake of yolk nutrients in early embryo. Zebrafish yolk is a good system to allow modelling of lipid metabolism.34 YSL is the production house for lipoproteins such as apoC2 or MTP which are essential for yolk utilization.35 It would be interesting to observe the expression of genes involved in lipid metabolism and lipoprotein production in the erythrosine treated embryos.
Further, in this study we have compared the teratogenic potential of erythrosine and tartrazine. In contrast to erythrosine, tartrazine was not observed to be teratogenic. Even after ten days (216 hpf) of treatment with 0.5% (5000ppm) tartrazine, more than 70% survival rate was observed. Similar observations were reported by Joshi and Katti .29 In contrast to erythrosine, tartrazine accelerated the hatching rate. Tartrazine may alter the signals in the biochemical and developmental pathways needed for the embryo to hatch.36,37
These results demonstrate that both erythrosine and tartrazine exposure during early development, induce the expression of the SOD1 by inducing oxidative stress pathways. The sensitivity of embryos to food colorants exposure resulted in significant mortality in a concentration-dependent manner, especially at higher concentrations. The increased SOD activity is a protective mechanism employed by the larvae against the increased ROS generated by these coloring agents. As increased embryo toxicity is observed in erythrosine treated embryos as compared to tartrazine treated embryos at ten times lower concentrations, it very well correlates to increased SOD activity observed in erythrosine treated embryos as compared to tartrazine treated embryos. This study indicates that concentrations as low as 500ppm of erythrosine is highly toxic for the zebrafish embryo development. The current ADI of these colorants need revision and their use should be restricted, as the prime consumers of food colorants are the younger children in form candies and sweets.
Acknowledgements
The authors sincerely thank Dr. Sridhar Sivasubbu, Senior Scientist, CSIR-IGIB, South Campus, New Delhi for mentorship and extending his laboratory facilities for training personnel (students and faculty of DRC) in fish husbandry and maintenance. Authors would also like to thank Dr. TN Vivek and Ayappa Raja for their help provided during RT-PCR experiments. Technical Assistance of Mr. Lalit Sharma & Mr. Pratish Kumar is also acknowledged.
The authors acknowledge financial assistance provided by Innovation Project (2016-2017), Delhi University DRC-301 and Star College Status grant (2014 onwards) by Department of Biotechnology, Government of India.
Funding
The authors acknowledge financial assistance provided by Star Innovation Project University of Delhi 2016-19, Delhi University DRC-301 and Star College Status grant (2014 onwards) by Department of Biotechnology, Government of India.
Conflict of Interest
The Authors declare that there is no conflict of interest.
References
- Okafor S, Obonga W, Mercy A et al., (2016). Assessment of the Health implications of Synthetic and Natural Food Colourants – A Critical Review. 4(4): 01-11.
- Rao P. and Sudershan V. (2008) Risk assessment of synthetic food colours: a case study in Hyderabad, India. Int. .J. Food Saf. Nut. Pub. Health (1). https://doi.org/10.1504/IJFSNPH.2008.018857
- Dixit S, Khanna SK, Das M (2013). All India survey for analyses of colors in sweets and savories: exposure risk in Indian population. J Food Sci. Apr;78(4):T642-7. doi: 10.1111/1750-3841.12068.
- Dixit S, Purshottam SK, Gupta SK, Khanna SK, Das M( 2010 ). Usage pattern and exposure assessment of food colours in different age groups of consumers in the State of Uttar Pradesh, India. Food Addit Contam Part A Chem Anal Control Expo Risk Assess. Feb;27(2):181-9. doi: 10.1080/19440040903268062.
- Rao P, Bhat V, Sudershan V, Krishna P, Naidu N. (2004). Exposure assessment to synthetic food colours of a selected population in Hyderabad, India. Food Addit Contam. May;21(5):415-21.
- Chung T, Stevens E Jr, Cerniglia E (1992). The reduction of azo dyes by the intestinal microflora. Crit Rev Microbiol.18(3):175-90.
- Bhatt D, Vyas K, Singh S, John J, Soni I (2018). Tartrazine induced neurobiochemical alterations in rat brain sub-regions. Food Chem Toxicol. Mar;1(13):322-327. doi: 10.1016/j.fct.2018.02.011.
- Ameur Z, Mehedi N, Kheroua O, et al (2018). Sulfanilic acid increases intracellular free-calcium concentration, induces reactive oxygen species production and impairs trypsin secretion in pancreatic AR42J cells. Food Chem Toxicol. Oct; 120:71-80. doi: 10.1016/j.fct.2018.07.001.
- Moutinho L, Bertges C, Assis V (2007). Prolonged use of the food dye tartrazine (FD&C yellow no 5) and its effects on the gastric mucosa of Wistar rats. Braz J Biol. Feb;67(1):141-5.
- Khayyat L., Essawy A., Sorour J., and Soffar A. (2017). International Journal of Pharmacy and Pharmaceutical Sciences. A 90-day oral toxicity study of tartrazine, a synthetic food dye, in wistar rats. 3l(3):159–169
- Saxena B and Sharma S. (2015). Food Color Induced Hepatotoxicity in Swiss Albino Rats, Rattus norvegicus. Toxicol Int. Jan-Apr;22(1):152-7. doi: 10.4103/0971-6580.172286.
- Amin A, Abdel Hameid H 2nd, Abd Elsttar H. (2010). Effect of food azo dyes tartrazine and carmoisine on biochemical parameters related to renal, hepatic function and oxidative stress biomarkers in young male rats. Food Chem Toxicol. Oct;48(10):2994-9. doi: 10.1016/j.fct.2010.07.039
- Mpountoukas, P., Pantazaki, A., Kostareli, E., et al (2010). Cytogenetic evaluation and DNA interaction studies of the food colorants amaranth, erythrosine and tartrazine. Food and Chemical Toxicology 48(10): 2934-2944
- Floriano JM, da Rosa E, do Amaral QDF. (2018). Is tartrazine really safe? In silicoand ex vivotoxicological studies in human leukocytes: a question of dose. Toxicol Res (Camb). Jul 20;7(6):1128-1134. doi: 10.1039/c8tx00034d.
- Atlı Şekeroğlu Z, Güneş B, Kontaş Yedier S, Şekeroğlu V, Aydın B (2017). Effects of tartrazine on proliferation and genetic damage in human lymphocytes. Toxicol Mech Methods. Jun;27(5):370-375. doi: 10.1080/15376516.2017.1296051
- Soares M, Araújo M, Ramos A. et al (2015). Effects on DNA repair in human lymphocytes exposed to the food dye tartrazine yellow. Anticancer Res. Mar;35(3):1465-74.
- Kashanian S and Zeidali SH. (2011). DNA binding studies of tartrazine food additive. DNA Cell Biol. Jul;30(7):499-505. doi: 10.1089/dna.2010.1181.
- Giri AK, Das SK, Talukder G, Sharma A. (1990). Sister chromatid exchange and chromosome aberrations induced by curcumin and tartrazine on mammalian cells in vivo. Cytobios. 62(249):111-7.
- Ganesan L, Margolles-Clark E, Song Y, Buchwald P (2011) The foodcolorant ErB is a promiscuous protein–protein interactioninhibitor. Biochem Pharmacol 81(6):810–818
- Chequer , Vinícius de Paula Venâncio V. de V., Bianchi M. de P., and Antunes G. ( 2012) Genotoxic and mutagenic effects of erythrosine B, a xanthene food dye, on HepG2 cells. Food Chem.Toxicol. 50( 10) : 3447-3451.
- Silbergeld K. and Anderson (1982) Artificial food colors and childhood behavior disorders. Bull. NY Acad. Med., 58 : 275-295)
- Jennings S. et al, (1990). Effects of oral erythrosine (2′,4′,5′,7′-tetraiodofluorescein) on the pituitary–thyroid axis in rats. Toxicol. Appl. Pharmacol. 103: 549-556.
- Mizutani T (2009) Toxicity of xanthene food dyes by inhibition of human drug-metabolizing enzymes in a noncompetitive manner. J Environ Public Health 2009:1–9.
- Reyes G, Valim F, Vercesi E. (1996). Effect of organic synthetic food colours on mitochondrial respiration.Food Addit Contam. Jan;13(1):5-11.
- Howe K., Clark D., Torroja F. et al., (2013). The zebrafish reference genome sequence and its relationship to the human genome. Vol 496: 498-503.
- Kimmel B., Ballard W., Kimmel R., et al (1995). Stages of embryonic development of the zebra fish. In Dev. Dyn. Vol 203: 253 -310.
- William H. and Hong C. (2011). Multi-Step Usage of in Vivo Models during rational Drug Design and Discovery. In Int. J. Mol. Sci. Vol 12(4): pp.(2262-2274). doi:10.3390/ijms12042262
- Manimaran D., Krishnan N., Thangavel M., et al (2018). Erythrosine Induces Teratogenic Effects Via Activation of ROS Biogenesis in Zebrafish Embryos. ran J Sci Technol Trans Sc A: 1-9. 10.1007/s40995-018-0612-y
- Joshi V. and Katti P. (2018). Developmental Toxicity Assay for Food Additive Tartrazine Using Zebrafish (Danio rerio) Embryo Cultures. Int J Toxicol. 37(1):38-44. doi: 10.1177/1091581817735227).
- Patowary A., Purkanti R., Singh M., et al (2013). A Sequence-Based Variation Map of Zebrafish. Vol 10(1):15-20.
- The Regulation of Rat Liver Xanthine Oxidase (1969). The Journal of Biological Chemistry 244, 3855-3863.
- Ramkumar A, Murthy D, Raja DA et al (2017). Classical autophagy proteins LC3B and ATG4B facilitate melanosome movement on cytoskeletal tracks. Aug 3;13(8):1331-1347. doi: 10.1080/15548627.2017.1327509.
- Yin A, Korzh S, Winata CL, Korzh V, Gong Z (2011). Wnt Signaling Is Required for Early Development of Zebrafish Swimbladder. PLoS ONE 6(3): e18431. https://doi.org/10.1371/journal.pone.0018431.
- Miyares RL, de Rezende VB, Farber SA. (2014). Zebrafish yolk lipid processing: a tractable tool for the study of vertebrate lipid transport and metabolism. Dis Model Mech. Jul; 7(7):915-27. doi: 10.1242/dmm.015800. 2014
- Schlegel A, Stainier Y. (2006). Microsomal triglyceride transfer protein is required for yolk lipid utilization and absorption of dietary lipids in zebrafish larvae. Biochemistry. Dec26;45(51):15179-87.
- Sano K, Inohaya K, Kawaguchi M, et al (2008). Purification and characterization of zebrafish hatching enzyme – an evolutionary aspect of the mechanism of egg envelope digestion. FEBS J. 275:5934–46.
- Nechaev V and Pavlov S (2004). The species specificity of hatching enzyme and its effect on the duration of embryogenesis in the fish. Cichlasoma nigrofasciatum (Cichlidae) Dokl Biol Sci. 394:78–8.
Scopus Citation(s): 43
Accepted on: 11/11/2019
Second Review by: Dr. Ekrem Cem Çankırılıgil Turkey
Final Approval by: Dr. Victor J. Temple


Web of Science Coverage
Emerging Sources Citation Index (ESCI)
2024 Journal Impact Factor: 1.1
Scopus Journal Metrics
CiteScore 2025: 2.6
CiteScore Details
Sustainable Nutrition: Food Systems, Nutrient Retention, and Public Health Impact
![]()
This journal is a member of, and subscribes to the principles of, the Committee on Publication Ethics (COPE)


