Predictors and Inter-Linkage of Household and Individual Food Insecurity in Urban Geriatric Subjects: A Community Based Study from India
Dr. Priya Keshari1* and Dr. Hari Shankar2
1Department of Home Science, Faculty of Sciences, University of Allahabad, Prayagraj, India.
2Department of Community Medicine, Institute of Medical Sciences, Banaras Hindu University, Varanasi, India.
Corresponding Author Email: priya.bhu2010@gmail.com
DOI : http://dx.doi.org/10.12944/CRNFSJ.9.2.27
Download this article as:
![]()
Food insecurity affects many dimensions of well-being. It may lead to under nutrition. Although geriatric subjects from food insecure households are more likely to have inadequate energy, household food security does not necessarily guarantee for energy adequacy at individual level. This community based cross-sectional study was conducted on 616 geriatric subjects to find out predictors of food insecurity at household and individual level and examine energy adequacy at family versus individual level. Subjects were selected by multistage sampling procedure from urban Varanasi, India. A predesigned, pretested proforma was used for collecting socioeconomic information. Food insecurity was assessed using Household Food Insecurity Access Scale; 24 hours recall method was used for energy intakes. For analysis of data SPSS version 22.0 was used. χ2 and logistic regression were used for inferential purpose. Food insecurity at household was 68.2%.The significant association of marital status, religion, type and size of family and literacy status with household food insecurity in univariate analysis got eliminated after applying logistic regression analysis; Adjusted Odds Ratios were higher for SC/ST Caste (2.13; 95% CI: 1-4.5) and upper lower plus lower socio economic status(24.13; 95% CI: 13.87-44.61). On energy intake considerations, of 53.9% subjects with household food insecurity, 80.7% had individual food insecurity whereas of 46.1% subjects with household food security 63.7% subjects had individual food insecurity. Caste and socioeconomic class predicted food insecurity at household level. Energy adequacy at family level did not ensure energy adequacy in geriatric subjects.
KEYWORDS:Energy Adequacy, Geriatric Subjects, Household Food Insecurity, Individual Food Insecurity, Urban Area
Introduction
Raising nutritional status, ensuring food security and fighting against hunger have been major concerns of stakeholders globally. Feeding hungry people across the world has been a great challenge of many countries. As per Global Report on Food Crisis (2018) in 2017 nearly 124 million people across 51 countries were facing acute food insecurity or worse and they were in need of urgent assistance1.The report of the State of Food Security and Nutrition(2018)also emphasized that in 2017 globally one out of every nine people was victim of chronic food insecurity or undernourishment. The absolute number of people in the world affected by chronic food deprivation increased from around 804 million in 2016 to nearly 821 million in 2017.The prevalence of severe food insecurity at the global level increased from 8.9% in 2014 to 10.2% in 20172.
For ensuring food security to the Indian population India has made a great history many years ago in the form of green, white and blue revolutions3. However, considerable number of Indians living in poor state is still dying due to hunger. Viewed from human rights perspective “Right to Food” is one of the fundamental rights of everyone. In order to secure this fundamental right, Government of India has made many attempts through public action programs in the form of Public Distribution System, Targeted Public Distribution System, supplementary feeding, food for work and Midday Meal Scheme etc. Despite these impressive initiatives India shares a quarter of the global hunger burden and food insecurity remain as the most devastating problems in front of government4. Food insecurity is a situation which compels a family or individual to struggle for food to satisfy the hunger of their family members and oneself as well. It reflects the struggle, pain, uncertainty, sense of insecurity faced by individuals not just for food but for a dignified and healthy life. Food insecurity exist whenever the availability of nutritionally adequate and safe foods or the ability to acquire acceptable foods in socially acceptable ways is limited or uncertain5. It refers to individuals fight for his/her right and dignified life. The state of food insecurity often leads to a person not only poor nutritional status but also affects their psychological status too. In old age food insecurity can be aggravated by ill health of the spouse compromising ability to purchase and prepare food in spite of having money.
Food insecurity affects both rural and urban areas and all age groups. But there are some factors like increasing urbanization, rural to urban migration, overcrowding, poor environmental conditions, unplanned living arrangement, high dependency on wages and doing work in unorganized sectors that make the problems of food security more complex in urban areas6.Geriatric subjects living in urban areas are likely to experience food insecurity more than others due to financial insecurity as result of less involvement in gainful employment, decrease capabilities for procurement and preparation of food. Adverse consequences of household food insecurity are likely to be more pronounced for geriatric subjects in terms of their energy adequacy. Thus their food accessibility and availability become problematic which is further complicated by changing socio cultural context and high dependency ratio. Besides these forces literacy can be a significant contributor of food security. While conceptualizing this study it was assumed that common geriatric problems (viz., self reported morbidities, depressive status and functional capacity in terms of Activity of Daily Living) may predispose them to energy inadequacy. With this background this study was conducted with the objective of finding out predictors and inter-linkage of household and individual food insecurity in urban geriatric subjects.
Materials and Methods
Study Population and Design
This community based cross sectional study was conducted in urban Varanasi, India. As per Census (2011) Varanasi district had a population of 3682194 of which 43.4% subjects were from urban Varanasi. The geriatric population constituted 7% of the total population7. In this study urban geriatric subjects having age > 60 years were taken as study subjects. Socio Economic Deprivation (SED) was found as root cause for food insecurity in urban households and this was taken as the basis for estimation of sample size. Taking a prevalence of 40% for SED8, 5% permissible error (absolute), design effect of 1.5 and non response rate 10% final sample size worked out to be 616. In order to select study subjects multistage sampling procedure was adopted; selection of wards, households, families and study subjects was done adopting standard sampling procedure. From 90 census enumeration wards in the Varanasi city, 9 wards were selected by simple random sampling. From the selected census enumeration wards households were selected according to probability proportion to size adopting systematic random sampling method. One family was selected randomly from each selected household using lottery method and same procedure was adopted for selection of study subject from selected families. Ethical clearance was taken from Ethical Committee of Banaras Hindu University, India and consent was obtained from participants using bilingual (Hindi and English versions) consent form. Subjects who gave their consent for the study were included in the study, whereas subjects with terminal illness or having serious mental abnormality and also if their duration of stay in the study area was less than six months were excluded from the study.
Socio-Demographic Characteristics
After obtaining consent for participation in the study each subject was administrated a predesigned and pretested proforma to obtain information about socio-demographic characteristics (viz., age, gender, marital status, religion, caste, educational status, occupation, type of family and total number of family members). Education and occupation of head of the family as well as total family income were assessed through interview technique using above mentioned tool. These information were used to compute socioeconomic status applying Kuppuswamy Classification 9.
Assessment of Household Food Insecurity
Household Food Insecurity Access Scale developed by FANTA III project was used to assess household food insecurity10.The scale was pretested in non study area and necessary modifications were done. This scale had 9 questions focusing primarily on following components (a) Anxiety and uncertainty about the household food supply, (b) insufficient quality (includes variety and preferences of the type of food) and (c) insufficient food intake along with their scores. Subject/ any responsible family member was interviewed about these questions and based on their response the scores were calculated and households of subjects were categorized into four categories (viz., food secure, mildly food insecure, moderately food insecure and severely food insecure).
Energy Intake at Family and Individual Level
Energy intake at family level was computed through dietary assessment by 24 hour recall oral questionnaire method using scale of dietary coefficients. Energy intake of >2100 Kcal per Consumption Unit (PCU) was considered as adequate at family level. Energy intake of geriatric subjects was assessed by 24 hours dietary recall method giving due consideration to age, sex, physiological and activity pattern of study subjects. During the time of interview with geriatric subjects all precautions were taken and information provided by them was verified by asking cross questions to their care givers. In order to avoid recall bias 24 hours recall method was chosen. As subjects with serious mental abnormality were excluded, subjects included in this study were able to recall their dietary intake of past 24 hours. A subject was considered as energy adequate when intake of energy with reference to Recommended Dietary Allowances was > 100%11, 12. According to Food and Agriculture Organization of the United Nations “Average Dietary Energy Supply Adequacy” which compares food supply with requirements and “Prevalence of undernourishment” which measures dietary energy deprivation compared to requirement has been suggested as an indicator of food insecurity13, 14, 15. Based on this energy intake of subjects has been taken as the basis for assessing food security at individual level and a cutoff level of >100% energy intake against RDA was taken for this purpose.
Self Reported Morbidities, Functional Capacity and Depression Status
In order to find out association and predictor potential of self reported morbidities, functional capacity in terms of Activity of Daily Living and depression status of subjects with food insecurity status, these were assessed adopting standard tools and techniques. Self reported morbidities of subjects were assessed by interviewing them with the help of predesigned and pretested proforma. Functional capacity of the subjects was assessed by interviewing them using Barthel’s Index of ADL (BAL)16. Depression status of subjects was assessed interviewing them using Geriatric Depression Scale17.
Statistical Analysis
Data were entered in personal computer; appropriate tables and figures were generated by using IBM Statistical Package (SPSS) version 22.0. For inferential purpose Pearson’s Chi square test and logistic regression analysis (Adjusted Odds Ratio and 95% Confidence Intervals) were applied. Association between self reported morbidities, functional capacity and depression status of subjects socio demographic variables and household food insecurity as well as individual food insecurity was done through Pearson’s Chi square test. Variables under this test with a p value <0.05 were considered as statistically significant and were further put in logistic regression model. For pinpointing predictors of food insecurity, food insecurity was taken as dependent variable and all variables significant in univariate analysis were used as independent variables. Pearson’s Chi square test was used to find out inter-linkage between household and individual food insecurity.
Results
Socio-Demographic Characteristics
Of 616 geriatric subjects 63.6% belonged to age group 60-69 years, 54.7% were female, 14.8% were widower, whereas 20.6% were widowed. Majority(82.6%) of them was Hindu and remaining was Muslim. As much as 51.6% and 32.4% subjects were from Other Backward Caste (OBC) and others (general) caste category. As much as 35.2%, 29.6% and 35.2% subjects were from nuclear, joint and three generation families, respectively. Half (50.5%) of the subjects had size of family > 6. In all 17.9% subjects were unemployed and 16.5% were self employed. Two hundred fifty two(40.9%) subjects were illiterate and 41.9% subjects belonged to upper lower plus lower class (Table1). Extent of illiteracy was considerably more in female (60.8%) than in male subjects (16.8%).
Table 1: Socio-Demographic Characteristics of Study Subjects.
| Particulars (N= 616) | Number | Percent |
| Age (years) | ||
| 60- 69 | 392 | 63.6 |
| 70-79 | 173 | 28.1 |
| >80 | 51 | 8.3 |
| Gender | ||
| Male | 279 | 45.3 |
| Female | 337 | 54.7 |
| Marital Status | ||
| Married | 398 | 64.6 |
| Widower | 91 | 14.8 |
| Widowed | 127 | 20.6 |
| Religion | ||
| Hindu | 509 | 82.6 |
| Muslim | 107 | 17.4 |
| Caste | ||
| SC/ST | 98 | 15.9 |
| OBC | 318 | 51.6 |
| Others | 200 | 32.4 |
| Type of Family | ||
| Nuclear | 217 | 35.2 |
| Joint | 182 | 29.6 |
| Three generation | 217 | 35.2 |
| Size of Family | ||
| < 3 | 80 | 13.0 |
| 3-6 | 225 | 36.5 |
| >6 | 311 | 50.5 |
| Occupational status | ||
| Self Employed | 102 | 16.5 |
| Service | 26 | 4.2 |
| Retired | 45 | 7.3 |
| Skilled worker | 45 | 7.3 |
| Unskilled worker | 3 | 0.5 |
| Home maker | 285 | 46.3 |
| Unemployed | 110 | 17.9 |
| Literacy status | ||
| Illiterate | 252 | 40.9 |
| Just literate | 59 | 9.6 |
| Primary | 99 | 16.1 |
| Middle | 61 | 9.9 |
| High school | 52 | 8.4 |
| Intermediate | 29 | 4.7 |
| Graduate | 43 | 7.0 |
| Post graduate | 21 | 3.4 |
| Socioeconomic status | ||
| Upper class | 42 | 6.8 |
| Upper middle | 156 | 25.3 |
| Lower middle | 160 | 26.0 |
| Upper lower | 217 | 35.2 |
| Lower class | 41 | 6.7 |
Factors Associated with Household Food Insecurity
Out of 616 households 31.8% were food secure whereas, 29.1%, 23.0%, and 16.1% households had mild, moderate and severe food insecurity, respectively. There existed no significant association of household food insecurity with age and gender of the subjects. Marital status, religion, caste, type of family, size of family, occupation, education and socioeconomic status of subjects were significantly associated with household food insecurity. As much as 36.4% married, 30.8% widower and 18.1% widowed subjects were from food secure houses (p<0.01); 33% Hindu and 26.2% Muslim subjects were food secure at household level. Out of 98 SC/ST subjects 49 (50.0%) had moderate/severe food insecurity at household level; corresponding value for subjects from OBC and other caste categories were 43.1% and 27.5%. There existed significant (p<0.05) difference in type and size of family of study subjects and household food insecurity. As much as 32.7%, 45.1% and 40.6% subjects from nuclear, joint and three generation families, respectively, had moderate/severe food insecurity at household level. Of the 173 subjects self employed or engaged in service or retired, 57 (32.9%) had food insecurity at household level as moderate/severe. This situation prevailed in 66.7% workers, 38.6% home makers and 38.2% unemployed subjects. Subjects belonging to educational categories illiterate plus just literate, primary plus middle, high school plus intermediate and graduate and above were 311, 160, 81 and 64, respectively. Extent of moderate and severe food insecurity at household level in respective educational categories were 48.6%, 41.9%, 24.7% and 4.7% (Table 2).
Out of 198 subjects belonging to upper and upper middle socio economic class on the basis of Kuppuswamy classification, 140 (70.7%) were from food secure houses. As much as 160 and 258 subjects were from lower middle and upper lower plus lower socioeconomic class. In case of 42 (26.2%) subjects from lower middle and 14 (5.4%) subjects from upper lower plus lower socioeconomic food security at household level was categorized as food secure. As much as 5 (2.5%), 41(25.6%) and 195 (75.6%) subjects belonging to upper plus upper middle, lower middle and upper lower plus lower socioeconomic class were from houses with moderate/severe food insecurity (Figure 1). Out of 209 subjects without morbidities 28.2% and 34.9% were from food secure and mild food insecure households, respectively; corresponding value for subjects from moderate and severe food insecure houses were 18.7% and 18.2%. In case of 330 (53.6%) subjects there was involvement of Activity of Daily Living. Of these 27.9%, 30.9%, 24.2% and 17.0% subjects were from food secure, mild food insecure and moderate and severe food insecure households, respectively. There existed significant association between depression status of subjects with their food insecurity status (Table 2).
Table 2: Association of Household Food Insecurity with Socio-Demographic Variables, Self Reported Morbidities, Functional Capacity and Depression Status of Subjects.
| Particulars (616) | Food secure | Mild food insecure | Moderate food insecure | Severe food insecure | Total | Test of significance | |||||||||||
| No. | (%) | No. | (%) | No. | (%) | No. | (%) | No. | (%) | ||||||||
| Marital status | |||||||||||||||||
| Married | 145 | 36.4 | 110 | 27.6 | 80 | 20.1 | 63 | 15.8 | 398 | 100 | χ2: 24.00 df: 6 p: <0.01 |
||||||
| Widower | 28 | 30.8 | 34 | 37.4 | 18 | 19.8 | 11 | 12.1 | 91 | 100 | |||||||
| Widowed | 23 | 18.1 | 35 | 27.6 | 44 | 34.6 | 25 | 19.7 | 127 | 100 | |||||||
| Religion | |||||||||||||||||
| Hindu | 168 | 33.0 | 158 | 31.0 | 127 | 25.0 | 56 | 11.0 | 509 | 100 | χ2: 56.71; df: 3 p:<0.01 |
||||||
| Muslim | 28 | 26.2 | 21 | 19.6 | 15 | 14.0 | 43 | 40.2 | 107 | 100 | |||||||
| Caste | |||||||||||||||||
| SC/ST | 16 | 16.3 | 33 | 33.7 | 30 | 30.6 | 19 | 19.4 | 98 | 100 | χ2:40.81 df: 6 p:<0.01 |
||||||
| OBC | 84 | 26.4 | 96 | 30.5 | 78 | 24.5 | 59 | 18.6 | 318 | 100 | |||||||
| Others | 95 | 48.0 | 49 | 25.5 | 34 | 17.0 | 21 | 10.5 | 200 | 100 | |||||||
| Type of Family | |||||||||||||||||
| Nuclear | 85 | 39.2 | 61 | 28.1 | 42 | 19.4 | 29 | 13.4 | 217 | 100 | χ2: 13.14 df: 6 p: <0.05 |
||||||
| Joint | 43 | 23.6 | 57 | 31.3 | 45 | 24.7 | 37 | 20.3 | 182 | 100 | |||||||
| Three generation | 68 | 31.3 | 61 | 28.1 | 55 | 25.3 | 33 | 15.2 | 217 | 100 | |||||||
| Size of family | |||||||||||||||||
| < 3 | 32 | 40.0 | 20 | 25.0 | 17 | 21.2 | 11 | 13.8 | 80 | 100 | χ2: 13.44 df: 6 p:<0.05 |
||||||
| 3-6 | 82 | 36.4 | 70 | 31.1 | 46 | 20.4 | 27 | 12.0 | 225 | 100 | |||||||
| > 6 | 82 | 26.4 | 89 | 28.6 | 79 | 25.4 | 61 | 19.6 | 311 | 100 | |||||||
| Occupational status | |||||||||||||||||
| Self Employed | 31 | 30.4 | 27 | 26.5 | 20 | 19.6 | 24 | 24.2 | 102 | 100 | χ2: 54.99 df: 18 p:<0.01 |
||||||
| Service | 13 | 50.0 | 4 | 15.4 | 7 | 26.9 | 2 | 7.7 | 26 | 100 | |||||||
| Retired | 25 | 55.6 | 16 | 35.6 | 3 | 6.7 | 1 | 2.2 | 45 | 100 | |||||||
| Skilled worker | 5 | 11.1 | 10 | 22.2 | 19 | 42.2 | 11 | 24.4 | 45 | 100 | |||||||
| Unskilled worker |
1 | 33.3 | 0 | 0 | 2 | 66.7 | 0 | 0 | 3 | 100 | |||||||
| Home maker | 94 | 33.0 | 81 | 28.4 | 69 | 24.2 | 41.4 | 14.4 | 285 | 100 | |||||||
| Unemployed | 27 | 24.5 | 41 | 37.3 | 22 | 20.0 | 20 | 18.2 | 110 | 100 | |||||||
| Literacy status | |||||||||||||||||
| Illiterate | 53 | 21.0 | 76 | 30.2 | 80 | 31.7 | 43 | 17.1 | 252 | 100 | χ2: 111.7 df: 21 p:<0.01 |
||||||
| Just literate | 16 | 27.1 | 15 | 25.4 | 6 | 10.2 | 22 | 37.3 | 59 | 100 | |||||||
| Primary | 26 | 26.3 | 29 | 29.3 | 27 | 27..3 | 17 | 17.2 | 99 | 100 | |||||||
| Middle | 18 | 29.5 | 20 | 32.8 | 13 | 21.3 | 10 | 16.4 | 61 | 100 | |||||||
| High school | 21 | 40.4 | 17 | 32.7 | 10 | 19.2 | 4 | 7.7 | 52 | 100 | |||||||
| Intermediate | 14 | 48.3 | 9 | 31.0 | 5 | 17.2 | 1 | 3.4 | 29 | 100 | |||||||
| Graduate | 30 | 69.8 | 10 | 23.2 | 1 | 2.3 | 2 | 4.7 | 43 | 100 | |||||||
| Post graduate | 18 | 85.7 | 3 | 14.3 | 0 | 0 | 0 | 0 | 21 | 100 | |||||||
| Socioeconomic class | |||||||||||||||||
| Upper class | 36 | 85.7 | 6 | 14.3 | 0 | 0 | 0 | 0 | 42 | 100 | χ2: 329 df: 12 p:<0.01 |
||||||
| Upper middle | 104 | 66.7 | 47 | 30.1 | 5 | 3.2 | 0 | 0 | 156 | 100 | |||||||
| Lower middle | 42 | 26.2 | 77 | 48.1 | 34 | 21.2 | 7 | 4.4 | 160 | 100 | |||||||
| Upper lower | 14 | 6.5 | 46 | 21.2 | 89 | 41.0 | 68 | 31.3 | 217 | 100 | |||||||
| Lower class | 0 | 0 | 3 | 7.3 | 14 | 34.1 | 24 | 58.5 | 41 | 100 | |||||||
| Self reported morbidities | |||||||||||||||||
| Without morbidities | 59 | 28.2 | 73 | 34.9 | 39 | 18.7 | 38 | 18.2 | 209 | 100 | χ2: 11.29 df: 6 p:>0.05 |
||||||
| With 1-2 morbidities | 73 | 31.5 | 62 | 26.7 | 57 | 24.6 | 40 | 17.2 | 232 | 100 | |||||||
| Multiple morbidities | 64 | 36.6 | 44 | 25.1 | 46 | 26.3 | 21 | 12.0 | 175 | 100 | |||||||
| Functional capacity (Activity of Daily Living) | |||||||||||||||||
| Without ADL involvement | 104 | 36.4 | 77 | 26.9 | 62 | 21.7 | 43 | 15.0 | 286 | 100 | χ2: 5.09 df: 3 p:>0.05 |
||||||
| With ADL involvement | 92 | 27.9 | 102 | 30.9 | 80 | 24.2 | 56 | 17.0 | 330 | 100 | |||||||
| Depression status | |||||||||||||||||
| Normal | 162 | 37.4 | 136 | 31.4 | 85 | 19.6 | 50 | 11.5 | 433 | 100 | χ2: 55.77 df: 6 p:<0.05 |
||||||
| Mild | 24 | 19.8 | 37 | 30.6 | 32 | 26.4 | 28 | 23.1 | 121 | 100 | |||||||
| Moderate/severe | 10 | 16.1 | 6 | 9.7 | 25 | 40.3 | 21 | 33.9 | 62 | 100 | |||||||
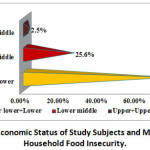 |
Figure 1: Socio Economic Status of Study Subjects and Moderate/Severe Household Food Insecurity. |
Predictors of Household Food Insecurity
All significant variables in univariate analysis were subjected to logistic regressionanalysis and result of the same for household food insecurity is given in table 3. The significant association of marital status, religion, type and size of family, occupation and literacy status with household food insecurity in univariate analysis got eliminated after applying logistic regression analysis. However, AOR more than one was observed for widowed (AOR 1.13; 95%CI 0.57-2.24) and Muslim subjects (AOR1.51 95%CI 0.74-3.05). This was 2.01 (95% CI: 0.74-5.44) and 1.28 (95%CI: 0.59-2.76) in subjects from joint and three generation families, respectively. In case of subjects having size of family > 6 and 3-6 AOR for household food insecurity was 2.27 (95% CI 0.74-7.03) and 1.14 (95%CI 0.49-2.66), respectively. This was 2.13 (95% CI 0.79-5.7) for skilled/unskilled workers. In comparison to other caste category AOR was significantly more for SC/ST (AOR: 2.13, 95%CI: 1-4.52).Taking upper plus upper middle plus lower middle as reference AOR for food insecurity in lower class was 24.87 (95% CI: 13.87-44.6).Except depressive status, self reported morbidities and functional capacity of subjects were not significantly associated with household food insecurity; insignificant variables were not put in the logistic model. When depression status was put in the logistic model (table 3), Adjusted Odds Ratio for household food insecurity was not significant (AOR 1.65; 95% CI: 0.89-3.06) for mild depression. However, AOR for moderate and severe depression was high (AOR 5.06; 95% CI: 2.02-12.66).
Table 3: Predictors of Household Food Insecurity.
| Particulars | Estimate of b | SE of b | P value | AOR | 95% CI | |
| Lower | Upper | |||||
| Marital status | ||||||
| Widower | 0.76 | 0.39 | 0.055 | 0.47 | 0.22 | 1.02 |
| Widowed | 0.12 | 0.35 | 0.730 | 1.13 | 0.57 | 2.24 |
| Married (Reference) | — | — | — | — | — | — |
| Religion | ||||||
| Muslim | 0.41 | 0.36 | 0.254 | 1.51 | 0.74 | 3.05 |
| Hindu (Reference) | — | — | — | — | — | — |
| Caste | ||||||
| SC/ ST | 0.76 | 0.38 | 0.049 | 2.13 | 1.00 | 4.52 |
| OBC | 0.33 | 0.29 | 0.266 | 1.39 | 0.78 | 2.49 |
| Others (Reference) | — | — | — | — | — | — |
| Type of Family | ||||||
| Joint | 0.69 | 0.51 | 0.171 | 2.01 | 0.74 | 5.44 |
| Three generation | 0.25 | 0.39 | 0.532 | 1.28 | 0.59 | 2.76 |
| Nuclear (Reference) | — | — | — | — | — | — |
| Size of family | ||||||
| >6 | 0.82 | 0.58 | 0.154 | 2.27 | 0.74 | 7.03 |
| 3-6 | 0.13 | 0.43 | 0.761 | 1.14 | 0.49 | 2.66 |
| <3 (Reference) | — | — | — | — | — | — |
| Occupation status | ||||||
| Skilled/Unskilled workers | 0.76 | 0.50 | 0.134 | 2.13 | 0.79 | 5.71 |
| Homemaker | 0.03 | 0.36 | 0.929 | 0.97 | 0.47 | 1.98 |
| Unemployed | 0.63 | 0.40 | 0.115 | 0.53 | 0.24 | 1.17 |
| Service + Retired +Self Employed (Reference) | — | — | — | — | — | — |
| Literacy status | ||||||
| Illiterate + Just literate | 0.21 | 0.53 | 0.693 | 0.81 | 0.28 | 2.31 |
| Primary+ Middle | 0.21 | 0.52 | 0.689 | 1.23 | 0.45 | 3.37 |
| High school & above | 0.63 | 0.59 | 0.289 | 1.88 | 0.59 | 5.99 |
| Intermediate + Graduate + PG (Reference) | — | — | — | — | — | — |
| Socioeconomic class | ||||||
| Lower | 3.21 | 0.29 | 0.000 | 24.87 | 13.87 | 44.61 |
| Upper lower | 3.87 | 0.59 | 0.000 | 0.02 | — | — |
| Upper+ Upper middle+ lower middle (Reference) | — | — | — | — | — | — |
| Depressive status | ||||||
| Mild | 0.50 | 0.32 | 0.111 | 1.65 | 0.89 | 3.06 |
| Moderate/severe | 1.62 | 0.47 | 0.001 | 5.06 | 2.02 | 12.66 |
| Normal (Reference) | — | — | — | — | — | — |
Factors Associated with Individual Food Insecurity
Out of 616 subjects energy inadequacy was prevalent in 72.9%. Thus individual food insecurity in subjects was to the extent of 72.9%. Gender, caste, type and size of family were not significantly (p>0.05) associated with individual food insecurity. There existed significant association (p<0.05) of individual food insecurity with age, marital status, religion, occupation, education and socioeconomic class of the study subjects (Table 4). Individual food insecurity was to the extent of 67.3%, 80.3% and 90.2% in 60-69, 70-79 and > 80 years age group subjects, respectively (p<0.01). Individual food insecurity prevailed in 68.3% married subjects; corresponding value for widower and widowed subjects were 75.8% and 85.0%, respectively (p<0.01). As much as 71.3% Hindu and 80.4% Muslim subjects had individual food insecurity (P<0.05). Individual food insecurity was maximum (75.5%) in SC/ST. This was76.4% in joint family and 75.6% in subjects having family size in the range of 3-6. Individual Food Insecurity was maximum (79.7%) in illiterate and just literate subjects and was least (54.7%) in subjects with educational status as graduation and above; corresponding value in subjects with literacy status primary plus middle and high school plus intermediate were 70.0% and 66.7%, respectively (p<0.01).As much as 64.7% subjects self employed plus in service plus retired had food insecurity; corresponding value for skilled and unskilled workers was 85.4%. Individual food insecurity prevailed in 75.4% homemakers and in 73.6% unemployed subjects (p<0.05). Food insecurity in subjects increased significantly (P<0.01) with declining socioeconomic class of subjects. This was least (57.1%) in upper class and maximum in lower class (90.2%).As much as 29.7%, 25.0% and 26.9% subjects having energy inadequacy had no morbidity, 1-2 morbidities and multiple morbidities, respectively. In subjects with individual food insecurity 29.4% were without involvement of ADL whereas 29.8%, 20.7% and 21.0% subjects were categorized as normal, with mild depression, and with moderate/severe depression, respectively (Table 4). There existed no significant (p>0.05) association of individual food insecurity of subjects with their self reported morbidities, functional status and depression.
Table 4: Association of Individual Food Insecurity with Socio-Demographic Parameters, Self Reported Morbidities, Functional Capacity and Depression Status of Subjects.
| Particulars(616) | Energy inadequacy | Energy adequacy | Total | Test of significance | |||
| No. | (%) | No. | (%) | No. | (%) | ||
| Age (Years) | |||||||
| 60-69 | 264 | 67.3 | 128 | 32.7 | 392 | 100 | χ2:18.69 df: 2 p:< 0.01 |
| 70-79 | 139 | 80.3 | 34 | 19.7 | 173 | 100 | |
| > 80 | 46 | 90.2 | 5 | 9.8 | 51 | 100 | |
| Marital status | |||||||
| Married | 272 | 68.3 | 126 | 31.7 | 398 | 100 | χ2: 14.05 df: 2 p:<0.01 |
| Widower | 69 | 75.8 | 22 | 24.2 | 91 | 100 | |
| Widowed | 108 | 85.0 | 19 | 15.0 | 127 | 100 | |
| Religion | |||||||
| Hindu | 363 | 71.3 | 146 | 28.7 | 509 | 100 | χ2: 3.67 df: 1 p:<0.05 |
| Muslim | 86 | 80.4 | 21 | 19.6 | 107 | 100 | |
| Occupational Status | |||||||
| Self Employed + Service +Retired | 112 | 64.7 | 61 | 35.3 | 173 | 100 | χ2:10.595 df: 3 p: <0.05 |
| Skilled+ Unskilled worker | 41 | 85.4 | 7 | 14.6 | 48 | 100 | |
| Home makers | 215 | 75.4 | 70 | 24.6 | 285 | 100 | |
| Unemployed | 81 | 73.6 | 29 | 26.4 | 110 | 100 | |
| Educational Status | |||||||
| Illiterate +Just literate | 248 | 79.7 | 63 | 20.3 | 311 | 100 | χ2:20.39 df: 3 p: <0.01 |
| Primary + Middle | 112 | 70.0 | 48 | 30.0 | 160 | 100 | |
| High School+ Intermediate | 54 | 66.7 | 27 | 33.3 | 81 | 100 | |
| Graduate &above | 35 | 54.7 | 29 | 45.3 | 64 | 100 | |
| Socioeconomic Class | |||||||
| Upper class | 24 | 57.1 | 18 | 42.9 | 42 | 100 | χ2: 24.77 df: 4 p:<0.01 |
| Upper middle | 102 | 65.4 | 54 | 34.6 | 156 | 100 | |
| Lower middle | 110 | 68.8 | 50 | 31.2 | 160 | 100 | |
| Upper lower | 176 | 81.1 | 41 | 18.9 | 217 | 100 | |
| Lower class | 37 | 90.2 | 4 | 9.8 | 41 | 100 | |
| Self-reported Morbidities | |||||||
| Without morbidity | 62 | 29.7 | 147 | 70.3 | 209 | 100 | χ2: 1.22 df: 2 p:> 0.05 |
| With 1-2 morbidities | 58 | 25.0 | 174 | 75.0 | 232 | 100 | |
| Multiple morbidities | 47 | 26.9 | 128 | 73.1 | 175 | 100 | |
| Functional Capacity (Activity of Daily Living) | |||||||
| Without ADL | 202 | 29.4 | 84 | 70.6 | 286 | 100 | χ2: 1.38 df: 1 p:>0.05 |
| q | 247 | 74.8 | 83 | 25.2 | 330 | 100 | |
| Depression Status | |||||||
| Normal | 129 | 29.8 | 304 | 70.2 | 433 | 100 | χ2: 5.31 df: 2 p:>0.05 |
| Mild | 25 | 20.7 | 96 | 79.3 | 121 | 100 | |
| Moderate/severe | 13 | 21.0 | 49 | 79.0 | 62 | 100 | |
Predictors of Individual Food Insecurity
Of several significant socio demographic variables in univariate analysis none was found significant in logistic model. However, higher AORs were observed for > 80 years (AOR1.80; 95%CI: 0.60-5.42) and 70-79 years (AOR 1.42; 95%CI: 0.85-2.37) age groups; widower (AOR 1.44; 95%CI: 0.76-2.74) and Muslim religion (AOR 1.15; 95% CI: 0.60-2.19). Subjects having literacy status as illiterate plus just literate and high school plus intermediate AOR for individual food insecurity was 1.01 (95%CI: 0.4-2.43) and 1.14 (95% CI: 0.50-2.62), respectively. In case of occupation higher AORs viz., 2.08 (95% CI: 0.74-5.81) and 1.45 (95% CI: 0.8-2.58) was observed for skilled/unskilled workers and home makers, respectively. AOR for individual food insecurity in lower, upper lower, lower middle and upper middle categories were 3.58 (95% CI: 0.74-17.35), 1.59 (95% CI: 0.54-4.73), 1.10 (95% CI: 0.42-2.91) and 1.08 (95% CI: 0.46-2.53), respectively. Other insignificant variables (viz., self reported morbidities, depression and functional status) with individual food insecurity in univariate analysis were not put in logistic model.
Inter-linkage between Household and Individual Food Insecurity
In order to find out association between household and individual food insecurity energy intake at household level was computed by 24 hour recall oral questionnaire method and a household intake of > 2100 Kcal per Consumption Unit (PCU) was considered as adequate. Same procedure was adopted for computing energy intake of geriatric subjects and a subject was considered as food secure when percentage intake of energy with respect to RDA was > 100%. Using this criterion 284 (46.1%) subjects had food security at household level whereas 332 (53.9%) subjects had food insecurity at household level. Out of 332 subjects with household food insecurity, 268 (80.7%) and 64 (19.3%) had food insecurity and security at individual level, respectively. As much as 63.7% and 36.7% subjects had inadequate and adequate energy intake at individual level. Out of 284 subjects having energy adequacy at family level only 103 (36.3%) had energy adequacy at individual level whereas 181 (63.7%) had energy inadequacy at individual level. There existed significant (p<0.01) association between energy intake at family and individual level (Table 5).
Table 5: Household vis a vis Individual Food Insecurity.
| Energy adequacy at individual level (RDA) | Energy adequacy at family level | |||||
| Inadequate | Adequate | Total | ||||
| N | % | N | % | N | % | |
| Inadequate | 268 | 80.7 | 181 | 63.7 | 449 | 72.9 |
| Adequate | 64 | 19.3 | 103 | 36.3 | 167 | 27.1 |
| Total | 332 | 100.0 | 284 | 100.0 | 616 | 100 |
| Test of significance | χ2:22.36; df: 1; P<0.01 | |||||
Discussion
In this study ratio wise out of ten subjects six and three were from age group 60-69 and 70-79 years, respectively. Similar findings have been also reported by a study conducted in Nagpur city, Maharashtra, Central India18.The proportion of female was more than male subjects. In conformity with the finding of this study several workers have also reported higher proportion of female subjects19-21. Widowhood has been a serious problem in geriatric subjects; nearly seven out of twenty subjects were either widowed or widower. In comparison to this study other workers have reported higher widowhood in geriatric subjects22-24. Seven out of twenty subjects were from nuclear family. Nearly eight out of ten female subjects were homemaker. Half of the subjects were from OBC. Four out of ten subjects were illiterate; nearly same proportion of subjects belonged to upper lower plus lower class.
The increased life expectancy of female than male in later life has forced them to live life without their spouse thereby they have to face many problems including food insecurity. Widowhood plays a significant effect on household food insecurity; this is substantiated by findings of the present study as well. Three out of ten widower and eleven out of twenty widowed subjects, respectively, had moderate/severe food insecurity at household level. In this study household food insecurity was more in Muslim religion. In contrast to this more household food insecurity in Hindu religion was reported in a study conducted in Mangalore, South India25.Food insecurity can trap any caste category. However, subjects belonging to backward categories are more vulnerable than others. This is substantiated by findings of the present study. Half of the subjects from Scheduled Caste/Scheduled Tribes had moderate/severe food insecurity at household level against eleven out of forty in other caste category.
Type and size of family is intimately linked with the household food security. Moderate/severe food insecurity at household level prevailed in 9 out of 20 subjects from joint families, whereas this form of food insecurity was less in nuclear (three out of ten) and three generation (four out of ten) families. Food insecure households had large family size compared to food secure households; similar finding has been reported in studies conducted in North West of Iran26and Peninsular, Malaysia27. Nearly four out of ten homemakers and unemployed subjects were from moderate/severe food insecure houses. This prevailing situation could be due to their dependency on other family members and no involvement in any gainful employment. Literacy status of females influences household food security status. Adversities of food security at household level under prevailing situation have been substantiated by a study in Lucknow city, India28.
Significant association of socioeconomic class with household food security has been corroborated by several studies conducted within India25, 29, 30.Astudy conducted in Mumbai, West India also reported lower monthly household income; lower rank in Standard of Living Index (SLI) and less percapita expenses on food items as significant influencers of household food insecurity31.
Caste has emerged as one of the predictor of household food insecurity in this study. Higher AORs for household food insecurity in subjects of this study from SC caste category is also substantiated by finding of a study conducted on elderly subjects of United States where minority status was a significant predictor of household food insecurity32. This study has identified socioeconomic class as predictor of household food security in the logistic model which is consistent with findings of several workers28, 32, 33.
Unemployment has been also identified as predictor of experienced household food insecurity by findings of the study from North India33. Although, educational status in general and food handling female of households in particular have been identified as predictor of household food insecurity28,32in the present study educational status has not significantly influenced household food insecurity in the logistic model. Young age participation in food assistance program and social isolation also predicted household food insecurity32.As per this study household food insecurity was neither influenced by functional capacity in terms of ADL involvement of subjects nor by their morbidity status. Similar situation prevailed for mild depression as well. Only moderate/ severe depression status correlated with household food insecurity in logistic regression analysis. However, 1 out of 10 subjects was with moderate/ severe depression.
Energy adequacy in any age group plays a significant role for maintaining nutritional status. Energy consumption by individuals decides the overall nutritional status of the person in terms of under and over nutrition and this has been widely used as indicator for assessment of food insecurity status. Food energy shortfall is an input indicator of overall food security15. For assessing nutritional security adequacy of protein and micronutrients has to be taken into account. There have been wide variations in the consumption of micronutrients by geriatric subjects. From statistical point of view this will not produce correct information. In this study primary interest of researchers was on food security rather than nutrition security.
Food insecurity at individual level has been influenced by many factors. Nearly seven out of ten subjects in age group 60-69 years had food insecurity and it was nine out of ten in geriatric subjects from > 80 years age group; with prolonged ageing, besides several invited physiological changes, dependency on other family members also increases the risk of food insecurity in geriatric subjects. According to a study conducted in Nagpur city, India age of elderly males correlated negatively and significantly associated with energy intake whereas this was not in case for elderly female34-36.It is understandable that geriatric subjects experiencing widowhood are not only financially deprived but also may fail to take adequate quantity of food due to lack of social support or inability to cook food for themselves. There existed significant association between educational status of subjects and their food security status; this has been substantiated by a study conducted in South India. Poor economic background has been reported to be responsible for energy inadequacy in elderly population37. The well educated and economically independent elderly might be able to purchase varied food stuffs which enhances their dietary diversity and thereby their health. Breaking down joint family system is responsible for energy inadequacy in geriatric subjects37. Findings of the present study have not substantiated potential role of depression, morbidity and ADL involvement in food insecurity status of geriatric subjects.
Although several studies have focused to elucidate the experiences of families struggling to cope with the problem of hunger and food insecurity now there is need to shift or throw light on the complex issue of intra household allocation of food particularly in elderly individuals. For elderly the availability of family members is extremely important in preventing or lessening food insecurity but it also cannot be denied that elderly relied on family members to cook for them and even bring them food or meals periodically; this dependency sometimes make them vulnerable to experience food insecurity38. Findings of the present study indicated an apparent disparity of allocation of food as reflected in energy adequacy status in urban setting households and individual elderly living in those houses. It also pin pointed that the availability of food at household level does not ensure food security at individual level in terms of energy adequacy. Findings of this study highlighted the precarious situation of geriatric subjects in terms of food security. Understanding reason of disparity and mitigate this problem requires sustainable approach. There is also a need to include all dimensions that relate to food insecurity scenarios in geriatric subjects of urban areas.
Conclusion
Subjects belonging to SC/ST and OBC and from upper lower and lower socioeconomic class had higher odds of household food insecurity. Age, marital status, religion, occupational status, educational status and socioeconomic class were the significant associates of individual food insecurity. The problem of interfamilial distribution of food for geriatric subjects prevailed in the study area; energy adequacy at family level did not ensure energy adequacy in geriatric subjects
Acknowledgment
Authors sincerely acknowledge contributions of the participants of the study.
Conflict of Interest
The authors do not have any conflict of interest.
Funding Source
The author(s) received no financial support for the research, authorship, and/or publication of this article.
References
- https://m.wfp.org/content/global-report-food-crises2018 Last accessed on 4/05/2019.
- The state of food security and nutrition in the world building climate resilience for food security and Nutrition https://data.unicef.org/resources/sofi-2018 Last accessed on 4/04/2019.
- Keshari P., Shankar H. Strategic gaps in provision of universal nutrition security: Indian perspective. International Journal of food and 2016; 5 (1):56-65.
- United Nations in India. in.one.un.org/un-priority-areas-in-india/nutrition-andfood-security/#top last accessed on 5/04/2019.
- Anderson S.A. Core indicator of nutritional status for difficult to sample populations. J Nutr 1990; 120: 1559-1600.
CrossRef - Food and Agriculture Organization. The Food security and Nutritional Impacts of Urbanization and Rural Transformation on Lower Income Groups. 2018 available at: http://www.fao.org/cfs/home/events/rururb19nov/en/ Last accessed on 23-08-2020.
- Registrar General and Census Commission of India, Census of India. (2011), Ministry of Home Affair, Government of India. Available at: http://www.censusindia.gov.in. [Last accessed on 2014 Nov 14].
- Pandey M.K. Poverty and disability among Indian Elderly: Evidence from Household Survey. ASARC Working Paper 2009/09: 1-19.
- Kohli C., Kishore J., Kumar N. Kuppuswamy’s Socioeconomic Scale-Update for July 2015. Int.J.Preven.Curat.Comm.Med.2015;1(2):26-28.
- Coates J., Swindale A., Bilinsky P.Household Food Insecurity Access Scale (HFIAS) for measurement of food access: indicator guide. Version 3-Washigton, DC: Food and Nutrition Technical Assistance (FANTA) project, 2007: 1-29 (fhi 360). www.fao.org/fileadmin/user-upload/eufao-fsi4dm/doc-training/hfias.pdf.
CrossRef - Dietary Guidelines for Indians A Manual. National Institute of Nutrition, Indian Council of Medical Research Hyderabad-500007,India.2011;1-139. http://ninindia.org/Dietary GuidelinesforNINwebsite.pdf. [Last accessed on July 15, 2017]
- Longvah T, Ananthan R, Bhaskarachary K, Venkaiah K. Indian Food Composition Tables. National Institute of Nutrition. Indian Council of Medical Research Hyderabad-500007, Telangana state, India. 2017.
- A presentation document entitled: New approaches to the measurement of food security. Statistics Division Food and Agriculture Organization of the United Nations AFCAS, 23, 2013. http://www.fao.org/fileadmin/templates/ess/documents/afcas23/Presentations/AFCAS
_9d_New_approaches_to_the_measurement_of_food_security.pdf - Suite of Food Security Indicators Statistics: Division Food and Agriculture Organization of the United Nations http://www.fao.org/faostat/en/#data/FS
- Vhurumuku E. Food Security Indicators, for the integrating nutrition and food security programming for emergency response workshop 25 to 17 February, 2014.
- Mahoney F. Barthel D. Functional Evaluation: The Barthel Indax. Maryland state medical journal. 1965; 14: 61-65.
CrossRef - Kakrani VA. Desale AV, Mehta CP. Geriatric Depression Scale (GDS): A tool for assessment of depression in elderly. Journal of krishna institute of medical Sciences University. 2015; 4(3):24-31.
- Kimaya R., and Sharma R. Macronutrient status of the elderly (60-80 years) from central India. African Journal of Food, Agriculture, Nutrition and Development.2013; 13(2):1-23.
- Anand A. understanding depression among older adults in six low middle income countries using WHO-SAGE survey. Behavioral health 2014; 1 (2): 1-11.
- Goyal A., Kajal K. prevalence of depression in elderly population in the Southern part of Punjab. J Family Med. Prim Care. 2014; 3 (4): 359-361.
CrossRef - Saikia A.M., Mahanta N., Saikia A.M., Deka H., Boruah B., Mahanta R. Depression in elderly: a community based study from Assam. Indian Journal of Basic and Applied Medical Research. 2016; 5 (4): 42-48.
- Sundrumb M.B., Goru K.B.G., Krishnaveni A. Epidemiological study of depression among population above 60 years in Visakhapatnam, India. International journal of medical sciences and public health. 2013; 2 (3): 695-702.
CrossRef - Sanjay T.V., Jahnavi R., Gangaboraiah B., Lakshmi P., Jayanthi S. Prevalence and factors influencing depression among eldely living in the urban poor locality of Bengaluru city. International journal of health and allied sciences. 2014; 3 (2):105-109.
CrossRef - Sharma S., Thakur M., Kaur S. Assessment of functional status in the performance of activities of daily living amongst elderly in sub urban population of India. International Journal of Nursing Education.2012; 4: 94-96.
- Krishna N.K., Kundapur R., Kiran N.U., Badiger S. Food security and nutrition consumption among households in the semi urban field practice area of KS Hegde Medical academy, Mangalore: Pilot study. NUJHS 2015; 15 (2): 31-37.
- Rahim S., Saeed D., Rashool G.A., Saeed G. Factors influencing household food security status. Food and Nutrition Sciences.2011; 2:31-34.
CrossRef - Su Pei C., Appannah G., Sulaiman N. Household food insecurity, diet quality and weight status among indigenous women (Mah Meri) in Penisular Malaysia. Nutrition Research and Practice 2018; 12 (2):135-142.
CrossRef - Chinnakali P., Upadhyay R.P., Shokeen D., Singh K., Kaur M., Singh A.K. et al. Prevalence of household level food insecurity and its determinants in an urban resettlement colony in North India. J Health Popul Nutr2014; 32 (2): 227-236.
- Gopichandran V., Claudius P., Baby L.S., Felinda A., Mohan V.R. Household food security in urban Tamil Nadu: A survey in Vellore: The National Medical Journal of India 2010; 23(5): 278-280.
- Nnakwe N., Yegammia C. Prevalence of food insecurity among households with children in Coimbatore, India. Nutrition 2002; 22: 1009–1016.
CrossRef - Chatterjee N., Fernandes G., Hernandez M. Food insecurity in urban household in Mumbai India. Food Sec. Springer Sciences 2012. DOI 10.1007/12571-012-0206-z.
CrossRef - Lee J.S., Frongillo E.A. Factors associated with food insecurity among US elderly persons: importance of functional impairments. J Gerontol Soc Sci 2001; 56(2):94-9.
CrossRef - Agrawal S., Sethi V., Gupta P., Jha M., Agnihotri A., Nord M. Experiential household food insecurity in an urban underserved slum of North India. Food Sec2009; I: 239-50.
CrossRef - Baweja S., Agarwal H., Mathur A. Assessment of nutritional status and related factors in community dwelling elderly in western Rajasthan. J. Indian Acad. Geriatr.2008; 1: 5-13.
- Rajhans K., Sharms R. Relationship between socio-economic status and energy intake of elderly from central India. Journal of the Indian Academy of Geriatrics.2011; 7:167-174.
- Shahar D., Shai I., Vardi H., Fraser D. Dietary intake and eating patterns of elderly people in Israel: Who is at nutritional risk? European journal of Clinical Nutrition.2003; 57: 18-25.
CrossRef - Natrajan S., Ravidran S., Sivashanmugam, Thyagarajan, Kailash K., Krishnaswamy B., Suresh B., Prabhu P. Assessment of nutrient intake and associated factors in an elderly population. Age and Ageing.1993; 22:103-108.
CrossRef - Wendy S., Wolfe, Chritine M. Olson, Kendall A., Edward A., Frongillo J.R. Understanding food insecurity in the elderly: A conceptual framework. Journal of nutrition education 1996; 28(2): 92-100.
CrossRef
Accepted on: 31 May 2021
Second Review by: Mulono Apriyanto Indonesia
Final Approval by: Dr. Nikhil Kumar Mahnot


Web of Science Coverage
Emerging Sources Citation Index (ESCI)
2024 Journal Impact Factor: 1.1
Scopus Journal Metrics
CiteScore 2025: 2.6
CiteScore Details
Sustainable Nutrition: Food Systems, Nutrient Retention, and Public Health Impact
![]()
This journal is a member of, and subscribes to the principles of, the Committee on Publication Ethics (COPE)


