Ethanol Extracts of Ficus carica Fruit and Leaf Normalize High Serum Lipid Profile, TNF-α, and MDA due to High Fat Diet in Sprague Dawley Rat
Yhani Kartika Sukowati1
, , , 4* 1Department of Nutrition, Master Programme in Nutrition Science, Faculty of Medicine, Diponegoro University, Prof. Soedarto Semarang, Indonesia.
2Department of Animal Sciences, Laboratory of Physiology and Biochemistry, Faculty of Animal and Agricultural Sciences, Diponegoro University, Semarang, Diponegoro University, Semarang, Indonesia.
3Faculty of Medicine, Diponegoro University, Semarang, Diponegoro University, Semarang, Indonesia.
4Natural Product Laboratory, Integrated laboratory for Research and Services, Diponegoro University, Semarang, Indonesia.
Corresponding Author Email: rmurwani.undip@gmail.com
DOI : http://dx.doi.org/10.12944/CRNFSJ.7.3.16
Download this article as:
![]()
Dyslipidemia is one of the main risk factors for cardiovascular disease (CVD). Ficus carica fruit and leaf contain polyphenolic compounds that can inhibit lipid peroxidation. Our research aimed to study the effect of ethanol extract of F. carica fruit (FcFrEx) and F. carica leaves ( FcLfEx ) on serum lipid (total cholesterol, LDLchol, HDLchol, Triglyceride (TG)), TNF-α, and MDA levels in rat fed a high-fat diet. This experiment was a randomized control group design with pre and post-test using 32 male Sprague Dawley rats. The animals were divided randomly into 4 groups: control diet ( C ), high-fat diet ( HF ), high-fat diet plus FcFrEx ( HF+FcFrEx ), and high-fat diet plus FcLfEx (HF + FcLfEx). The high-fat diet was given to HF, HF+FcFrEx, and HF+FcLfEx groups for 7 weeks and then FcFrEx and FcLfEx at 400mg/kg BW were given to HF+FcFrEx and FcLfEx groups respectively for 3 weeks. Data for each group at the end of 7 weeks feeding (pre-test) and the end of the experiment i.e 10 weeks (post-test) were analyzed using the paired t-test. Data among groups were analyzed by one-way ANOVA followed by LSD test. The results showed that FcFrEx and FcLfEx at 400mg/kg BW can reduce serum lipid, TNF-α, and MDA levels. In conclusion, both FcFrEx and FcLfEx can ameliorate dyslipidemia and oxidative stress due to a high-fat diet in Sprague Dawley rat.
KEYWORDS:Cardiac; Endothelial Dysfunction; Indonesia; Inflammation; Lipid Peroxidation; Oxidative Stress; Tin
Introduction
A diet called Western pattern diet (WPD) is characterized by a high intake of red meat, processed meat, pre-packed foods, butter, fried foods, potatoes, high-fructose corn syrup, and high-fat dairy products.1 This dietary pattern is widespread in some Asian countries including Indonesia and it can result in dyslipidemia.2 Dyslipidemia is characterized by abnormal levels of serum lipids with serum total cholesterol > 200 mg/dl, triglyceride > 150 mg/dl, LDLchol > 160 mg/dl, HDLchol < 40 mg/dl for males and < 50 mg/dl for females.3 Dyslipidemia is one of the main risk factors for cardiovascular disease (CVD) which is the major cause of death in the world.4 In 2016, 17.9 million people died from CVD, representing 31% of all global deaths.5
Dyslipidemia can lead to endothelial dysfunction where LDLchol particles can easily enter into an arterial wall and trapped inside sub-intimal through apolipoprotein B100. Trapped LDLchol particles can be damaged by free radicals and undergo oxidation.6 In addition, monocytes could penetrate arterial wall7 and release granulocyte and macrophages colony-stimulating factor (G-CSF dan M-CSF) in response to inflammation.6 Inflammation transforms monocyte into a macrophage.7 Macrophages combine lipoprotein such as beta-low density lipoprotein (βVLDL), acetylated low-density lipoprotein (AcLDL), and oxidized low-density lipoprotein (OxLDL) through a scavenger receptor (SR) on their surface.8 The combined lipoprotein is brought into liposomes to be hydrolized to free cholesterol and transported to endoplasmic reticulum to be re-esterified by acyl-CoA: cholesterol acyltransferase-1 (ACAT1). Esterified cholesterol is stored as a lipid-laden droplet causing macrophages to appear as foam and called foam cells.8,9 Foam cells further produce proinflammatory cytokines such as interleukin (IL-1, IL-6), and Tumor Necrosis Factor-alpha (TNF-α). Increase proinflammatory cytokines can stimulate oxidative stress by increasing reactive oxygen species (ROS) which will attack polyunsaturated fatty acids (PUFAs) causing lipid peroxidation.10,11 Lipid peroxidation produces lipid hydroperoxide which can be converted into malondialdehyde (MDA), 4-hydroxy-2-nonenal (4-HNE), and some other forms of aldehydes.12 Therefore, dyslipidemia induces production of proinflammatory cytokine TNF-α and biomarker of oxidative stress i.e. MDA.
Common fig (Ficus carica) plant, woody tree are cultivated for its edible fruit, and historically found in Northern Meditteranean countries such as Mecca, Syam, Palestine, and Egypt.13 This plant has been grown widely in European countries, Australian continent, even in Indonesia. F. carica fruit and F. carica leaves are well known for its high polyphenol contents as high as 49 mg/100 g and 32 mg/100 g respectively.14 Polyphenolic compounds are strong antioxidant15 and it is expected to prevent or reduce oxidative stress and inflammatory cytokine production which can be induced by dyslipidemia due to a high fat diet. Although some studies have shown that F. carica fruit or leaf administered orally can reduce serum lipid profile,16,17 there has been no study of its effect on serum inflammatory cytokine TNF-α and oxidative biomarker MDA in rats fed a high fat diet. Therefore, we study the effect of administration of FcFrEx and FcLfEx in high-fat diet on serum lipid, TNF-α, and MDA in Sprague Dawley rats.
Research Methods
This research had been approved by the Health Research Ethics Commission of the Faculty of Medicine, Diponegoro University-RSUP.Dr. Kariadi Semarang with No. 86 / EC / H / FK-RSDK / VII / 2018.
Materials
Ficus carica fruits and F. carica leaves were obtained from Tin plantation (Syava Garden) located in Barukan, Tengaran Village, Salatiga district, Central Java. Extraction of the fruits and leaves were carried out by maceration method using 96% ethanol (Merck). Serum TNF-α and MDA were determined using the Elisa kit (Bioassay, Shanghai, China). The extraction of FcF and FcL and determination of phenols in the extracts were carried out in certified laboratories, at Diponegoro University-Integrated Laboratory for Research and Services, Semarang. In vivo rat experiment was carried out at Animal Laboratory, Faculty of Medicine, Diponegoro University, Semarang.
Extraction of F. carica fruits and leaves18
The fruits and leaves were sun-dried approximately for 3 days. Each of the dried materials was homogenized in 96% ethanol (Merck) using a blender. The sample was placed in beaker glasses with aluminium foils cover, soaked in ethanol for 24 hours and mixed in a shaker at 150 rpm. The samples were filtered using 125 mm Whatman filter, and the filtrate was dried at 500C in oven for 3 days.
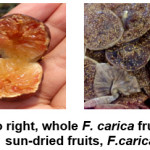 |
Figure 1: From left to right, whole F. carica fruit, the fruit cut open, sun-dried fruits, F.carica leaves Click here to View figure |
Determination of Total Polyphenol Content15, 19,20
Total Polyphenol content (TP) was determined using the Folin-Ciocalteau assay. In short, 0.1 mL of FcF extraction diluted to 0.5 mL using distilled water. Then, 0.1 mL of Folin-Ciocalteau was added and mixed by shaking on a water bath for 5 min. After 5 min reaction, 0,2 mL Na2CO3 was added and the total volume of the reaction mixture was made to 2 mL by adding distilled water and incubated at room temperature for 2 hours. The total phenol was read at 760 nm. The same step was carried out to FcL extraction. Tannic acid was used to generate a standard curve. Polyphenol contents were expressed as grams of Tannic Acid Equivalent (TAE) 100 g-1 dry weight.
High-Fat Diet
We formulated our own high-fat diet by mixing a laboratory rat diet (CP-594 which contains 77.5-79.5% carbohydrate, 17.5-19.5% protein, and 3% fat); with wheat flour, coconut oil, beef tallow, cholesterol powder (Merck), cholic acid (Merck), and water until homogeneous. The mixture is formed into pellets and the pellets were dried in an oven. The pellet of high-fat diet contains 30% fat, 55% carbohydrate, 12% protein, 2% cholesterol, 0,1% cholic acid.21
In vivo Experimental Design
Thirty-two male 2 months old Sprague Dawley rats with body weight of 170-190 grams, were obtained from Test Animal Farm, UD. Tiput Abadi Jaya, Yogyakarta. Rats were kept in a laboratory with temperature 24±20C and 40±5% humidity, 12 hours dark and light, with ad–libitum normal feed and free access of drinking water. After 7 days of acclimatization, rats were divided into 4 groups: control diet group (C), high fat diet group (HF), high fat diet + 400 mg/kg BW of ethanol extract of F. carica fruits (HF+FcFrEx), and high fat diet + 400mg/kg BW ethanol extract of F. carica leaves (HF+FcLfEx). The high-fat diet was given 18 g/day to HF, HF+FcFrEx, and HF+FcLfEx groups for 7 weeks. At the end of 7 weeks of feeding, a 3 mL of overnight fasting blood was sampled via retro-orbital plexus to obtain pre-test data. Then, HF+FcFrEx and HF+FcLfEx groups were given the extracts for 3 weeks followed by overnight blood sampling to obtain post-test data. Blood samples were centrifuged at 4000 rpm for 15 minutes to obtain the serum. The serum was stored frozen until analyses. Body weight and feed intake were recorded weekly.
Total Cholesterol determination 22
Total Cholesterol was determined by colorimetry enzymatic cholesterol p-aminophenazone cholesterol method (CHOD-PAP, DiaSys). A serum of 0.01 mL plus 1 mL cholesterol reagent solution was homogenized using vortex and left for 20 minutes at room temperature. The absorbance of the mixture was measured at 500 nm against the blank (1 mL cholesterol reagent and 0.01 mL distilled water). For standard, the serum is replaced by cholesterol standards.
HDL determination 22
HDL determination was started by precipitating chylomicron, VLDL cholesterol, and LDL cholesterol. 0.02 mL serum was added with 0.5 mL of sediment solution. Then the solution was centrifuged for 20 minutes at 4500 rpm. The supernatant of 0.01 ml, was added with 1 mL cholesterol reagent. Clear supernatants were separated and HDL cholesterol was tested using the CHOD-PAP (DiaSys) method with the same procedure of total cholesterol. The sample absorbance was read at 500 nm against the blanks (1 mL cholesterol reagent and 0.01 mL distilled water).
LDL determination23
LDL cholesterol levels were determined according to Friedwald formula:
LDL levels = total cholesterol level – HDL levels – (TG/5).
Triglyceride (TG) determination 22,24
Triglyceride determination using GPO-PAP (DiaSys) was done by adding 1 mL TG reagent into 0.01 mL serum, homogenized using vortex and incubated for 20 minutes at room temperature. The reagents consisted of buffers pH 7.2, 4-chlorophenol, ATP, Mg 2+, glycerocination, peroxidase, lipoprotein lipase, 4-aminiantipirin, and glycerol 3-phosphate-oxidase. As blanks, 1 mL of TG reagent was added with 0.01 mL distilled water. The mixture absorbance was measured at 500 nm against the blank.
Serum TNF-α determination
Serum TNF-α determination was carried out using ELISA-kit according to manufacturer instructions (Bioassay, Shanghai, China). The standard TNF-α of 50μl and 40 μl serum of each sample was transferred into a 96 well plates.To the standard and sample wells, 10 μl anti-TNF-α antibody, 50 μl streptavidin-HRP were added. The plates were covered with a sealer and incubated for 1 hour at 370C. After incubation, the plates were rinsed 5 times with wash buffer where the wells were soaked with 0.35 mL wash buffer for at least 1 minute for each wash. Next, 50 μl of each solution A and B were added to each well and incubated again for 10 minutes at 37 0 C in dark. Finally, 50μl of stop solution was added into each well and incubated for another 30 minutes. The initial color blue will turn into yellow. The absorbance of samples in 96 well plates was read by ELISA Reader at 450 nm.
Serum MDA determination
Serum MDA determination was carried out usingELISA-kit according to manufacturer instructions (Bioassay, Shanghai, China). The standard TNF-α of 50μl and 40 μl serum of each sample was transferred into a 96 well plates.To the standard and sample wells, 10 μl anti-MDA antibody, 50 μl streptavidin-HRP were added. The plates were covered with a sealer and incubated for 1 hour at 370C. After incubation, the plates were rinsed 5 times with wash buffer where the wells were soaked with 0.35 mL wash buffer for at least 1 minute for each wash. Next, 50 μl of each solution A and B were added to each well. The plates were incubated again for 10 minutes at 37 0 C in dark. Finally, 50μl of stop solution was added into each well and incubated for another 30 minutes. The initial color blue will turn into yellow. The absorbance of samples in 96 well plates was read by ELISA Reader 450 nm.
Data Analyses
All data are presented as mean ± SD, where group of control n=7, HF n=6, HF+FcFrEx n=8 and HF+FcLfEx n=8. The lower number of data in control and HF group were due to exclusion (not fit, sick, etc). The data were analyzed for normality using the Shapiro-Wilk test (p<0,05). Paired T-test was used to determine the difference between pre and post-test data. To determine the difference among groups the means were analyzed by One Way ANOVA. When there is a significant difference post hoc Least Significant Difference (LSD) was done (p<0.05). Statistical analysis was carried out using SPSS 21.
Results and Discussion
Rat Body Weight and Food Intake
In each group, there was a significant increase in body weight and food intake (Table 1) before and after treatment. However, this increase was not significantly different among groups (p>0.05). It indicated that in spite of a difference in energy content of high fat diet compared to control diet, food intake was not affected. Our result was similar to Levin et al., (2003) who also found no difference in body weight gain between an obese rat with a low-fat diet compared to non-obese rat with a high-fat diet which could be related to genetic factors affecting obesity. 25
Table 1: Body Weight and Food Intake of Sprague Dawley rats given High Fat diet for 7 weeks and ethanol extract of F. carica fruits and leaves for three weeks.
|
Group |
Body Weight (g) | Δ Mean ± SD | P | ||||||
| Pre Mean ± SD | Post Mean ± SD | ||||||||
| C | 215.2 ±17.53 | 233.0 ± 17.77 | 17.8 ± 4.99 | 0.000* | |||||
| HF | 196.8 ± 27.34 | 214.1± 32.96 | 17.3 ± 6.90 | 0.002* | |||||
| HF+FcFrEx | 204.7 ± 21.13 | 227.1 ± 16.86 | 22.4 ± 9.34 | 0.005* | |||||
| HF+FcLfEx | 206.2 ± 26.53 | 227.2 ± 28.66 | 21.1 ± 6.77 | 0.001* | |||||
| p | 0.495 | ||||||||
| Group | Food Intake (g) | Δ Mean ± SD | P | ||||||
| Pre Mean ± SD | Post Mean ± SD | ||||||||
| C | 15.2 ± 0.94 | 16.3 ± 0.22 | 1.1 ± 0.98 | 0.025* | |||||
| HF | 12.4 ± 2.49 | 14.3 ± 1.28 | 1.9 ± 1.77 | 0.045* | |||||
| HF+FcFrEx | 13.7 ± 1.81 | 16.3 ± 0.25 | 2.6 ± 1.93 | 0.007* | |||||
| HF+FcLfEx | 14.0 ±1.94 | 16.0 ± 0.72 | 2.0 ± 1.31 | 0.004* | |||||
| p | 0.347 | ||||||||
Note: C: control group, HF: High fat diet group, HF+FcFrEx : High fat diet+ ethanol extract of F.carica fruit, HF+FcLfEx: High fat diet+ ethanol extract of F.carica leaf. Δ : pre and post difference. P:paired T-test (pre and post data), p:Anova. Data considered significant at p<0.05.
Other factor is the regulation of body weight and food intake can be affected by the activity of leptin, where a high-fat diet will reduce the levels of leptin thereby increasing appetite.27 The highest feed intake was found in HF+FcFrEx group so that the highest body weight gain was also found in this group. High-fat diet could increase the amount of fat deposited in adipose tissue under the skin and in abdomen in the form of triglycerides (TG). TG, when needed, will be hydrolyzed into free fatty acids and glycerol which are then oxidized to produce energy. Fat accumulation in the form of TG in adipose could increase in body weight.28 However, there was no significant difference in body weight among groups, therefore the fat accumulation, unlike muscle mass, may not be enough to give significant difference in body weight.
Effect Ethanol Extracts F. carica Fruit and Leaf Administration on Serum Lipid Profiles
Serum lipid profiles (Figure 2) showed that all intervention groups experienced a decrease in serum cholesterol, LDLchol and TG levels. FcFrEx can decrease the level of serum cholesterol and LDLchol level better compared to FcLfEx.
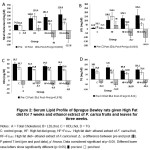 |
Figure 2: Serum Lipid Profile of Sprague Dawley rats given High Fat diet for 7 weeks and ethanol extract of F. carica fruits and leaves for three weeks. Click here to View figure |
On the other hand, TG and HDLchol level in all groups were not significantly different and all groups experienced a decrease. The fruits of F. carica has been shown to contain polyphenolic compounds i.e. flavonoids (quercetin-3-Orutinoside (rutin)) dihydroxybenzoic acid di-pentoside, hydroxycinnamic acids, hydroxycoumarin, anthocyanins (cyanidin 3-rutinoside), and furanocoumarins.16 The leaves contains ferulate, coumarate, cinnamate, quercetin, and psoralen.14 The polyphenolic compounds are well known antioxidants that can prevent lipid peroxidization and minimizing oxidation involving ROS.29,30,31 Our results in Table 2 showed that total polyphenol of FcFrEx (13.15 mg GAE/100 gr fresh extract) is approximately twice higher than FcLfEx (6.23 mg GAE/100 gr fresh extract). Therefore FcFrEx had higher potential to decrease serum cholesterol and LDLchol level compared to FcLfEx.
Table 2: Polyphenol content of ethanol extract of F. carica fruits and leaves
| Samples | Total Polyphenol Content (mg GAE/ 100 gr sample) |
| Ethanol extract of F. carica fruits | 6.23 |
| Ethanol extract of F. carica leaves | 13.15 |
Note: Data consisted of two replicate analyses
Our results regarding serum lipid profile are similar to other works who reported that F. carica leaves can decrease significantly serum lipid in diabetic and high-lipid fed rats.14,16,17 Our studies are different than the two studies in solvent used for extraction, dosage of administration, the types of high fat diet (30% fat and 2% cholesterol), time of extract adminstration, and that other studies did not show the difference between post and pre test. In Belguith-Hadriche et al., (2016) study, administration of the extracts were started from the beginning until the end of experiment.16 In our study, the extracts were administered after the animals had established dyslipidemia. Our results are also different from Jorin et al., (2013) who reported higher HDLchol in normal and F. carica treated group, therefore they suggested that lowered serum total cholesterol and LDLchol might be mediated through HDLchol.17 Our results showed that HDLchol decreased at the end of experiment in all groups, indicating different mechanism possibly mediated by antioxidant activity of polyphenol in the extract which exert its effect by reducing oxidative stress due to high fat diet. This possibility is corroborated in TNF-a and MDA results and discussion.
Cardiac Risk Ratio
The ratio of total cholesterol level to HDL levels is used to predict the risk of cardiovascular disease.31 This ratio is called the Cardiac Risk Ratio.32,33 High cholesterol levels and low HDLchol level will increase the Cardiac Risk Ratio. A study by Woodward et al. (2007) showed that normal ratio of cholesterol to HDL levels is ≤4.2.35 Our results (Table 3) show that C, HF+FcFrEx, and HF+FcLfEx groups have a normal ratio of TC/HDL and only in HF group has the highest ratio, indicating a high risk of cardiovascular disease. This results support further the ability of F. carica extracts to normalize high-fat diet associated dyslipidemia in rats.
Table 3: The ratio of Total Cholesterol to HDL level of Sprague Dawley rats given High Fat diet for 7 weeks and ethanol extract of F. carica fruits and leaves for three weeks.
| Group | Ratio TC/HDL | Δ Mean ± SD | P | |
| Pre Mean ± SD | Post Mean ± SD | |||
| C | 1,9 ± 0,32 | 2,6 ± 1,11 | 0,7±0,41a | 0,160 |
| HF | 5,3 ± 2,73 | 7,6 ± 3,43 | 2,3±1,46a | 0,176 |
| HF+FcFrEx | 5,6 ± 2,54 | 3,5 ± 0,85 | -2,1±0,85b | 0,045* |
| HF+FcLfEx | 7,6 ± 6,18 | 4,0 ± 1,32 | -3,6 ±1,93b | 0,108 |
| p | 0,023* | |||
Notes: C = control group, HF= High fat diet group, HF+FcFrEx = High fat diet+ ethanol extract of F.carica fruits, HF+FcLfEx: High fat diet+ ethanol extract of F.carica leaves. Δ: pre and post difference. P: paired T-test (pre and post data), p:Anova. Data considered significant at p<0.05.
Administration of FcFrEx and FcLfEx on Serum TNF-α and MDA
Our data in Figure 3 showed that TNF-α and MDA levels in the control group (C) decreased significantly after 3 weeks. In contrast, TNF-α and MDA levels in HF group increased significantly (p=0.025 and p=0.002 respectively). This data in HF group proves that dyslipidemia leads to an increase in serum TNF-α and MDA levels, indicating the presence of inflammation and oxidative stress. In HF+FcFrEx and HF+FcLfEx groups, TNF-α and MDA levels after 3 weeks administration of the extracts decreased similarly to control group (C) (p<0.001). Again this data proves that FcFrEx and FcLfEx can prevent serum TNF-α and MDA rise due to high fat diet so that it can return to normal level.
Reduction of serum TNF-α in HF+FcFrEx and HF+FcLfEx could be due to prevention of dyslipidemia which is shown by a decrease in serum lipid comparable to control group (Figure 2). Dyslipidemia can lead to endothelial dysfunction where LDL particles trapped inside sub-intimal can be oxidised and damaged by free radicals and attract macrophages to release pro-inflammatory cytokines such as TNF- α.
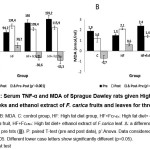 |
Figure 3: Serum TNF-α and MDA of Sprague Dawley rats given High Fat diet for 7 weeks and ethanol extract of F. carica fruits and leaves for three weeks. |
Consequently as dyslipidemia has been prevented TNF-α production is reduced. Prevention of dyslipidemia can reduce lipid substrate to peroxidation which lead to MDA formation, and therefore prevention of dyslipidemia can reduce MDA production.6,7 Reduction in serum TNF-α and MDA level in our study are likely to be due to polyphenolic content of F.carica as a strong antioxidants and the mechanism is mediated by free radicals and oxidants captures, and shielding cells and tissues from oxidative damage by radicals.36,37,38 Therefore, inflammation and oxidative stress due to high fat diet are blocked. Over all, our findings proved that ethanol extract of F. carica fruits or leaves can similarly normalize serum cholesterols, LDLchol, TG, TNF- α, and MDA level in rats fed high fat diet. Our studies added evidences to the existing data that ethanol extract of F. carica fruits or leaves can prevent the rise of serum lipid profile, inflammation, and oxidative stress due to high fat diet in Sprague Dawley rats.
Conclusion
Administration of ethanol extract of F. carica fruits or leaves at 400mg/kg BW for 3 weeks in male Sprague dawley rats fed high-fat diet can ameliorate serum lipid profile, TNF-a, and MDA rise due to high lipid diet induced dyslipidemia to normal level.
Acknowledgments
Our thank and appreciation to Mr. Arif, Mrs. Siska, and Mrs. April for technical assistance.
Funding
The author(s) received no financial support for the research, authorship, and/or publication of this article.
Conflict of Interest
All authors declare no conflict of interest.
References
- Halton TL, Willett WC, Liu S, Manson JE, Stampfer MJ, Hu FB. Potato and French Fry Consumption and Risk of Type 2 Diabetes. Am J Clin Nutr. 2006;(83):284-290.
- Qi L, Ding X, Tang W, Li Q, Mao D, Wang Y. Prevalence and Risk Factors Associated With Dyslipidemia in Chongqing, China. Int J Environ Res Public Health. 2015;12(10):13455-13465. doi:10.3390/ijerph121013455.
- National Cholesterol Education Program. Third Report of the National Cholesterol Education Program (NCEP) Expert Panel on Detection, Evaluation, and Treatment of High Blood Cholesterol in Adults (Adult Treatment Panel III) Final Report Circulation. AHA J. 2002;17(24):3147-3421. doi:10.1007/BF02481509.
- Goff DC, Bertoni AG, Kramer H, et al., Dyslipidemia Prevalence, Treatment, and Control in The Multi-Ethnic Study of Atherosclerosis (MESA): Gender, ethnicity, and coronary artery calcium. Circulation. 2006;113(5):647-656. doi:10.1161/CIRCULATIONAHA.105.552737.
- Cardiovascular diseases (CVDs). World Health Organization. https://www.who.int/news-room/fact-sheets/detail/cardiovascular-diseases-(cvds). Published 2017. Accessed June 21, 2019.
- Maiolino G, Rossitto G, Caielli P, Bisogni V, Rossi GP, Calò LA. The Role of Oxidized Low-Density Lipoproteins in Atherosclerosis: The Myths and The Facts. Mediators Inflamm. 2013;2013. doi:10.1155/2013/714653.
- Bobryshev Y V., Ivanova EA, Chistiakov DA, Nikiforov NG, Orekhov AN. Macrophages and Their Role in Atherosclerosis: Pathophysiology and Transcriptome Analysis. Biomed Res Int. 2016;2016. doi:10.1155/2016/9582430.
- Yu XH, Fu YC, Zhang DW, Yin K, Tang CK. Foam cells in atherosclerosis. Clin Chim Acta. 2013;424:245-252. doi:10.1016/j.cca.2013.06.006.
- Dushkin MI. Macrophage/Foam Cell Is An Attribute of Inflammation: Mechanisms of Formation and Functional Role. Biochem. 2012;77(4):327-338. doi:10.1134/S0006297912040025.
- Dessì M, Noce A, Bertucci P, et al., Atherosclerosis, Dyslipidemia, and Inflammation: The Significant Role of Polyunsaturated Fatty Acids. ISRN Inflamm. 2013;2013. doi:10.1155/2013/191823.
- Moore KJ, Sheedy FJ, Fisher EA. Macrophages in Atherosclerosis: A Dynamic Balance. Nat Rev Immunol. 2013;13(10):709-721. doi:10.1038/nri3520.
- Schneider C, Boeglin WE, Yin H, Porter NA, Brash AR. Intermolecular Peroxyl Radical Reactions During Autoxidation of Hydroxy and Hydroperoxy Arachidonic Acids Generate A Novel Series of Epoxidized Products. Chem Res Toxicol. 2008;21(4):895-903. doi:10.1021/tx700357u.
- Slatnar A, Klancar U, Stampar F, Veberic R. Effect of Drying of Figs ( Ficus carica L.) on the Contents of Sugars, Organic Acids, and Phenolic Compounds. J Agric Food Chem. 2011:6.21.
- El-Shobaki F., El Bahay A., Esmail RS., A.A AEM, Esmail N. Effect of Figs Fruit (Ficus carica L) and Its Leaves on Hyperglycemia in Alloxan Diabetic Rats. World J Dairy Food Sci. 2010;5(1):47-57.
- Prayogo R., Anwar S, Murwani R. Polyphenol Extracts From Low Quality Cocoa Beans : Antioxidant, Antibacterial, and Food Colouring Properties. Int Food Res J. 2013;20(6):3275-3281.
- Belguith-Hadriche O, Ammar S, Contreras Mdel M, Turki M, Segura-Carretero A, El Feki A, Makni-Ayedi F, Bouaziz M. Plant Food Hum Nutr. 2016;71(2):183-189. doi: 10.1007/s11130-016-0541-x
- Joerin L, Kauschka M, Bonnländer B, Pischel I, Benedek B, Butterweck V. Ficus carica Leaf Extract Modulates the Lipid Profile of Rats Fed with a High-Fat Diet through an Increase of HDL-C. Phyther Res. 2014;28:261-267.
- Nagappan R. Evaluation of Aqueous and Ethanol Extract of Bioactive Medicinal Plant, Cassia didymobotrya (Fresenius) Irwin & Barneby Against Immature Stages of Filarial Vector, Culex quinquefasciatus Say (Diptera : Culicidae). Asian Pac J Trop Biomed. 2012;2(9):707-711. doi:10.1016/S2221-1691(12)60214-7.
- Waterhouse A. Folin-Ciocalteau Micro Method for Total Phenol in Wine. http://waterhouse.ucdavis.edu/faqs/folin-ciocalteau-micro-method-for-total-phenol-in-wine.
- Gowd V, Bao T, Chen W. Antioxidant Potential and Phenolic Profile of Blackberry Anthocyanin Extract Followed by Human Gut Microbiota Fermentation. Food Res Int. 2018. doi:10.1016/j.foodres.2018.11.001.
- Heriansyah T. Pengaruh Berbagai Durasi Pemberian Diet Tinggi Lemak terhadap Profil Lipid Tikus Putih (Rattus Novergicus Strain Wistar) Jantan. J Kedokt eran Syiah Kuala. 2013;13:144-150.
- Murwani, R, Indriani, A, Yuliana, I, Wihardani, K, Wahyuningrum, MA, Tawakal, NR, Mulyono, Kusumanti, E. Blood Biochemical Indices and Productivity of Broilers on Diet Supplemented with Mannan Oligosacharide, Baker Yeast, or Combined Baker Yeast and Noni Leaves Extracts. J. Poult. Sci. 2011; 10(12): 990-997.
- Friedewald WT, Levy RI, Fredrickson DS. Estimation of the Concentration of Low-Density Lipoprotein Cholesterol in Plasma, Without Use of the Preparative Ultra Clin Chem. 1972;18(6):499-502.
- Hardisari R, Koiriyah B. Gambaran Kadar Trigliserida ( Metode Gpo-Pap ) Pada Sampel Serum dan Plasma EDTA. J Teknol Lab. 2016;5:27-31.
- Levin BE, Dunn-meynell AA, Ricci MR, et al., Abnormalities of Leptin and Ghrelin Regulation in Obesity-Prone Juvenile Rats. Am J Physiol Endocrinol Metab. 2003;285:E949–E957. doi:10.1152/ajpendo.00186.2003.
- Sun H, Yan J, Sun B, Song L, Yan J. Biochemical and Biophysical Research Communications Taste sensitivity to sucrose is lower in outbred Sprague-Dawley phenotypic obesity-prone rats than obesity-resistant rats. Biochem Biophys Res Commun. 2017;489(2):155-163. doi:10.1016/j.bbrc.2017.05.117.
- Wing RR, Hill JO. Successful Weight Loss Maintenance. Annu Rev Nutr. 2001;21:323-341.
- Tsalissavrina I, Wahono D, Handayani D. Pengaruh Pemberian Diet Tinggi Karbohidrat dibandingkan Diet Tinggi Lemak tehadap Kadar Trigliserida dan HDL Darah pada Rattus novergicus galur wistar. J Kedokt eran Brawijaya. 2006;XXII:80-89.
- Simo A, Porawski M, Marroni N, Collado PS, Gonza J. Biochemical and Molecular Actions of Nutrients Quercetin Decreases Oxidative Stress, NF- kappaB Activation, and iNOS Overexpression in Liver of Streptozotocin-Induced Diabetic Rats. Am Soc Nutr. 2005;135(February):2299-2304.
- Adisakwattana S, Sookkongwaree K, Roengsumran S, et al., Structure-Activity Relationships of Trans-Cinnamic Acid Derivatives on Α-Glucosidase Inhibition. Bioorganic Med Chem Lett. 2004;14(11):2893-2896. doi:10.1016/j.bmcl.2004.03.037.
- Sudheer AR, Srinivasan M, Devipriya N, Menon VP. Dose-Dependent Inhibitory Effect of Ferulic Acid, A Dietary Antioxidant on Nicotine-Induced Tissue Oxidative Stress in Experimental Rats. Iran J Pharmacol Ther. 2007;6(2):177-184.
- Quebec T, Study C. Total Cholesterol/HDL Cholesterol Ratio vs LDL Cholesterol/HDL Cholesterol Ratio as Indices of Ischemic Heart Disease Risk in Men. 2001;161:2685-2692.
- Putri YY, Nasrul E, Sastri S. Perbedaan Rasio Kolesterol Total / HDL Kelompok Kontrol dan Kelompok Diet Tinggi Minyak Sawit pada Tikus Wistar. J Kesehat an Andalas. 2014;3(3):486-491.
- Ikewuchi CC. Hypocholesterolemic Effect of An Aqueous Extract of The Leaves of Sanseviera Senegambica Baker on Plasma Lipid Profile and Atherogenic Indices of Rats Fed Egg Yolk Supplemented Diet. EXCLI. 2012;11:318-327.
- Woodward M, Barzi F, Feigin V, Gu D, Huxley R, Nakamura K, Patel A, Ho S, Jamrozik K. Associations between High-Density Lipoprotein Cholesterol and Both Stroke and Coronary Heart Disease in the Asia Pacific Region. Eur Heart J. 2007;28(21):2653-60. doi: 10.1093/eurheartj/ehm427
- Estela M, Prameshinta F, Dharmana E, Kisdjamiatun R. Efektivitas Ekstrak Daun Sirsak (Annona Muricata) dalam Menurunkan Kadar TNFα dan Meningkatkan Kadar NO, Uji Coba pada Mencit Swiss yang Diinokulasi Plasmodium Berghei ANKA. J Kedokt eran Brawijaya. 2016;29. doi:10.1111/j.1467-6435.1955.tb00008.x.
- Lestari LA. Pengaruh Ekstrak Teh Hijau (Camellia sinensis) Terhadap Kadar Malondialdehid (MDA) Plasma dan Kekuatan Genggam Tangan Lanjut Usia. J Gizi Klinik Indonesia. 2016;13(2):59-66.
- Frei B, Higdon J V. Antioxidant Activity of Tea Polyphenols In Vivo : Evidence from Animal. Am Soc Nutr Sci. 2003;133(10):3275S-84S.
Accepted on: 11/11/2019
Second Review by: Dr.Yanty Noorzianna Abdul Manaf Malaysia
Final Approval by: Prof. Min-Hsiung Pan


Web of Science Coverage
Emerging Sources Citation Index (ESCI)
2024 Journal Impact Factor: 1.1
Scopus Journal Metrics
CiteScore 2025: 2.6
CiteScore Details
Sustainable Nutrition: Food Systems, Nutrient Retention, and Public Health Impact
![]()
This journal is a member of, and subscribes to the principles of, the Committee on Publication Ethics (COPE)


