Organoleptic and Physicochemical Properties of Tarts Developed from Quinoa, Chickpea and Oats Flour and Their Ranking by Topsis Method
Luxita Sharma1*
Department of Dietetics and Applied Nutrition, Amity Medical School, Amity University, Gurgaon, Haryana, India.
Corresponding Author Email: lakshita1982@gmail.com
DOI : http://dx.doi.org/10.12944/CRNFSJ.7.2.15
Download this article as:
![]()
Malnutrition is the reason for stunted growth among children and nutritional deficiencies are prevalent in all age groups. The present food industry provides food products that are not necessarily nutrient rich. Quinoa, Chickpeas and Oats are better supplier of nutrients and are rich in fiber, vitamins and minerals therefore these are used to develop the food product.
The present study was designed to focus on the development of the best sample of the tarts that was acceptable by all age groups. A panel of twenty experts examined four samples of tarts, namely A, B, C & D, which were made with different variations in the ratio of Quinoa: Chickpea: Oats as 30:35:3540:30:30, 50:25:25 and 60:20:20 respectively.
The scores obtained from the panel of experts were used to evaluate the best tart in terms of six evaluation criteria i.e. appearance, color, texture, taste, flavor and aftertaste. TOPSIS methodology was used for ranking of tarts as this is the best MADM methodology for ranking of the criteria. This research assessed the effects of baking on the development of tarts and it was found that a successful food product could be made using the ratio of 60:20:20 (sample D). The physicochemical properties were analyzed which showed that the carbohydrate, protein, fat, sugar, and energy content of the acceptable tart were 40.4 g, 8.4 g, 12.7 g, 15.37 g and 310.6 kcals respectively.
AHP; Food Product; Fuzzy MADM; Nutrition; Oats; Quinoa; Tarts
Introduction
The major cause of nutritional deficiencies is not low socio economic status of the population but the lack of improper absorption of food in the body. The malnourishment and nutritional deficiencies are common in Indian population.15 This problem is prevalent due to lack of choice for healthy food options. Therefore, people fall into the prey of false advertisements and claims of various food products. The Indian market is full of low calorie and low fat snacks, which may not be the true claims.1
TOPSIS was first presented by Yoon (1980) and Hwang and Yoon (1981), for solving Multiple Criteria Decision Making (MCDM) problems based on the concept that the chosen alternative should have the shortest Euclidian distance from the Positive Ideal Solution (PIS) and the farthest from the Negative Ideal Solution (NIS). It assumes that each criterion require to be maximized or minimized. TOPSIS is a simple and useful technique for ranking a number of possible alternatives according to closeness to the ideal solution. The priority weights for different criteria will be calculated using analytic hierarchy process (AHP) method and subsequently, these weights will be used for arriving at the best decision regarding selection of the best food product using TOPSIS method.
Literature shows that very few snacks with good nutritive value are available for Indian population which shows that there is need of development of nutritious snacks. According to a study by WHO, the remedies to eradicate iron deficiency among women and children include the proper intake of the food and balanced diet. Iron deficiency anemia causes reduction in work efficiency and fatigue is prevalent.2
The present study designed the development of a snack made from the pulse and cereal combination i.e. Besan (chickpea) or Cicer Arietinum and oats or Avena Sativa flour and Chinopodium Quinoa or quinoa flour. The snack developed should be acceptable to all the groups i.e. convenient for everyone to carry and use. Tarts are one of the demanded products in the society especially children Therefore the nutrition rich tarts are made by using three flours.4
Tart is derived from French word tarte which means pie or tart or any baked dish which is covered with sweet or savoury filling4,15 Tarts are a form of rigid pastry, thick filling so that it does not overflow7 The filling is usually sweet- fruit based, semisolid or could be savoury. Flour is the main ingredient to make tarts.
Quinoa is rich in nutrients. The edible content of protein in quinoa is 10.4 to 17.0 percent.8 Quinoa has high fiber content as compared to other cereal grains and a recent study also indicated that all varieties of quinoa contain the dietary fiber from 13.6 to 16.0 grams per 100 grams of edible portion.9 Quinoa is rich in iron, magnesium, folate, vitamin E zinc and B- complex.
Another ingredient for making the base of tarts was chickpea seed flour. Chickpea flour is already used in preparation of many snacks in India. It is rich source of protein, fiber, calcium, phosphorus, magnesium, iron and potassium.11,12 Third ingredient were oats which have unique high nutritive value in terms of protein, fiber such as beta- glucan.8 Oats have all B Vitamins with minerals and antioxidant properties.8,2,5
Cooking is a detailed procedure that involves preparation of food by applying heat at specific temperature and timings. The food preparation combines the steps such as selection, measuring and combining of ingredients so that a successful food product is obtained.5,16
The aim of the present study is to develop an innovative nutritional food product and to study its Organoleptic properties with the Nutritional composition.
Materials and Methods
Procurement of raw material
The Quinoa was purchased from local Nature’s basket store, Gurgaon. The raw material was carefully monitored and sorted out for any deformities or weeds present. Quinoa was stored in cold temperature of 20 degree Celsius. Chana dal was purchased from market and then it was roasted and grinded in laboratory mixer and grinder. Similarly oats were also grinded to powder form in mixer and grinder.
Preparation:- Samples formation was at first started and first step was to divide the ratios. The different ratio of three flour at 60%, 50, 40% and 30% were taken. For the filling of the tart, fresh oranges were obtained from local market, Gurgaon, Haryana, India and a juicer was used to squeeze out the juice. Custard powder was obtained from local market, Gurgaon, Haryana, India.
Tarts Making
Dough formation
200 grams of different ratios of flours was taken and was mixed with measured amount of butter, one whisked egg yolk and 5gms of grinded sugar to make dough of appropriate consistency. Then the dough was transferred to refrigerator for 10 minutes.
Preparation
Tarts were prepared by kneading the dough and forming small balls from the dough. The balls were then placed in already greased tart mould and pressing the dough ball to make the base with fingers. The excess dough removed. The moulds were kept in the oven for 12-15 minutes at 180˚C until golden brown. The tarts were removed and set aside for cooling.
For the filling, juice from fresh oranges was extracted using a juicer. The juice was put in a saucepan and was heated for 2 minutes. To that 5gms of castor sugar was added and finally 10gms of custard powder was added. The mixture was stirred rigorously in continuation in order to avoid lump formation. At low flame mixture was kept till it thickened. The filling was set aside for 1 minute and then was filled in the tarts in equal proportions. The tarts were kept in refrigerator for the filling to set.
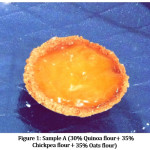 |
Figure 1: Sample A (30% Quinoa flour+ 35% Chickpea flour + 35% Oats flour) Click here to View figure |
 |
Figure 2: Linguistic terms into their corresponding fuzzy Click here to View figure |
 |
Figure 3: Hierarchical structure Click here to View figure |
 |
Figure 4: Sample D (60% Quinoa flour+ 20% Chickpea flour + 20% Oats flour) Click here to View figure |
Sensory Evaluation Technique
The sensory evaluation was carried out to find the overall acceptability of tarts. The unipolar – scale begins with “no”/ “0” and ends with “very”, “extremely”, “9”. The tarts were cooked and four samples each were served to 20 trained panelists (Twelve Nutritionist and Eight Medical and Public Health Experts) from Amity Medical School, Amity University Haryana. Panelists evaluated the samples with Unipolar Numerical scale as follows11,16:
| Color | 0 | 1 | 2 | 3 | 4 | 5 | 6 | 7 | 8 |
| Absent | slightly acceptable | moderately good | very good | extremely appealing | |||||
Similarly for flavor, appearance, texture, taste, after taste and overall acceptability. were tested. Then the mean and standard deviation was calculated after tabulation of data in SPSS software.
Proximate composition of Tarts-Nutritional Analysis of Tarts
Moisture Content and Procedure
The oven method was used to calculate Moisture content of flours. In this method, accurately weighed sample (5 gm) was taken in previously dried and weighed moisture
Petridish.12 Standard procedure of calculation was used and by the following formula:
![]()
Where, W = Weight of empty cup;
W1 = Weight of cup with sample before drying;
W2 = Weight of cup with sample after drying to constant weight.12
Total Ash (%)
Test portion of 5 to 10 g of the sample was heated slowly over the flame in 50 to 100 ml silica crucible at 100°C until water is expelled. Placed the dish in a furnace at 525°C and left it until white ash is seen. Cool it and add water to ash, further dry it with hot plate. Re-ashed at 525°C to constant weight.14
Ash % = (Final crucible wt Initial crucible wt X 100)/Sample weight
Crude Fat
The method of fat extraction was followed accordance with AOAC 1995.
Calculations
Wt. of ether soluble material
Crude fat (%) = ————————————— X 100
Wt. of sample
Protein content – Micro Kjeldahl method
The estimation of various flours was done by Micro Kjeldahl method as described in A.O.A.C. (2000). The following formula was used:
![]()
Where,
(V2- V1) = Volume made of the digest
Protein % = N% x Conversion factor (6.25)
Carbohydrate
Total carbohydrate was calculated by the formula of substracting the sum of the values for moisture, crude protein, crude fat,crude fibre, ash in 100
Energy
Energy was calculated by multiplying protein with 4, fat with 9 and carbohydrate with 4 and then adding them.
Iron
Iron content of flours was determined using atomic absorption spectrophotometer.1
Statistical Analysis
SPSS software version 22.0 was used to analyze the results. The sensory evaluation was carried out by the team of experts and data was collected. The responses from the experts were obtained on a written format of Hedonic scale i.e Unipolar Numeric scale. The different parameters were under the headings of Appearance, colour, Texture, Taste, Flavour, After taste and Overall acceptability. Each parameter is given under the techniques of sensory evaluation. Twenty scores of each parameter were obtained for each sample for example Sample A- twenty scores for each- Appearance, colour, Texture, Taste, Flavour, After taste and Overall acceptability. The technique of Purposive sampling was followed. The scores were given out of 8 and 0 being the absent and 8 being the highly acceptable sample in terms of each parameter. Then mean and standard deviation was calculated for each sample and each parameter.12,13,14
Hwang and Yoon (6) were the first to use TOPSIS for analyzing Multiple Criteria Decision Making (MCDM) problems. According to TOPSIS the best alternative has the shortest Euclidian distance from the Positive Ideal Solution (PIS) and the farthest from the Negative Ideal Solution (NIS).12,13
It assumes that each criterion require to be maximized or minimized. TOPSIS is a simple and useful technique for ranking a number of possible alternatives according to closeness to the ideal solution. The priority weights for different criteria will be calculated using analytic hierarchy process (AHP) method and subsequently, these weights will be used for arriving at the best decision regarding selection of the best food product using TOPSIS method.
Results and Discussion
Sensory scores of Tarts
Table 1 showed the result of the sensory evaluation of all samples prepared. The sample containing 60% quinoa flour was significantly rated best (7.7) followed by sample containing 50% quinoa flour addition (7.3), while sample containing 30% quinoa flour addition had the least color rating (5.0). The sample containing 60% quinoa flour had the number one taste rating (7.5) with further sample by 50% quinoa flour (6.5), while sample having 30% quinoa flour substitution received the least rating (4.9).
Calculation of weights by means of Analytical Hierarchy Process (AHP)
The purpose to use AHP technique was to exactly finding out the best option among the various available options and then the effective decisions was made.1,11 Pair-wise comparisons were done using the judgments based upon Pair-wise comparison scale developed by Satty. A nine point pair wise comparison scale had been used ranging from 1 as equally favored to 9 as extremely favored (12).
AHP technique is listed below:
Let A = {Aj| j = 1, 2,…,n} be the set of criteria. The final result of the pairwise comparison on n criteria can be summed in an (n x n) matrix C in which every element a ij(i, j = 1, 2,…,n) is the quotient of weights of the criteria. This pairwise comparison can be depicted by the following equation:
The tarts were cooked and four samples each were served to 20 trained panelists (Twelve Nutritionist and Eight Medical and Public health experts) from Amity Medical School, Amity University Haryana.
AHP Calculation
| A | B | C | D | 4th root | Priority Vector (Weights) | |
| A | 1 | 0.50 | 0.33 | 0.25 | 0.449 | 0.094 |
| B | 2 | 1 | 0.50 | 0.33 | 0.757 | 0.159 |
| C | 3 | 2 | 1 | 0.50 | 1.316 | 0.278 |
| D | 4 | 3 | 2 | 1 | 2.21 | 0.467 |
| Sum | 10 | 6.50 | 3.83 | 2.08 | 4.732 | |
| Sum PV | 0.94 | 1.033 | 1.06 | 0.97 | 4.003 |
A= (1 X 0.5 X 0.33 X 0.25)1/4 = 0.449,
B= (2 X 1 X 0.5 X 0.33)1/4 = 0.757,
C= (3 X 2 X 1 X 0.50)1/4 = 1.316
D= (4 X 3 X 2 X 1)1/4 = 2.21
Sum:
10 x 0.094 = 0.94
6.50 x 0.159 = 1.033
3.83 x 0.278 = 1.06
2.08 x 0.467 = 0.97
Total = 4.003
CR= 4.003-4/3 =.003/3 = 0.001
The Consistency Ratio (CR) showed the consistency in preparing the pair-wise comparisons. The steps of Consistency Ratio (CR) are given below:
- First, the values of pair-wise comparison were added together (as the “Sum” values) in every column and each total was multiplied by the respective weight.
- Add the values (shown in the row labeled “Sum*PV”) to attain a total of 4.003 (i.e., 0.94+1.033+1.06+0.97). This value was called as Lambda-max.
- Next step is to calculate the Consistency Index (CI). The formula for calculation is: CI = (Lambda-max –n) / (n–1) where n was the number of criteria or systems being compared. For this particular case, the calculation was: 4.003-4 /3 =0.001
- Finally the Consistency Ratio (CR) was calculated where the Consistency Index (CI) was divided by a Random Index (RI), which was taken from the table given below.
Random Consistency index (Saaty & Forman, 1993)
| N | 1 | 2 | 3 | 4 | 5 | 6 | 7 | 8 | 9 | 10 |
| RI (Random Index) | 0.000 | 0.00 | 0.58 | 0.90 | 1.12 | 1.24 | 1.32 | 1.41 | 1.45 | 1.49 |
In this particular case, n= 7 as seven criteria were compared, and so the Random Index (RI) equal to 1.32 must be used. Therefore, CR = CI / RI 4.003-4/3 =.003/3, CR= 0.001/1.32= 0.00075. The Consistency Ratio (CR) indicated how consistent a decision maker had been when doing the pair wise comparisons. The matrix will be consistent and acceptable if the consistency ratio is less than 0.1.
In this case the CR equals 0.001, which means that the pair wise comparisons were relatively consistent and no corrective action was necessary.
Application of TOPSIS to the research work to rank the best alternative:
Mean scores obtained from the sensory evaluation technique were used in TOPSIS process.
Table 1: Mean scores obtained from the sensory evaluation technique with weights calculated with AHP technique:
| Samples | Appearance | Color | Texture | Taste | Flavor | After taste | Overall acceptability |
| A (30:35:35) (Quinoa:Chickpea:Oats) Weight= 0.094 |
5.5 | 6.05 | 5.8 | 5.85 | 4.98 | 5.27 | 5.17 |
| B (40:30:30) Quinoa:Chickpea:Oats Weight= 0.159 |
6.08 | 6.48 | 5.94 | 6.35 | 6.14 | 6.26 | 5.26 |
| C (50:25:25) Quinoa:Chickpea:Oats Weight= 0.278 |
6.31 | 5.71 | 6.36 | 6.66 | 6.84 | 6.92 | 6.29 |
| D (60:20:20) Quinoa:Chickpea:Oats Weight= 0.467 |
7.35 | 7.34 | 7.38 | 7.51 | 7.04 | 5.58 | 7.46 |
m = 4 alternatives (four varieties of tarts) n = 7 attributes/criteria xij = score of option i with respect to criterion X = {xij} 4´7 score matrix. J = set of attributes: Appearance, color, texture, taste, flavor, after taste and overall acceptability.
Steps of Topsis technique
Step 1: Construct normalized decision matrix, calculate (Sx2ij )1/2 for each column and divide each column by (Sx2ij )1/2 to get rij:
Table 2: Calculation of (Sx2ij )1/2 for each column and divide each column by (Sx2ij )1/2 to get rij:
| Samples | Appearance | Color | Texture | Taste | Flavour | After taste | Overall acceptability |
| A | 0.43 | 0.47 | 0.46 | 0.44 | 0.40 | 0.44 | 0.43 |
| B | 0.48 | 0.51 | 0.47 | 0.48 | 0.49 | 0.52 | 0.43 |
| C | 0.50 | 0.44 | 0.50 | 0.50 | 0.55 | 0.58 | 0.52 |
| D | 0.58 | 0.57 | 0.58 | 0.57 | 0.56 | 0.46 | 0.62 |
Step 2: Multiply each column by wj to get vij and determine positive and negative ideal situation:
Table 3: Positive and negative ideal situation:
| Samples | Appearance | Color | Texture | Taste | Flavour | After taste | Overall acceptability |
| A | 0.040 | 0.044 | 0.043 | 0.041 | 0.037 | 0.0413 | 0.0404 |
| B | 0.076 | 0.081 | 0.074 | 0.076 | 0.077 | 0.0826 | 0.068 |
| C | 0.139 | 0.012 | 0.139 | 0.139 | 0.152 | 0.161 | 0.144 |
| D | 0.27 | 0.266 | 0.270 | 0.266 | 0.261 | 0.214 | 0.289 |
Positive Ideal solution: 0.27, 0.266, 0.27, 0.266, 0.261, 0.214, 0.289
Negative Ideal solution: 0.040, 0.012, 0.043, 0.041, 0.037, 0.0413, 0.0404
Step 3: Determine separation from positive ideal solution A* = {0.059, 0.244, 0.162, 0.080} Si* = [ S (vj*– vij)2 ] ½for each row
Table 4: Separation from positive ideal solution
| Samples | Appearance | Color | Texture | Taste | Flavour | After taste | Overall acceptability |
| A | (0.040-0.27)2 =0.0529 |
(0.044-0.266)2 =0.049 |
(0.043-0.27)2 =0.0515 |
(0.041-0.266)2 =0.052 |
(0.037-0.261)2 =0.051 |
(0.0413-0.214)2 =0.0297 |
(0.0404-0.289)2 =0.056 |
| B | (0.076-0.27)2 =0.0376 |
(0.081-0.266)2 =0.0342 |
(0.074-0.27)2 =0.038 |
(0.076-0.266)2 =0.038 |
(0.077-0.261)2 =0.0357 |
(0.0826-0.214)2 =0.0172 |
(0.068-0.289)2 =0.0488 |
| C | (0.139-0.27)2 =0.0171 |
(0.012-0.266)2 =0.0645 |
(0.139-0.27)2 =0.0171 |
(0.139-0.266)2 =0.0171 |
(0.152-0.261)2 =0.0129 |
(0.161-0.215)2 =0.0028 |
(0.144-0.289)2 =0.021 |
| D | (0.27-0.27)2 =0 |
(0.266-0.266)2 =0 |
(0.27-0.27)2 =0 |
(0.266-0.266)2 =0 |
(0.261-0.261)2 =0 |
(0.214-0.214)2 =0 |
(0.289-0.289)2 =0 |
A= √0.3421 = 0.584 B= √0.2495 = 0.499 C =√0.3064 = 0.553 D =√0 = 0
Table 5: Determine separation from negative ideal solution Si‘ = [ S (vj‘– vij)2 ] ½for each row
| Samples | Appearance | Color | Texture | Taste | Flavour | After taste | Overall acceptability |
| A | (0.040-0.040)2 =0 |
(0.044-0.012)2 =0.001024 |
(0.043-0.043)2 =0 |
(0.041-0.041)2 =0 |
(0.037-0.037)2 =0 |
(0.0413-0.0413)2 =0 |
(0.0404-0.0404)2 =0 |
| B | (0.076-0.040)2 =0.001296 |
(0.081-0.012)2 =0.004761 |
(0.074-0.043)2 =0.000961 |
(0.076-0.041)2 =0.001225 |
(0.077-0.037)2 =0.0016 |
(0.0826-0.0413)2 =0.00170 |
(0.068-0.0404)2 =0.000761 |
| C | (0.139-0.040)2 =0.009801 |
(0.012-0.012)2 =0 |
(0.139-0.043)2 =0.009216 |
(0.139-0.041)2 =0.009604 |
(0.152-0.037)2 =0.0016 |
(0.161-0.0413)2 =0.01432 |
(0.144-0.0404)2 =0.0107 |
| D | (0.27-0.040)2 = 0.0529 |
(0.266-0.012)2 =0.0645 |
(0.27-0.043)2 =0.051529 |
(0.266-0.041)2 =0.0495 |
(0.261-0.037)2 =0.0501 |
(0.214-0.0413)2 =0.0298 |
(0.289-0.0404)2 =0.06031 |
A= √ 0.001024 = 0.032 B= √ 0.012304 = 0.11 C= √0.06686 = 0.258 D= √ 0.358639 = 0.598
Step 4: Calculate the relative closeness to the ideal solution Ci* = S’i / (Si* +S’i )
A= 0.032/0.032+0.584 = 0.032/0.616 = 0.0519 B= 0.11/0.11+0.499 = 0.11/0.609 = 0.180 C= 0.258/0.258+0.553 = 0.258/0.811 = 0.31 D= 0.598/0.598+0 = 1
Ranking
D= Rank 1(Best alternative) C= Rank 2 B= Rank A= Rank 4
The results thus showed that the panelist established the tarts ready from dissimilar level of quinoa flour with uppermost suitability at 60% quinoa flour level followed by 40% quinoa flour level. Sample D was chosen as the best alternative.
Discussion
The tarts prepared from 60% quinoa flour addition were soft but nor easily breakable as compared to other samples. The experts opinion was in favour of Sample D but there was a significant aftertaste of quinoa. The other sensory scores were favourable for Sample D but the after taste could be reduced after some processing method that is yet to be explored. The results of Nutritional composition of accepted tart having 60% of quinoa flour are summarized above. The chemical – nutritional composition of the highest acceptable tarts as decided by panel of experts was done. Chemical composition, vitamin and mineral analysis of quinoa flour, chickpea flour and oats flour were evaluated for the production of tarts. Quinoa flour varied the Nutritional Composition of Tarts. The tarts were found to be nutritionally adequate and having one tart a day provides 8.4 gms of protein, 12.7 gms of fats, 40.4 carbohydrates and 310 kcals. It is tasty and an option for the children who run after bakery products which are of very less nutritive value. The study was undertaken to see the effect of deduction of different levels of quinoa flour (70-40%) on tart making properties of chickpea flour and oats flour. The cooking properties of tarts such as cooking time and cooked weight were also determined for different quinoa flour, chickpea flour and oats flour composite blends. Color of the tart was affected by quinoa flour deduction. With the decrease in the quiona flour proportion in the blends, there was decrease in protein and iron content.
Conclusion
In our modern world very less emphasis is given to the field of Nutrition. In developing countries like India, many rural areas people are unaware of the term NUTRITION. They even are ignorant about food and its healing powers. They eat food just to live. In urban areas people run after Junk foods and beverages which are deteriorating their bodies to great extent. But what we are doing for Improving Nutrition ? Being a Nutritionist I feel that if I eat right then I can be away from many diseases. I would be healthy mentally, physically and socially which is a true meaning of HEALTH. This research was done to develop a food that can provide nutrients to our society in a package of their favourite junk food – tarts. As if we ask people to eat salads and fruits then the attitude is negative.
Incorporation of Quiona flour upto 60% resulted in tarts of comparable in most quality parameters considered (nutritional, vitamin, mineral analysis and sensory parameters). This shows that assimilation of Quiona flour in the tarts increased the mineral and vitamin content. The results of this study are good indicators of the possibilities of better utilization of quinoa flour through developing variety new food products. Thus, the tarts prepared from Quinoa flour, Chickpea flour and Oats flour are gluten free and can be a good option for people having celiac diseases and inflammatory disorders. The food product can be useful in diseases where proteins and energy are needed. Therefore this study is beneficial to society as well as our food industry. Further more study can be done on this preparation to get a more successful and tasty food with nutrition in it.
Acknowledgements
We acknowledge Amity University Haryana for supporting and providing Lab and other facilities for the research activity in the Department of Dietetics and Applied Nutrition.
Conflict of Interest
There is no conflict of interest.
References
- Bhama, S. and Sadana, B. (2004) ‘In vitro digestibility and minerals availability from bengal gram dhal and flour products’. Journal of food science and technology-mysore, Vol. 41, No. 4: pp. 459-461.
- Bratt K, Sunnerheim K, Bryngelsson S, Fagerlund A, Engman L, Andersson RE, Dimberg LH. Avenanthramides in oats (Avena sativa L.) and structure− antioxidant activity relationships. Journal of agricultural and food chemistry. 2003 Jan 29;51(3):594-600.
CrossRef - Christodoulou V, Bampidis VA, Hučko B, Ploumi K, Iliadis C, Robinson PH, Mudřik Z. Nutritional value of chickpeas in rations of lactating ewes and growing lambs. Animal feed science and technology. 2005 Feb 4;118(3):229-41.
CrossRef - Davidson A. The Oxford companion to food. OUP Oxford; 2014 Aug 21. Assessed on22 December 2016.
CrossRef - Dykes L, Rooney LW. Phenolic compounds in cereal grains and their health benefits. Cereal foods world. 2007 Jun;52(3):105-11.
CrossRef - Ahmed, T., Rahman, S. and Cravioto, A. (2009) ‘Oedematous malnutrition’. Indian Journal of Medical Research, 130, No. 5, pp. 651-654.
- Ajami, S. and Ketabi, S. (2012) ‘Performance evaluation of medical records departments by analytical hierarchy process (AHP) approach in the selected hospitals in Isfahan’. Journal of medical systems, 36, No. 3, pp. 1165-1171.
CrossRef - Iqbal A, Ateeq N, Khalil IA, Perveen S, Saleemullah S. Physicochemical characteristics and amino acid profile of chickpea cultivars grown in Pakistan. Journal of Foodservice. 2006 Apr 1;17(2):94-101.
CrossRef - Lifschitz CH, Grusak MA, Butte NF. Carbohydrate digestion in humans from a β-glucan-enriched barley is reduced. The Journal of nutrition. 2002 Sep 1;132(9):2593-6.
CrossRef - Repo-Carrasco R, Espinoza C, Jacobsen SE. Nutritional value and use of the Andean crops quinoa (Chenopodium quinoa) and kañiwa (Chenopodium pallidicaule). Food reviews international. 2003 Jan 5;19(1-2):179-89.
CrossRef - Reyes Montaño EA, Ávila Torres DP, Guevara Pulido JO. Componente nutricional de diferentes variedades de quinua de la región Andina. AVANCES Investigación en Ingeniería. 2006;5:86-97.
- Saaty, T.L. (2000). Fundamentals of decision making and priority theory with the analytic hierarchy process (Vol. 6). Pittsburgh, PA: RWS Publications.
CrossRef - Saaty, T.L. and Tran, L.T. (2007) ‘On the invalidity of fuzzifying numerical judgments in the Analytic Hierarchy Process’. Mathematical and Computer Modelling, Vol. 46, No. 7, pp. 962-975.
CrossRef - Siener R, Hönow R, Seidler A, Voss S, Hesse A. Oxalate contents of species of the Polygonaceae, Amaranthaceae and Chenopodiaceae families. Food Chemistry. 2006 Dec 31;98(2):220-4.
CrossRef - Luxita Sharma: Effect of Nutritional Educational Interventions on the Food intake and weight loss among Obese males: Theory of Organised Behaviour: Journal of Nutritional Ecology and Food Research: Vol.4, 1-9, July 2017. 2326-4225
CrossRef - Luxita Sharma; Development of Dessert (Eclair) made up of Trapanatans and Zea Mays flour with Taste Acceptability; International Journal of Nutrition and Agricultural Research; November 3(2), 2016, 80 – 84, ISSN – 2393-9540
Accepted on: 14-07-2019
Second Review by: Dr. Sari Intan Kailaku Indonesia
Final Approval by: Prof. Daniel Cozzolino


Web of Science Coverage
Emerging Sources Citation Index (ESCI)
2024 Journal Impact Factor: 1.1
Scopus Journal Metrics
CiteScore 2025: 2.6
CiteScore Details
Sustainable Nutrition: Food Systems, Nutrient Retention, and Public Health Impact
![]()
This journal is a member of, and subscribes to the principles of, the Committee on Publication Ethics (COPE)


