Nutritional, Functional and Sensory Properties of Ready-To-Eat Chia and Quinoa Mix Enriched Low Amylose Rice Based Porridge Mixes
Jyoti Goyat1
, Sukhneet Suri3, S J Passi4 Himjyoti Dutta1* 1Amity Institute of Food Technology, Amity University Uttar Pradesh, Noida, India.
2Division of Food Science and Post-Harvest Technology, ICAR-Indian Agricultural Research Institute, New Delhi, India.
3Department of Food Technology, Vivekananda College, University of Delhi, New Delhi, India
4Public Health and Nutrition, Amity University Uttar Pradesh, Noida, India.
Corresponding Author Email: duttahimjyoti@gmail.com
DOI : http://dx.doi.org/10.12944/CRNFSJ.7.2.10
Download this article as:
![]()
Ready-to-eat porridges are prepared from cereal flours. Pregelatinization of the starch component results in high hygroscopicity of porridge flours resulting in easy reconstitution. Chia and quinoa seeds are popular due to their health-promoting nutritional composition and functionality. In this study, 10%, 15 % and 20% of a pregelatinized low amylose ready-to-eat rice flour were substituted with a 1:1 mixture of chia and quinoa seed flours. Analysis of the significant difference between all the results was carried out by Duncan’s multiple range test at a significance level of 0.05. Substitution significantly enhanced levels of proteins, dietary fibres, iron, calcium, potassium, sodium and zinc. Palmitic, stearic and oleic acids were proportionately higher than lesser significant changes in linoleic and alpha-linolenic acid. Although thermal destruction caused a marked reduction of total phenolic and flavonoid contents, the relative rise in ferric and cupric ion reducing the antioxidant potentials suggested the probable formation of Maillard compounds with radical scavenging properties. Chia seed mucilage was found to play a critical role in thickness and viscosity development in the optimally reconstituted porridges. Supporting results were also obtained from the texture analysis of the porridges. However, the mucilage was observed to be sensitive to high cooking temperature resulting in lower cold paste viscosity in the rapid viscosity analysis study. The roasted aroma in porridges was more acknowledged. Substitution level of 20% gave an overall sensory score below the set acceptance level. Hence, porridge mixes prepared from the rice flour substituted up to 15% with the flour mix was sensorily acceptable, rich in macro and micronutrients and can serve as a therapeutic diet for infants, old-aged and patients with poor digestive systems.
KEYWORDS:Chia; Flour; Mucilage ; Porridge; Quinoa; Sensory
Introduction
Porridge is primarily a cereal-based breakfast dish consumed by people of all age groups. Because of its soft texture, easy digestibility and suitability to be used as a nutrient substituted meal for patients, porridge has been of special use while designing therapeutic diets.1 Traditional methods of porridge making involve cooking of milled food grains in milk or water to its soft, semisolid consistency. A number of other additives are often added to enhance the taste of the final product. Coarsely broken rice (Oryza sativa, L.) and finer rice flour have been popularly used for porridge making.2,3 Polished rice grain contains up to 90% starch (db). Cooking results in gelatinization of starch and leaching out of soluble starch and protein components, leading to the viscous texture of porridge.4 Industrially processed, packaged instant dry porridge mixes are available in the market. Such products need simple reconstitution with water or milk to develop consumable consistency. The principle behind this peculiar hydration capacity of the mixes is the presence of dehydrated pregelatinized starch in those, which has a tendency to absorb more water upon soaking.5 Hydrothermally treated low amylose chokua rice varieties with apparent amylose contents ranging between 7-20% are known to produce ready-to-eat (RTE) whole rice products like komal chaul and bhoja chaul.6 The hydrothermal processes primarily involving steaming and roasting result in pregelatinization of starch in these products. They do not require cooking and can be reconstituted to cooked-like texture and viscosity by hydration at room temperature. Therefore, flour of hydrothermally treated chokua rice could be considered ideal base flour to prepare dry porridge mixes. Uncontrolled partial replacement of the base flour with other functional flours containing components that structurally interact, result in altered properties of the final product and affect sensory attributes.7 Stability of phytochemicals and their bioactive potentials is another major factor in confirming nutritional properties of hydrothermally processed food products. While heat-labile compounds are denatured, certain Maillard compounds with antioxidant activities may form in such products.8,9
Chia (Salvia hispanica) and quinoa (Chenopodium quinoa Willd)seeds deliver remarkable functional and bioactive properties. Chia being a rich source of dietary fiber (34.4g/100g), protein (16.54g/100g), minerals, and natural antioxidants, its oil contains about 83% polyunsaturated fatty acids (PUFA). Omega-3 fatty acids and omega-6 fatty acids constitute about 68% and 20% of the PUFA content.10,11 Chia seed mucilage is located on the outer layer of the seed walls and forms a weak gel with water. This tetrasaccharide is made up of β-D-xylopyranosyl, α-D-glucopyranosyl, and 4-O-methyl-α-D-glucopyranosyluronic acid.12 Molecular, rheological and functional properties of the gel has been assessed by multiple authors for their applicability in restructured meat foods, edible films and fat replacer in bakery products.13,14,15,16 These reports indicate that the material has good binding properties and is remarkably thermostable when cooked or baked under atmospheric pressure. However, no report on the effect of high pressure cooking and roasting on its functional properties is available. Quinoa is a pseudo-cereal containing high quality protein, dietary fiber and antioxidants. The quinoa oil is also rich in essential fatty acids, namely linolenic and α-linolenic acid.17 Quinoa starch has similar shape (polygonal) and size (1-3 mm) as rice starch and has a low amylose content, which is similar to chokua rice.18 Quinoa flour has been successfully substituted and studied in pastry and bakery products.19,20 Substitution of tef (Eragrostis tef) flour with quinoa flour resulted in sensorially acceptable injera flatbread product.21 In a recent research, Pereira et al., (2019) investigated on the nutritional differences between different red, black and white quinoa variants and reported differences in proteins, carbohydrates, oxalic acid, γ-tocopherol and total tocopherols content.22 The study reconfirmed that the grain is of nutritional excellence. Trigo et al., (2018) applied an ethanolic saponin-free extract of quinoa flour on mackerels as glazing agent.23 The layer had oxidant species inhibitory effect as showed by lowered rate of free fatty acid formation in the frozen fishes. Both chia and quinoa are reported to have potential effects against several physiological disorders, namely inflammatory diseases, cancer, diabetes, hypertension, cardiovascular diseases and obesity,24 Flours of both the seeds have been incorporated in a number of popular processed foodmatrices by partially replacing the primary ingredients. A few such foods are biscuits and cookies,20 chip-like snack foods25and bread,16,26 where significant textural, nutritional and bioactive improvements were recorded after substitution. No report on substitution of the seeds or their flours in porridge mix is currently available. Developing any food product with potential health benefits require exhaustive analysis of its physical, physicochemical, nutritional and sensory properties. In this study, a chia and quinoa seed flour mix was substituted in chokua rice flour at three different substitution levels. Dry instant porridge mixes were prepared from them using two different hydrothermal techniques. The dry samples were thoroughly assessed for their water activity, physical properties, proximate and nutritional compositions, fatty acid content and profile and bioactive and antioxidant properties. Optimally hydrated porridges were studied for viscosity, texture and sensory properties.
Materials and Methods
Freshly harvested milled low amylose chokua variety rice (11.2% apparent amylose content) was procured from local farmers of Assam, India. Imported chia seeds cultivated in Peru and white variety quinoa seeds cultivated in Bolivia were purchased from the market. The grains were pulverized (Philips, India) and passed through a 210 mm sieve before storing at 4°C in sealed polypropylene pouches. All the chemicals, reagents and media were procured from Himedia and Sigma-Aldrich.
Flour mix preparation
Chia and quinoa flours were exposed to 70% relative humidity for 4 hours at room temperature (RT = 25 ± 2°C) in a relative humidity chamber (Cole-Parmer, India). The moisture equilibrated flours were then blended in 1:1 (w/w) ratio. This served as the standard mix and coded as CQS. Rice flour was replaced by 10%, 15% and 20% with CQS flour and subjected to processing treatments.
Processing of instant dry porridge mixes
Each dry flour mix was divided into two portions and subjected to pregelatinization using steaming and roasting techniques. For steaming, 100 g dry flour mix was first mixed with 400 ml water and cooked at 100°C for 5 minutes. The gelatinized paste was cooled at 4°C for 24 hours. The semisolid gel settled at the bottom was collected by decanting the excess water, levelled (5 mm bed thickness), dried at 40°C in a tray dryer to 12% moisture (wb), pulverized to obtain particle sizes of 100 – 240 mm and stored at 4°C in sealed polypropylene pouches. The steam pregelatinized ‘S’ samples were coded as per the percentage of substitution as S10%, S15% and S20%. For roasting, 100 g flour mix was first moistened to 35% moisture content (wb) by sprinkling water and equilibrating for 2 hours. The moist flour mix was then roasted over a roasting pan with continuous mixing at 175±5°C for 90 s, cooled at RT and adjusted to 12% moisture (wb) content by exposing to 70% RH. These roast pregelatinized ‘R’ samples were coded as R10%, R15% and R20% respectively. Similarly, steamed and roasted rice flours served as controls and was coded as RS and RR, respectively.
Nutritional characterization
Proximate Analysis
Standard protocols were used to determine moisture, crude protein, crude fat and ash contents of the flour samples. All values were expressed in percentage (wb). Total carbohydrate was calculated as the percentage difference in sample mass to the sum of the other components.
Carbohydrate (%, wb) = 100 – [Moisture (%) + Crude protein (%) + Crude fat (%) + Ash (%)]
Fibre Content
A total dietary fibre assay kit (Sigma–Aldrich, USA) was used to analyze the total dietary fibre (%, db) content of the control, standard and sample flours.
Minerals
Atomic absorption spectrophotometry(AAS, iCE 3000, Thermofisher, USA)was used to quantify iron (Fe), sodium (Na), calcium (Ca), potassium (K) and zinc (Zn) in the samples. The samples were digested using nitric acid in a Multiwave Eco, Anton Paar (India) microwave-assisted digestion system (600 W, 15 min). Phosphorus was estimated using an established spectrophotometric technique.27 The value for each element was expressed in milligrams per 100 g of sample.
Peroxide Value and Free Fatty Acid
Fat was extracted from the flours by a continuous chloroform extraction method.28 For measuring peroxide value (PV, meq O2/kg fat), extracted fat was mixed with a dilute acidic potassium iodide solution and titrated against a 0.1 M sodium thiosulfate using starch indicator. Liberated free fatty acid (FFA, % oleic acid by mass) was determined by titrating extracted fat with potassium hydroxide using phenolphthalein indicator.27
Fatty Acid Composition
Chloroform extracted oils from QSC and composite porridge mix flours were saponified and esterified using methanolic KOH and methanolic HCl solutions to form their methyl esters. They were then separated in a gas chromatography unit (7890A, Agilent Technologies, USA) fitted with a fused silica capillary column (HP-88,100 m´ 2.250 mm´ 2.0 µm) and a flame ionization detector (FID). The temperature limits of the injector and the detector were 20°C and 250°C, respectively. By comparing with retention times of standard fatty acid methyl esters, a fatty acid in the samples was identified. Quantity of each fatty acid was expressed as relative peak intensity in the chromatogram.
Bioactive Characterization
Ethanolic extractsof bioactive compounds were obtained from the flour samples. For this, 1 g sample was mixed with 10 ml of 80% ethanol and agitated in a shaking incubator set at 25°C for 3 hours. The extract was estimated for total phenolics (TPC), flavonoids (TFC) and cupric and ferric ion reducing antioxidant activities.
Total Phenol Content (TPC)
Briefly, to 100 µl of the ethanolic extract of flour, 2.9 ml deionised water, 0.5 ml Folin-Ciocalteu reagent (FCR) and 2.0 ml of 20% sodium carbonate were added and mixed well. The mixture was incubated at RT for 60 minutes before recording absorption at 760 nm in a UV-Vis spectrophotometer (Varian Cary 50, Agilent, USA) against a reagent blank. Using ferulic acid as standard, the results were expressed as ferulic acid equivalent per gram sample (µg FAE/ g).29
Total Flavonoid Content (TFC)
The method described by Dewanto et al., (2002)was used the measure TFC in the extracts using quercetin standard. One millilitre of the extract was mixed with 0.3 ml of 5% (w/v) sodium nitrite solution. 0.3 ml of 10% AlCl3 and 2 ml of 1 M NaOH were added after 5 and 6 minutes, respectively. The mixture was then diluted with 6.4 ml distilled water and vortexed for 1 min. Absorbance was noted at 510 nm against water blank and result expressed as quercetin equivalents per gram (µg QAE/g) of sample.30
Cupric Reducing Antioxidant Capacity (CUPRAC)
0.1 mL extract was mixed with 1 ml each of CuCl2 solution (1.0´ 10-2 mol/l), neocuproine alcoholic solution (7.5´ 10-3 mol/l), a solution of ammonium acetate buffer (1 mol/l, pH 7.0) and 1 ml of distilled water and vortexed. Absorbance was recorded after 30 min at 450 nm against a reagent blank. Standard curve was prepared using trolox reagent (molar absorptivity = 1.67´104 l/mol/cm).Results were expressed as micromolar trolox equivalent per gram (mmol TE/g) of sample.31
Ferric Reducing Antioxidant Potential (FRAP)
Ferric reducing capacities of aqueous extracts of the samples (1:10 w/v) were determined using a commercial FRAP reagent [FeCl3, TPTZ (2,4,6 tripyridyl-s-triazine) in acetate buffer (pH 3.6)]. To 100 mlof the extract, 3 ml of FRAP reagent was added. After 4 minutes, the absorbance of the blue coloured solution was measured at 593 nm against FRAP reagent blank. Results were expressed as micromolar trolox equivalents per gram (µmol TE/g) of sample.32
Functional characterization
Density and porosity
Bulk (ρb) and True (ρt) densities of the flour samples were determined by previously described methods.33 Porosity (ε) was determined from the relation
ε (%) = [(ρt – ρb) / ρt]´ 100
Colour values
The CIE L* a* b* colour values were determined using a colour measurement spectrophotometer (Hunter Color-Lab, Ultrascan Vis). The hue (H*) and chroma (C*) values of each sample was determined by the following formulae.
H* = tan-1 (b*/a*)
C* = [(a*)2 + (b*)2)]1/2
Water activity (aw)
Porridge flour samples were subjected to 80% relative humidity at RT for 30 minutes before subjecting to water activity (aw) analysis using a water activity meter (Rotronic, Switzerland) fitted with HC2-AW-USB probe andconnected to a computer with HW4-P-QUICK-Vx software for aw measurement.
Hydration capacity
5 g flour (12% moisture, wb) was hydrated to saturation by soaking in 100 ml distilled water at RT for 12 hours. The slurry obtained was filtered through a nylon filter paper (0.22 µm, Sigma-aldrich) to collect the residue. Moisture was removed by drying at 105°C for 6 hours and the dried weight was measured. Hydration capacity (H, % db) was calculated using the formula
H (%) = [(Weight of hydrated mass – Weight of dried flour) / Weight of dried flour]´100
Sediment volume and solubility
1 g (db) flour was added to 10 ml distilled water in a stoppered graduated measuring cylinder. The mixture was agitated after each 2 minutes till 60 minutes. The upper level of sediment was measured as sediment volume (SV, ml). The supernatant obtained after centrifugation (1800 g, 10 minutes) was collected in a previously weighed desiccated glass petri dish and dried in a vacuum oven at 50°C till constant weight. Solubility index (SI %, db) was measured as the percentage weight of the dried supernatant to the original dried flour sample.
SI (%) = [(Weight of dried petri dish – Weight of empty petri dish) / Dry weight of sample]´100
Viscosity analysis
Viscosity analysis of porridge was carried out both at RT and under cooking and cooling cycle. Porridge sample saturated to its previously measured hydration capacity was stored covered in a beaker for 10 minutes before subjecting to viscosity analysis at RT using a viscosity analyzer (HAAKE Viscotester, Thermo Scientific) fitted with a cylindrical probe (18 mm diameter) rotating at 100 rpm. Values were recorded at the 120th second of initiating the operation. A rapid viscosity analyzer (RVA, Starchmaster 2, Newport Scientific Instruments) was used to determine the pasting profile of the flour slurry (12 %, w/w; 28 g total weight). As per a standard profile of the machine, after holding the samples at 50°C for 1 min, temperature was raised to 95°C at a rate of 12°C/min, held at 95°C for 2.40 min, cooled down to 50°C at the rate of 11.25°C/min and again hold at 50°C for 1 min. The rotational speed of paddle was 160 rpm throughout the test, only after the initial 10 seconds when it was rotated at 960 rpm for efficient dispersion. Values of peak viscosity (PV), hot paste viscosity (HPV), cold paste viscosity (CPV), breakdown (BD) and setback (SB) were recorded.
Texture analysis
The texture profiles of saturated porridge samples were determined by a back extrusion test carried out using a texture analyzer (TA.XT plus, Stable Microsystems, Surrey, UK) fitted with a 5 Kg load cell and a plunger-shaped probe of 40 mm diameter. The probe was moved at a speed of 1 mm/s to a penetration distance of 33 mm into each porridge sample and back. The maximum force value of the first peak, negative area of the graph and the ratio of areas under the two peaks were recorded as hardness (g), adhesiveness (g/s) and cohesiveness values, respectively.
Sensory Evaluation
Sensory evaluation of the porridge samples was carried out amongst 30 semi-trained panellists ranging from 18 to 21 years in age. The panellists had basic knowledge of sensory evaluation and primary idea on porridge and multigrain porridge mixes. For the analyses, porridges were freshly prepared by adding sufficient water to 100 g the four samples to previously calculated hydration capacities. 5 g sucrose was added and thoroughly mixed. The hydrated samples were evaluated for their appearance, texture, flavour, mouthfeel and overall acceptability on a 9-point hedonic rating scale anchored by ‘dislike extremely’ and ‘like extremely’. The test was conducted after a 4 hours gap from breakfast. The evaluation procedure was explained to the panellists 20 minutes before carrying out the test. Samples were provided randomly to the panellists and sufficient time was given to avoid any misinterpretation. Rinsing of mouth with water after tasting each sample was ensured. Sensorially acceptable samples were identified based on the sensory scores obtained above the level of 6.
Statistical Analysis
All the analyses were carried out in triplicates and the mean (± standard deviation) values are reported. Statistical package for the social sciences (SPSS 11.5, USA) was used to perform Duncan’s multiple range test(DMRT) at a significance level of 0.05 to determine the significant differences between the values of each parameter.
Results and Discussion
Proximate Analysis
The proximate compositions of the porridge flour samples are given in Table 1. The CQS flour was rich in protein, fat and ash content owing to the high-fat content of chia and high protein and ash content in both the seeds.20 Substitution resulted in higher proportions of these proximate components in the composite porridge flour mixes than the control RS and RR samples. Reduction in total carbohydrate content was due to decreasing proportions of rice flour in these samples. Maillard reaction also causes a marginal loss of carbohydrate and proteins in thermally processed samples by reacting to form melanoidin compounds.34, 9 Starch content in rice contributed mostly to the carbohydrate content of all flours. Presence of starch as the primary carbohydrate is necessary for attaining hygroscopicity through the principle of pregelatinization. No major change in proximate values was seen for the samples obtained from the two hydrothermal processes.
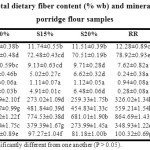 |
Table 1: Proximate composition (% db), total dietary fibre content (% wb) and mineral composition (mg/100g) of the control and porridge flour samples Click here to View Table |
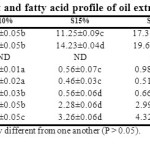 |
Table 2: Peroxide value, free fatty acid content and fatty acid profile of oil extracted from control and porridge flour samples Click here to View Table |
Fibre content
Total dietary fibre content was notably higher in the CQS flour sample than the control of processed rice flour samples (Table 1). This contributed to the significant fibre content in the composite porridge mix flours. Both the processes were found to increase fibre levels in the composite samples and the effect was marginally higher in the roasted samples. Hydrothermal processing results in disruption of tissue structures and release of fibre components from the grain matrices. A number of reports on enhanced fibre content by this phenomenon using processes like steaming and extrusion have been reported.35
Minerals
The CQS flour mixture was estimated to be rich in Ca and K while the processed rice flours were rich in Fe and Na. Substitution of the flour in the pregelatinized flour mixes substantially increased mineral content in them, as was also depicted by total ash content (Table 1). No effect of hydrothermal processing on mineral content values was observed. Substantially mineral enriched porridge mix flours with high concentrations of Fe, Na, Ca, and K was thereby obtained.
Peroxide Value and Free Fatty Acid
Processing resulted in a marked increase in PV and FFA values as can be assessed by a major difference in the values in CQS and the processed samples (Table 2). Roasting caused more severe hydrolysis and subsequent oxidation of liberated fatty acid showing higher values of both the parameters than in the steamed samples. Process temperature should be regulated to control fatty acid liberation. Lower oxidized entities in thermally processed products can be also attained by the addition of antioxidant compounds in food formulations.36Quinoa seed possess natural antioxidants which could have an inhibitory effect in the relatively milder steam processed samples.37
Fatty Acid Composition
The primary fatty acids in the oil extracted from QSC flour were palmitic, oleic, linolenic and alpha linolecic acids with traces of myristic acid (Table 2). Rice flour contained a very limited amount of fat with no probable significant contribution to the fatty acid profiles of the flour mixes (Table 2). No peak for myristic acid was detected in the processed composite flour samples indicating probable thermal denaturation. Significant increase in palmitic, stearic and oleic acid with increasing CQS substitution level was observed. However, the increase in linoleic and alpha-linolenic acid was not as significant as those. The trend was more prominent in the roasted samples. The decrease in PUFA (linoleic and linolenic acid) upon roasting was also reported by Vaidya and Choe (2011)38 and Alasalvar et al., (2010).39 Thermal denaturation of triglycerides and subsequent oxidation are considered responsible for this drop in values.40
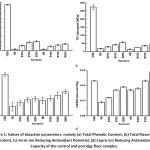 |
Figure 1: Values of bioactive parameters, namely (a) Total Phenolic Content, (b) Total Flavonoid Content, (c) Ferric ion Reducing Antioxidant Potential, (d) Cupric ion Reducing Antioxidant Capacity of the control and porridge flour samples. Click here to View figure |
Bioactive Characterization
Substitution induced bioactive values to the composite flours. TPC and TFC values increased, although to a lower extent when compared to the level of substitution (Figure 1). Thermal processing loss of phenolics and flavonoids in food substances is widely reported.41 Roasting exerted a more severe effect on these native bioactive compounds than steaming. However, significantly higher values of CUPRAC and FRAP suggested the probable formation of melanoidin compounds with active antioxidant properties in the high-temperature roasted samples.8,9,42 Additionally, thermal processing could also release bound phenolics with antioxidant properties from complex tissues, thereby raising the overall antioxidant values.41,43 This change was less prominent in the steamed samples. Overall, the composite porridge mix flours had sufficient content of natural as well as process synthesized bioactive compounds in them.
Density and porosity
Steamed RS and roasted RR flours showed the lowest density and porosity values (Table 3). Incorporation of CQS flour with increasing proportions progressively increased the porosity of the dry porridge mixes. This could be attributed to differences in particle shape and density in the rice and chia and quinoa flours. Effect of roasting on flour bed porosity was notably higher than that caused by steaming. Roasting caused rapid dehydration and major changes on particle surfaces resulting in altered packing properties.44
Color values
The lightness (L*) values of samples decreased on substitution with dark QS flour (Table 3). Effect of roasting on colour change was higher than steaming which may be attributed to Maillard browning. The marked increase in redness (+a*) and yellowness (+b*) values occurred after processing. Hue angle value (H*) suggesting colour intensity was highest for RR sample. Darkest CQS showed the lowest H* value. However, the level of substitution had a limited effect on colour intensity suggesting potential scope for further increasing substitution levels. Starch gelatinization on steaming resulted in the translucency of RS flours and its lowest chroma angle (C*) value. Substitution with QS flour improved overall colour purity of samples, as depicted by increased C* for samples obtained from both the hydrothermal processes.
Water activity(aw)
The aw values of food materials indicate the availability of free water, which can be used by microorganisms to grow and cause spoilage. Indirectly, it is determinant of the shelf life of a food product. CQS flour had markedly lower aw than steamed and roasted rice flours suggesting lower free water availability in it (Table 3). Probably, higher amounts of soluble fibres in the flour resulted in rapid binding of water molecules in the former.45 Retrograding starches in the steamed and roasted samples also possess a tendency to absorb moisture but with a slower rate of water molecule entrapment due to the slow occurrence of necessary conformational changes in the glycosidic chains.46 Substitution with QS flour caused the gradual lowering of aw in the flour samples. The results indicated that the substituted flours were more shelf stable than the standard steamed and roasted rice porridge flours.
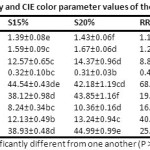 |
Table 3: Bulk density, true density, porosity, water activity and CIE colour parameter values of the control and porridge flour samples Click here to View Table |
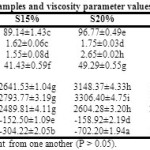 |
Table 4: Hydration properties of flour samples and viscosity parameter values of optimum hydrated porridge samples Click here to View Table |
Hydration capacity
The CQS flour had very high hydration capacity (Table 4). Chia polysaccharides readily form a weak gel on soaking by absorbing a high amount of water.47 Quinoa flour is also known to have significant water uptake capacity.48 Roasted rice flour RR showed higher hydration that steamed RS flour. Roasting results in gelatinization coupled with rapid dehydration, leading to high moisture uptake capacity in roasted cereal products. This effect is more prominent in low amylose and waxy starches.49 Dietary fibres exposed through hydrothermal processing also possess enhanced hydration properties.35 Substitution of rice flour with QS flour notably improved hydration capacities of dry porridge mix samples, which is favourable for reconstitution properties of the product. Roasted samples exhibited better hydration than steamed samples.
Sediment volume and solubility
Sediment volume and solubility index showed trends correlating with water uptake capacity of the flour samples. This value typically indicates the level of gelatinized starch in processed cereal flours.50 Increasing values of SV with the level of substitution of QS suggested increasing sedimentation rate of the pregelatinized QS flours (Table 4). Roasted samples exhibited markedly higher SV than steamed samples with the same level of QS substitution. The occurrence of more gelatinized starch fractions in the former could be attributed to this difference. Thermal processing also increased soluble fractions causing a gradual increase in solubility indices. Hydrothermal processing causes the breakdown of complex biopolymers and forms simpler oligomers with high solubility.51 Simple carbohydrates and proteins show ready digestibility as compared to their complex polymeric forms. This property is beneficial for infants, old-aged and patients with the poor digestive system. Therefore, these pregelatinized porridge mixes can be developed as therapeutic diets for such age and health groups.
Viscosity analysis
Optimum water saturated CQS flour showed the highest viscosity (67 cP) at room temperature (Table 4). Chia seed flour released its typical mucilage which formed a gel with water, giving this high values of viscosity. Steamed and roasted rice flours gave viscosity values of 22 cP and 16 cP, respectively. Roasting caused a major breakdown of starch macromolecule resulting in lower viscosity in the slurries of RR, R10%, R15% and R20%. Roasted samples contain more gelatinized starch while steamed samples contain recrystallized fractions which may gain viscosity on further cooking. Addition of CQS increased slurry viscosity to several extents in both steamed and roasted porridge flour samples. Reduced rice flour proportion did not exert any prominent effect on the viscosity values. The values correlated with PV values obtained from the RVA, suggesting resistance of the gel to temperature rise till 95°C. The CQS substituted samples showed no BD (negative values) and still increased viscosity to HPV values of 3306 cP and 1740 cP for S20% and R20%, respectively. Developing chia mucilage gel inhibited BD as typically occur during starch gelatinization. However, the CPV values for all substituted samples except R10% were lower than HPV values giving negative values of SB. R10% showed a similar trend with marginally lower viscosity loss and a SB of 82 cP. From this observation, it could be opined that the increasing gel integrity formed in the substituted sample pastes by chia mucilage gradually weakened and could not resist the shear exerted by the RVA paddle at the end of the heating-cooling temperature cycle.
Texture analysis
Texture profile parameters of the optimally hydrated porridges are presented in Figure 2. Porridge prepared from CQS flour gave the highest hardness value (4578.33 g) due to the gel formed by chia mucilage. Hydrothermal processed rice flours, namely RS and RR gave hardness values of 3049.81 g and 2546.42 g respectively, indicating softer slurry formed by roasted samples with a higher degree of molecular damage caused by a higher intensity of process heat. Formation of simple leachable fractions on hydrothermal treatment resulted in significant adhesiveness in the two samples (87.32 g/s and 109.28 g/s). A similar observation was made by Wu et al., (2017)with starch in cooked quinoa seeds.52 Hardness increased and adhesiveness decreased with increasing CQS concentration in the porridge samples. Increased cohesiveness was recorded and was found to be higher in the steam processed porridge samples (51.27 to 66.04) that the roasted samples (38.16 to 56.13).
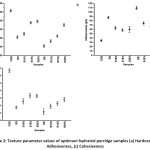 |
Figure 2: Texture parameter values of optimum hydrated porridge samples (a) Hardness, (b) Adhesiveness, (c) Cohesiveness Click here to View figure |
Sensory Evaluation
The panellists did positively respond to the significant change in colour of the porridge due to the addition of the CQS flours at 15% and 20%, as indicated by lowering scores for appearance (Figure 3). However, there was an improvement in texture on 10% and 15% substitution of flours in both steamed and roasted samples. Flavour improved for 10% substituted samples. The results indicate that the scores were higher for the roasted samples suggesting more acceptability of roasted aroma in the porridges by the panellists. Mouthfeel significantly dropped for 20% substituted samples. The overall acceptability was above 6.0 and could be considered satisfactory for all the composite porridge samples with lowest values exhibited by the S20% and R20%. A CQS flour substitution level-up to 15% in the rice-based porridge could be considered to have sufficient sensorial acceptability.
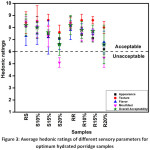 |
Figure 3: Average hedonic ratings of different sensory parameters for optimum hydrated porridge samples Click here to View figure |
Conclusion
Substitution levels of 10% and 15%of the CQS flour mix in the hydrothermally processed low amylose chokua rice flour resulted in sensorial acceptable ready-to-eat porridge mixes. These porridge mix products were significantly rich in protein, essential fatty acids, and minerals than normal rice porridge. Processing resulted in the loss of natural phenolics and flavonoids, however, Maillard browning compounds with antioxidant activities were ascertained. Browning has a limited effect on product acceptability. Chia seed mucilage played a direct functional role in deciding the viscosity and texture profiles of the porridge mixes, besides the general role of pregelatinized starch in them. The study indicated that chia seeds and mucilage can be studied for applicability as a potential natural food thickener. Sufficiently high water uptake was also recorded for the standardized samples. The dry mixes had low water activity, indicating long shelf stability when stored in water impermeable packages.
Acknowledgements
The principal author was awarded Senior Research Fellowship by the University Grants Commission (UGC), Government of India to carry out this research.
Funding
The author(s) received no financial support for the research, authorship, and/or publication of this article.
Conflict of Interest
The authors do not have any conflict of interest with any person or organization in publishing this article.
References
- Alyami J., Ladd N., Pritchard S. E., Hoad C. L., Sultan A. A., Spiller R. C., Taylor M. A. Glycaemic, gastrointestinal and appetite responses to breakfast porridges from ancient cereal grains: A MRI pilot study in healthy humans. Food Research International. 2019;118: 49-57.
CrossRef - Srikaeo K., Sopade P. A. Functional properties and starch digestibility of instant Jasmine rice porridges. Carbohydrate Polymers. 2010; 82(3): 952-957.
CrossRef - Rhim J. W., Koh S., Kim, J. M. Effect of freezing temperature on rehydration and water vapour adsorption characteristics of freeze-dried rice porridge. Journal of Food Engineering. 2011;104(4): 484-491.
CrossRef - Tester R. F., Morrison W. R. Swelling and gelatinization of cereal starches. I. effects of amylopectin, amylose, and lipids. Cereal Chemistry. 1990;67(6): 551-557.
- Mandge H. M., Sharma S., Dar B. N.Instant multigrain porridge: effect of cooking treatment on physicochemical and functional properties. Journal of Food Science and Technology. 2014;51(1): 97-103.
CrossRef - Dutta H. Mahanta C. L. Traditional parboiled rice-based products revisited: Current status and future research challenges. Rice Science. 2014;21(4): 187-200.
CrossRef - Masamba K., Jinazali H. Effect of cassava flour processing methods and substitution level on proximate composition, sensory characteristics and overall acceptability of bread made from wheat-cassava flour blends. African Journal of Food, Agriculture, Nutrition and Development. 2014;14(6): 2190-2203.
- Rawson A., Patras A., Tiwari B. K., Noci F., Koutchma T., Brunton N. Effect of thermal and non-thermal processing technologies on the bioactive content of exotic fruits and their products: a review of recent advances. Food Research International. 2011;44(7): 1875-1887.
CrossRef - Coates W. Protein content, oil content and fatty acid profiles as potential criteria to determine the origin of commercially grown chia (Salvia hispanica L.). Industrial Crops and Products. 2011;34(2): 1366-1371.
CrossRef - Giaretta D., Lima V. A., Carpes S. T. Improvement of fatty acid profile in breads supplemented with Kinako flour and chia seed. Innovative Food Science & Emerging Technologies. 2018;49: 211-214.
CrossRef - Goh K. K. T., Matia-Merino L., Chiang J. H., Quek R., Soh S. J. B., Lentle, R. G. The physicochemical properties of chia seed polysaccharide and its microgel dispersion rheology. Carbohydrate Polymers. 2016;149: 297-307.
CrossRef - Dick M., Costa T. M. H., Gomaa A., Subirade M., de Oliveira Rios A., Flôres S. H. Edible film production from chia seed mucilage: Effect of glycerol concentration on its physicochemical and mechanical properties. Carbohydrate Polymers. 2015;130: 198-205.
CrossRef - Timilsena Y. P., Adhikari R., Kasapis S., Adhikari, B. Rheological and microstructural properties of the chia seed polysaccharide. International Journal of Biological Macromolecules. 2015;81: 991-999.
CrossRef - Felisberto M. H. F., Wahanik A. L., Gomes-Ruffi C. R., Clerici M. T. P. S., Chang Y. K., Steel C. J. Use of chia (Salvia hispanica L.) mucilage gel to reduce fat in pound cakes. LWT-Food Science and Technology. 2015;63(2): 1049-1055.
CrossRef - Fernandes S. S., de las Mercedes Salas-Mellado M. Addition of chia seed mucilage for reduction of fat content in bread and cakes. Food Chemistry. 2017;227: 237-244.
CrossRef - Filho A. M. M., Pirozi M. R., Borges J. T. D. S., Pinheiro Sant’Ana H. M., Chaves J. B. P., Coimbra, J. S. D. R. Quinoa: nutritional, functional, and antinutritional aspects. Critical Reviews in Food Science and Nutrition. 2017;57(8): 1618-1630.
CrossRef - Li G., Zhu F. Quinoa starch: structure, properties, and applications. Carbohydrate Polymers. 2018;181: 851-861.
CrossRef - Vilcacundo R., Hernández-Ledesma B. Nutritional and biological value of quinoa (Chenopodium quinoa Willd.). Current Opinion in Food Science. 2017;14: 1-6.
CrossRef - Goyat J., Passi S. J., Suri S., Dutta, H. Development of chia (salvia hispanica, l.) and quinoa (chenopodium quinoa, l.) seed flour substituted cookies-physicochemical, nutritional and storage studies. Current Research in Nutrition and Food Science Journal. 2018;6(3): 757-769.
CrossRef - Agza B., Bekele R., Shiferaw L. Quinoa (Chenopodium quinoa, Wild.): as a potential ingredient of injera in Ethiopia. Journal of Cereal Science. 2018;82: 170-174.
CrossRef - Pereira E., Encina-Zelada C., Barros L., Gonzales-Barron U., Cadavez V., Ferreiera, I.C. Chemical and nutritional characterization of Chenopodium quinoa Willd (quinoa) grains: a good alternative to nutritious food. Food Chemistry. 2019;280: 110-114.
CrossRef - Trigo M., Rodríguez A., Dovale G., Pastén A., Vega-Gálvez A., Aubourg, S. P. The effect of glazing based on saponin-free quinoa (Chenopodium quinoa) extract on the lipid quality of frozen fatty fish. LWT. 2018;98: 231-236.
CrossRef - Ullah R., Nadeem M., Khalique A., Imran M., Mehmood S., Javed A., Hussain J. Nutritional and therapeutic perspectives of Chia (Salvia hispanica L.): a review. Journal of Food Science and technology.2016;53(4): 1750-1758.
CrossRef - Coorey R., Grant A., Jayasen, V. Effect of chia flour incorporation on the nutritive quality and consumer acceptance of chips. Journal of Food Research. 2012;1: 85-95.
CrossRef - Romankiewicz D., Hassoon W. H., Cacak-Pietrzak G., Sobzyk M., Wirkowska-Wojdyla M., Ceglinska A., Dziki D. The effect of chia seeds (Salvia hispanica L.) addition on quality and nutritional value of wheat bread. Journal of Food Quality. 2017 : 1-7.
CrossRef - Rudra S.G., Jakhar N., Nishad J., Saini N., Sen S., Bhardwaj R., Jaiswal S., Suneja P., Singh S., Kaur C. Extrusion conditions and antioxidant properties of sorghum, barley and horse gram based snack. Vegetos-An International Journal of Plant Research. 2015; 28(2): 171-182.
CrossRef - Briones-Labarca V., Plaza-Morales M., Giovagnoli-Vicuna C., Jamett F. High hydrostatic pressure and ultrasound extractions of antioxidants compounds, sulforaphane and fatty acids from Chilean papaya (Vasconcellea pubescens) seeds: effects of extraction conditions and methods. LWT-Food Science and Technology. 2015;60(1): 525-534.
CrossRef - Singleton V.L., Orthofer R., Lamuela-Ranventos R.M. Analysis of total phenols other oxidation substrates and antioxidant by means of folin-ciocalteau reagent. Methods in Enzymology. 1999:299: 152-178.
CrossRef - Dewanto X.Z., Wu A.K.K., Liu R.H. Thermal processing enhances the nutritional value of tomatoes by increasing total antioxidant activity. Journal of Agricultural and Food Chemistry. 2002;50: 3010-3014.
CrossRef - Apak R., Guclu K., Ozyurek M., Karademir S.E. Novel total antioxidant capacity index for dietary phenols and vitamins C and E, using their cupric ion reducing capability in the presence of neocuproine: CUPRAC method. Journal of Agricultural and Food Chemistry. 2004;52: 7970-7981.
CrossRef - Benzie I.F.F., Strain J.J. The ferric reducing ability of plasma (FRAP) as a measure of ‘antioxidant’ power: the FRAP Assay. Analytical Biochemistry. 1996;239: 70-76.
CrossRef - Dutta H., Mahanta C.L. Laboratory process development and physiochemical characterization of a low amylase and hydrothermally treated ready-to-eat rice product requiring no cooking. Food and Bioprocess Technology. 2014;7(1), 212-223.
CrossRef - Oliver C.M., Melton L.D., Stanley R.A. Creating proteins with novel functionality via the Maillard reaction: a review. Critical Reviews in Food Science and Nutrition. 2006;46(4): 337-350.
CrossRef - Nooshkam M., Varidi M., Bashash M. The Maillard reaction products as a food-born antioxidant and antibrowning agents in the model and real food systems. Food Chemistry. 2018;275: 644-660.
CrossRef - Dhingra D., Michael M., Rajput H., Patil R.T. Dietary fibre in foods: a review. Journal of Food Science and Technology. 2012;49(3):255-266.
CrossRef - Maisuthisakul P., Gordon M. H., Pongsawatmanit R., Suttajit M. Enhancing the oxidative stability of rice crackers by addition of the ethanolic extract of phytochemicals from Cratoxylum formosum Dyer. Asia Pacific Journal of Clinical Nutrition. 2007;16(S1): 37-42.
- Trigo M., Rodriguez A., Dovale G., Pasten A., Vega-Galvez A., Aubourg S. P. The effect of glazing based on saponin-free quinoa (Chenopodium quinoa) extract on the lipid quality of frozen fatty fish. LWT. 2018;98: 231-236.
CrossRef - Vaidya B., Choe E. Stability of tocopherols and lutein in oil extracted from roasted or unroasted mustard seeds during the oil oxidation in the dark. Food Science and Biotechnology. 2011; 20(1): 193-199.
CrossRef - Alasalvar C., Pelvan E. Amarowicz R. Effects of roasting on taste-active compounds of Turkish hazelnut varieties (Corylus avellana L.). Journal of Agricultural and Food Chemistry. 2010;58:8674-8679.
CrossRef - Jain T., Grover K., Kaur G. Effect of processing on nutrients and fatty acid composition of garden cress (Lepidium sativum) seeds. Food Chemistry.2016;213: 806-812.
CrossRef - Nayak B., Liu R.H., Tang J. Effect of processing on phenolic antioxidants of fruits, vegetables and grains- a review. Critical Reviews in Food Science and Nutrition. 2015; 55(7): 887-918.
CrossRef - Langner E., Rzeski W. Biological properties of melanoidins: A review. International Journal of Food Properties. 2014;17(2): 344-353.
CrossRef - Duodu K. G. Effects of processing on antioxidant phenolics of cereal and legume grains. Advances in Cereal Science: Implications of Food Processing and Health Promoton. 2011: 31-54
CrossRef - Jogihalli P., Singh L., Kumar K., Sharanagat V. S. Novel continuous roasting of chickpea (Cicer arietinum): Study on physic-functional, antioxidant and roasting characteristics. LWT. 2017;86: 456-464.
CrossRef - Collar C., Santos E., Rosell C.M. Assessment of the rheological profle of fibre- enriched bread dough by response surface methodology. Journal of Food Engineering. 2007;78(3): 820-826.
CrossRef - Fu Z., Chen J., Luo S.J., Liu C.M., Liu W. Effect of food additives on starch retrogradation: A review. Starch- Starke. 2015;67(1-2): 69-78.
CrossRef - Ramos S., Fradinho P., Mata P., Raymundo A. Assessing gelling properties of chia (Salvia Hispanica L.) flour through rheological characterization. Journal of the Science of Food and Agriculture. 2017;97(6):1753-1760.
CrossRef - Bastidas E.G., Roura R., Rizzolo D.A.D., Massanes T., Gomis R. Quinoa (Chenopodium quinoa Willd), from nutritional value to potential health benefits: an integrative review. Journal of Nutrition and Food Sciences. 2016;6(3): 1-10.
- Dutta H., Mahanta C.L., Singh V. Changes in the properties of rice varieties with different amylose content on dry heat parboiling. Journal of Cereal Science. 2015;65: 227-235.
CrossRef - Wu Y., Lin Q., Cui T., Xiao H. Structural and physical properties of starches isolated from six varieties of millet grown in China. International Journal of Food Properties. 2014;17(10): 2344-2360.
CrossRef - Gollakota A.R.K., Kishore N., Gu S. A review on hydrothermal liquefaction of biomass. Renewable and Sustainable Energy Reviews. 2018;81: 1378-1392.
CrossRef - Wu G., Morris C. F., Murphy K.M. Quinoa starch characteristics and their correlations with the texture profile analysis (TPA) of cooked quinoa. Journal of food Science. 2017; 82(10): 2387-2395.
CrossRef
Accepted on: 25-05-2019
Second Review by: Dr. Purnima Kaul Tiku India
Final Approval by: Prof. Min-Hsiung Pan


Web of Science Coverage
Emerging Sources Citation Index (ESCI)
2024 Journal Impact Factor: 1.1
Scopus Journal Metrics
CiteScore 2025: 2.6
CiteScore Details
Sustainable Nutrition: Food Systems, Nutrient Retention, and Public Health Impact
![]()
This journal is a member of, and subscribes to the principles of, the Committee on Publication Ethics (COPE)


