In vivo anti-hypercholesterolemic effect of buttermilk, milk fat globule membrane and Enterococcus faecium FFNL-12
Khaled ElSaadany1*
1Functional Foods and Nutraceuticals Laboratory (FFNL), Department of Dairy Science and Technology, Faculty of Agriculture, Alexandria University, Alexandria, Egypt.
2Dairy Research Department, Food Technology Research Institute, A.R.C., Cairo, Egypt.
Corresponding Author Email: elsaadany12@yahoo.com
DOI : http://dx.doi.org/10.12944/CRNFSJ.7.2.21
Download this article as:
![]()
The present study was undertaken to evaluate the hypocholesterolemic activity of buttermilk, milk fat globule membrane (MFGM) and Enterococcus faecium FFNL-12 in rat model. Thirty-sixth male Abino rats were divided into six groups. The first one (coded as G1) was fed a standard diet containing 10% corn oil as fat source while remaining five (coded G2 to G6) were fed hypercholesterolemic diets in which oil was replaced with animal grease. Animals subjected to treatment G1 served as healthy control while those in G2 were assigned as hypocholesterolemic animals which did not receive any treatment. The remaining experimental groups were designed to assess the hypocholesterolemic effect of intragastric adminstartion of dose of 109 CFU/Kg body weight of Enterococcus faecium FFNL-12 (G3), Enterococcus faecium FFNL-12/butter milk (G4), buttermilk (G5) and milk fat globule membrane (MFGM).
After four weeks, animals were evaluated in relation to growth, fecal pH, organs weight, serum lipid profile, antioxidant activity of liver tissue, liver and heart function and liver histopathological architecture. Results revealed that animals fed hypercholesterolemic diet (G2-G6) had significantly lower faecal pH and liver weight compared with those fed standard diet (G1). Treatments applied to animals fed hypercholesterolemic diet with the above mentioned additions (G3 to G6) appeared to improve both cardiac and hepatic functions, serum lipid profile and glucose concentration and liver histopathological architecture compared with animals subjected to G2 treatment. In most cases, treatment with MFGM appeared to be the most effective to avoid adverse effects associated to feeding hypercholesterolemic diet. MFGM fraction as well as E. faecium FFNL-12/buttermilk combination were effective in reducing serum lipids and glucose levels to the normal range. This combination also had potential antioxidant activity and ability to improve liver and heart functions.
Buttermilk; Enterococci; Hypocholesterolemia; Mfgm; Probiotics
Introduction
Cholesterol plays a vital role in human body as the precursor for synthesis of steroid hormones and bile acids. In addition, it is one of main components of cell membranes where it plays essential role in their structural integrity. Cholesterol is circulating in the blood stream in lipoproteins form. The elevated level of cholesterol in blood “hypercholesterolemia” is usually attributed to obesity and consumption of diet containing high levels of saturated fats in addition to inherited factors.1 hypercholesterolemia is considered to be one of the main causes of atherosclerosis and cardiovascular diseases.
The prevalence of cardiovascular disease increases steadily worldwide and is considered the leading global cause of death. The American Heart Association and the National Institutes of Health reported that cardiovascular disease would be responsible for 23.6 million deaths by 2030.2 Cardiovascular diseases were responsible for 39% of all deaths in Egypt in year 20083 (World Health Organization).
In attempt to control hypercholesterolemia, considerable attention has been given to develop wide varieties of functional foods with potential hypocholesterolemic effect. Numerous studies have been dealt with the possible role of dairy products to control cholesterol concentration in patients with hypercholesterolemia. Among products, buttermilk, one of the oldest functional foods, appears to have potential hypocholesterolemic effect due to its unique composition and high content of phospholipids and milk fat globule membrane (MFGM).4 Indeed, several studies have been reported on the potential hypocholesterolemic effect of buttermilk using either in vitro and in vivo models or clinical trials.5-9 Also, many studies have confirmed the potentiality of a wide variety of probiotics to control hypercholesterolemia.10-12
In recent study, the experimental animals which were fed with 3 mL and 2 mL of soy milk fermented by probiotic starter consists of Streptococcus thermophilus, Lactobacillus acidophilus LA-5, and Bifidobacterium bifidum Bb-12 for 40 days, showed that the rate of cholesterol and triglyceride decreasing in T1treatment compared with sample control.13
The present study aimed to evaluate the hypocholesterolemic effect of buttermilk, Enterococcus faecium FFNL12 and MFGM in rats.
Material and Methods
Buttermilk
Fresh sweet cows’ buttermilk (pH 6.1±0.1) was obtained from dairy pilot plant, Alexandria University. It was dried by spray drier (Edipon international, 28918 LEGANES, Madrid, Spain). The gross chemical composition of buttermilk was 0.53% ash, 2.57% fat, 2,95% protein and phospholipids content of 8.67mg/100 ml.
Preparation of milk fat globule membrane (MFGM)
MFGM was prepared from sweet buttermilk according to the method described by Rombaut (2007).14 Briefly, pH of buttermilk was adjusted at 5.2 and zinc acetate was added to obtain final concentration of 30 mM. The mixture was incubated at 30ºC for 1 h for complete precipitation of MFGM.15 The precipitate was collected by filtration through cheese cloth, washed with water and centrifuged at 6000 rpm for 10 min. The pellet was collected, flashed with nitrogen and kept at -80°C.
Phospholipids Content
Phospholipids in milk fat globule membrane fraction and buttermilk were extracted according to the method described by Albrinks (1959)16 using solvent mixture composed of chloroform: methanol (2:1 v/v). An equal volume of ammonium ferrothiocyanate (N/10) was added and the optical density was then read at 488 nm using PG Instruments Limited, T80 (double beam UV/Vis spectrophotometer, England). For quantification of phospholipids, serial concentrations of L- α-phosphatidylcholine (Sigma 61755-275G, from egg yolk, USA, product in China) were prepared and treated in the same manner as samples.
Bacterial Strain
Enterococcus faecium FFNL12 (E. faecium FFNL12) strain was obtained from functional foods and nutraceuticals culture collection, Faculty of Agriculture, Alexandria, Egypt.
In vivo study
Animals
Thirty six ten-week old male albino rats (170-200 g) were obtained from the animal house of the Institute of Graduate Studies and Research (IGSR), Alexandria University. The study approved by the Ethical Committee, the Institutional Animal Care and Use Committee (IACUC) at Alexandria University.Animals were housed 6 per cage and kept under proper environmental condition and maintained at 25±1°C with 12 h dark and light on cycle and room humidity was round 50±5%. Standard diet was prepared according to the guide of American institute of nutrition (Table 1). Diet and tap water were provided ad libitum. In order to induce hypercholesterolemia, corn oil in the standard diet was replaced by animal grease at the same ratio.17
Table 1: Formulation of experimental diets
| Diet ingredients | Percentage (%) |
| Soya protein (47%) | 30 |
| Corn | 45.5 |
| Barley | 10 |
| Corn oil or animal grease | 10 |
| Mineral mixture | 3.5 |
| Vitamin mixture | 1 |
Experimental Design
After two weeks of acclimatization, the animals were divided into six equal groups (6 animals per group). Animals belonging to groups 2 to 6 were fed hypercholesterolemia inducing diet for 2 weeks prior to starting the experiment. Animals assigned to different experimental groups are given in Table (2).
Buttermilk and MFGM fraction were administrated to animals in order to deliver 0.11% (w/w) phospholipids to each animal as recommended by (Simon 2009).18 Dried buttermilk was reconstituted in sterilized distilled water at 10% (w/w). Based on phospholipid content of buttermilk and MFGM determined early in the present study, a volume equivalent to the required dose of phospholipids was diluted in a sterilized saline solution and the final volume was adjusted to 0.5 ml representing the administrated dose for one animal. For the administration of bacterial cells to animals, freshly bacterial suspension was prepared by propagation of the Enterococcus faecium FFNL-12 in MRS media at 37°C for 16 hrs. The culture was then centrifuged at 6000 xg for 15 min at 4°C. The bacterial pellet was washed twice with sterile saline solution (0.85% NaCl), centrifuged at 6000 xg for 15 min and re-suspended in sterilized saline. The bacterial count was obtained by plating serial dilution samples on MRS agar medium and incubated at 37°C for 48 hrs. Bacterial suspension equivalent to 109 CFU/kg of animal body weight was prepared in 0.5 ml sterilized saline prior to administration to animal. The experiment lasted for 28 days.
Table 2: Animal groups assigned in the present study
| Animal groups*1 | Diets | Treatments | ||||
| Standard | Hypercholesterolemic | None | E. faecium FFNL-12 | Buttermilk | MFGM | |
| G1 | + | + | ||||
| G2 | + | + | ||||
| G3 | + | + | ||||
| G4 | + | + | + | |||
| G5 | + | + | ||||
| G6 | + | + | ||||
*1 G1: control stdandard diet, G2: control hypercholesterolemic diet, G3: each animal received daily intra-gastric dose of 109 CFU/Kg body weight of E. faecium (FFNL-12), G4: each animal received daily intra-gastric dose of 109 CFU/Kg body weight of E. faecium and buttermilk containing 0.11% phospholipids, G5: each animal received daily intra-gastric dose of buttermilk containing (0.11%, w/w) phospholipids and G6: each animal received daily intra-gastric dose of milk fat globule membrane fraction (MFGM) containing (0.11%, w/w) phospholipids.
Measured Parameters
- Faecal pH determinationFaecal samples of each experimental group were collected weekly, diluted one-tenth in deionised water and subjected to pH measurement using pH meter (Crison instuments, S.A., E-08328 ALELLE- Barcelona, Spain).
- Determination of body and organs weights
Gain weight of each animal was determined weekly and results were expressed as total weight gained through the entire experiment according to the following equation:
Gain weight = Wf – W0.
Wf was the final weight recorded at the end of the experiment and W0 was the initial weight recorded at the beginning of the experiment.
At the end of the experiment, animals were fasted for an overnight and lightly anaesthetized with diethyl ether. Rats were sacrificed and organs (liver, kidney, brain, lung, heart and testis) were immediately removed, washed twice with saline solution, dried using tissue paper, weighed and stored at -80°C until used. Fresh liver tissues were subjected to histological analysis directly after they had been excised from animals.
Sera Preparation
Blood samples were collected in plastic tubes and placed at room temperature for 30 min. Serum was obtained by centrifugation of samples at 3,000 xg for 20 min at 4ºC. The sera were pipetted, kept in 1.5 ml microtube and stored at -80ºC until the assays of biochemical parameters and enzyme activities.
Glucose Determination
Serum glucose levels were determined by enzymatic GOD-POD method as described by Braham and Trinder (1972).19
Determination of Lipid Profile
The concentrations of total lipids, total cholesterol (TC) and triglycerides (TC) in the sera were determined as previously described.20-22 High-density lipoprotein-cholesterol (HDL) was determined according to the method of Grove (1979).23 Low-density lipoprotein-cholesterol (LDL) was determined by the calculation (LDL) = (cholesterol- (HDL+V-LDL)) according to Fridewald (1972).24 Very low-density lipoprotein-cholesterol (V-LDL) was calculated by dividing the values of TG by factor of 5 according to the method described by Friedewald et al.,24
Liver thiobarbituric acid-reactive substance (TBARS) content
After excision, livers were weighted, immediately washed using chilled saline solution, dried with tissue paper and stored at -80°C until the homogenization process.
Frozen liver were minced and homogenized (10% w/v) in ice cold sucrose buffer (0.25 M to make a 1:10 suspension) in a Wise Tis® HG-15D Homogenizer, DAIHAN-SCIENTIFIC, India. The homogenate centrifuged at 10,000 xg for 30 min at 4°C. The resultant supernatant was then stored at -80°C. The liver homogenates were used for the analysis of free radicals determination. Lipid peroxidation was measured as Thiobarbituric acid-reactive substances liver tissue by the method of Tappel and Zalkin, (1959).25
Liver Function
The alkaline phosphatase (ALP) activity in the serum was assayed by a kinetic method using commercial kits (Bio Systems S.A Costa Brava 30, Barcelona, Spain) according to the method of the International Federation of Clinical Chemistry.26 The acid phosphatase (ACP) activity in the serum was assayed by a kinetic method using commercial kits (Abbott Clinical Chemistry, USA) according to the method of Bergmeyer (1985).27
Cardiac Function
The creatine kinase activity in the serum was assayed by a kinetic method using commercial kits (Spectrum Co. Cairo, Egypt) according to the method of the International Federation for Clinical Chemistry.28 Lactate dehydrogenase (LDH) activity was determined in the serum by the kinetic method using available commercial kits (Vitro Scientist, Cairo, Egypt) according to the method described by Moss (1987).29
Liver Histology
Liver tissues were excised and fixed in neutral buffered formalin 10% for 14-18 hr and then dehydrated through ascending grades of ethyl alcohol until they reached the absolute alcohol (1hr). The fixed tissues were sectioned at 4 to 5 mm thickness. Tissue sections were collected on glass slides, deparaffinized and stained with Hematoxylin and Eosin stain.30 The sections are then examined and observed under light microscope at 400X magnification.
Statistical Analysis
Statistical analysis was performed using the SPSS 25.0 software (Statistical Package for Social Sciences, USA). Analysis of variance (ANOVA) of the data was conducted and means for property values were separated (P ≤ 0.05) with Student-Newman-Keuls (SNK) and Duncan multiple range tests. Differences were considered significant at P ≤ 0.05.
Results and Discussion
Phospholipids of buttermilk and MFGM
Phospholipids concentration of buttermilk was 8.67 mg/100g, which was lower than the value of 13 mg/100g reported by Conway (2014).31 On the other hand, phospholipids content of MFGM was 13.5 mg /100g, which was similar to that reported previously by Gille (2011).32
In vivo study
Faecal pH
The evolution of faecal pH of different groups of animals is shown in Table 3. Faecal samples collected from animals fed cholesterol inducing diet (G2 to G6) had significantly lower pH value compared with samples from animals fed standard diet (G1). Among hypercholesterolemic groups, faecal samples from G2 had the lowest pH value while animals subjected to G5 showed the highest values, which were closest to those of healthy animals (G1). Similarly, fat-enriched diets have been found to increase acidity in faecal materials collected from rats.33
Table 3: Evolution of faecal pH values of hypercholesterolemic rats subjected to different experimental groups. Data are expressed as mean values ± standard error.
| Animal groups*1 | Experimental stage | ||||
| 0*2 week | 1week | 2weeks | 3weeks | 4weeks | |
| G1 | 7.87±0.02a | 7.67±0.02a | 7.71±0.01a | 7.78±0.01a | 7.81±0.01a |
| G2 | 7.15±0.15b | 7.09±0.01b | 7.06±0.06d | 7.31±0.10b | 7.35±0.05c |
| G3 | 7.20±0.10b | 7.15±0.15b | 7.19±0.05c | 7.26±0.05b | 7.76±0.06a |
| G4 | 7.21±0.10b | 7.44±0.09ab | 7.39±0.01b | 7.37±0.04b | 7.57±0.05b |
| G5 | 7.20±0.10b | 7.47±0.05ab | 7.53±0.03b | 7.70±0.03a | 7.80±0.03a |
| G6 | 7.15±0.15b | 7.29±0.04b | 7.40±0.05b | 7.43±0.04b | 7.67±0.01ab |
*1G1: control standard diet, G2: control hypercholesterolemic diet, G3: each animal received daily intra-gastric dose of 109 CFU/Kg body weight of Enterococcus faecium (FFNL-12), G4: each animal received daily intra-gastric dose of 109 CFU/Kg body weight of Enterococcus faecium and buttermilk containing 0.11% phospholipids, G5: each animal received daily intra-gastric dose of buttermilk containing (0.11%, w/w) phospholipids and G6: each animal received daily intra-gastric dose of milk fat globule membrane fraction (MFGM) containing (0.11%, w/w) phospholipids.
*2Measurements were recorded in faecal samples collected just prior to starting intra-gastric administration of different treatments.
Different letters in the same column indicate significant differences according to Duncan’s test (P≤0.05).
Body gain and the organs weights
Data concerning the body gain and organs weights of different animal groups are presented in Table 4. Results showed that there were significant differences in gain weights among experimental groups and control group. In general, feeding hypercholesterolemia inducing diet (G2-G6) caused significant increase in body gain weight and G2 had the highest increase. Animals with hypercholesterolemia subjected to groups G3 to G6 had gain weights higher than those of healthy animals (G1) but lower than weights recorded for animals in G2.Similar studies also reported that hypercholesterolemic diet-fed mice gained significantly more weight than standard diet-fed mice.34,35
On the other hand, there were significant differences in absolute weights of different organs among animal groups. The major changes were found for liver, heart, lung and spleen weights, while kidney, brain and testis were less affected. In general, feeding animals on hypercholesterolemia inducing diet led to significant reductions in the absolute weights of liver, heart and lung.36
Table 4: Body gain and organs weight (g) of control and hypercholesterolemic rats. Data are expressed as mean values ± standard error.
| Animal group*1 | Gain weight | Liver | Heart | Kidney | Brain | Testis | Lung | Spleen |
| G1 | 32±1.67i | 8.14±0.79d | 1.00±0.06bcd | 1.72±0.11ab | 1.65±0.1abc | 2.89±0.17bcde | 1.93±0.12ab | 1.24±0.12abc |
| G2 | 62±1.67a | 7.28±0.66e | 0.79±0.07e | 1.65±0.02abc | 1.65±0.033bac | 3.01±0.07bc | 1.70±0.052cd | 1.04±0.10bc |
| G3 | 47±1.67g | 7.21±0.21e | 0.84±0.01de | 1.68±0.02abc | 1.48±0.16c | 2.73±0.2cde | 1.62±0.03cde | 0.99±0.04c |
| G4 | 55±2.89d | 7.25±0.01e | 0.79±0.02e | 1.67±0.12abc | 1.52±0.035bc | 2.83±0.2cde | 1.78±0.17cb | 0.99±0.16c |
| G5 | 58±1.67c | 8.03±0.43d | 0.86±0.033cde | 1.59±0.03bc | 1.59±0.06abc | 3.33±0.20a | 1.59±0.12cde | 0.96±0.10c |
| G6 | 43±6.02h | 5.90±0.25f | 0.80±0.015e | 1.5±0.14bc | 1.5±0.07bc | 2.84± 0.1cde | 1.68± 0.18cd | 1.36±0.1ab |
*1G1: control standard diet, G2: control hypercholesterolemic diet, G3: each animal received daily intra-gastric dose of 109 CFU/Kg body weight of Enterococcus faecium (FFNL-12), G4: each animal received daily intra-gastric dose of 109 CFU/Kg body weight of Enterococcus faecium and buttermilk containing 0.11% phospholipids, G5: each animal received daily intra-gastric dose of buttermilk containing (0.11%, w/w) phospholipids and G6: each animal received daily intra-gastric dose of milk fat globule membrane fraction (MFGM) containing (0.11%, w/w) phospholipids.
Different letters in the same column indicate significant differences according to Duncan’s test (P≤0.05).
Serum Glucose
Levels of serum glucose found in animals of different groups after 28 days of experiment are presented in Table 5. In general, feeding hyperchelesterolemic diet (G2-G6) resulted in significant increase in serum glucose concentration. Animals subjected to G2 treatment had serum glucose concentration of 127.77 while healthy animals in G1 had 79.73 mg/dl. Similarly, Sörhede and Ahrén (2004)35 reported that mice fed high-fat diet had higher serum glucose concentration compared with those fed standard diet. Islam (2014)37 reported that the inclusion of butter at 10 or 20% into the standard diet caused significant increase in plasma glucose concentration and this effect was proportionally correlated with the level of added butter. On the other hand, animals subjected to treatments G3 to G6 had glucose concentration ranging from 103.13 to 87.13 mg/dl. Among treatments, MFGM appeared to be the most effective to reduce serum glucose level followed by E. faecium FFNL-12/buttermilk combination, E. faecium FFNL-12 and buttermilk, respectively. At the end of the experiment, serum glucose level of different groups was in the following descending order G2 > G5 > G3 > G4 > G6 > G1, respectively. A previous clinical study indicated that MFGM could exert antidiabetic and hypocholesterolemic effect in over-weight obese men and women.38 This study reported that the addition of a dairy fraction rich in MFGM attenuated the negative effects of a high saturated fatty acid meal by reducing postprandial cholesterol, inflammatory markers and insulin response.
Serum Lipid Profile
Hypercholesterolemic diet used in this study appeared to induce efficiently both hypercholesterolemia and hypertriglyceridemia in rats. These terms refer to the presence of higher levels of cholesterol and triglycerides, respectively, in the blood compared with normal concentrations.39 Similarly as in our study, Harini and Astirin (2009)40 reported that hypercholesterolemic diet could be formulated by replacing vegetable oil in the standard diet with 10% animal lard. Animal lard is known to contain high concentration of triglycerides of saturated fatty acids which can increase blood cholesterol and triglycerides.17 The effect of different treatments on serum lipids, including triglyceride (TG), total cholesterol (TC), high density lipoprotein (HDL) cholesterol, low density lipoprotein (LDL) cholesterol, and very-low density lipoprotein (V-LDL) cholesterol of hyperlipidemic rats are presented in Table 5.
Triglycerides
The replacement of corn oil in standard diet with animal grease appeared to increase concentration of serum level of triglycerides from 94.61 (G1) to 136.11 (G2) mg/dl. High serum triglycerides had been shown to be an underlying cause of several putative lipid risk factors for coronary heart disease.41 The serum levels of triglycerides in animals subjected to treatments G3 to G6 were ranging from 88.07 to 132.47 mg/dl which were significantly lower than 136.11 mg/dl found in animals belonged to G2. The administration of MFGM (G6) appeared to be the most effective treatment to reduce risk for the development of hypertriglyceridemia. An average concentration of 88.07 mg/dl was found in serum of animals subjected to G6 which was significantly lower than 94.61 mg/dl for healthy animals (G1). At the end the experiment, the levels of serum triglycerides were in the following order, G2 > G3 > G4 > G5 > G1 > G6, respectively.
TC, HDL, LDL and VLDL
The serum levels of total cholesterol in animals subjected to treatments G3 to G6 were ranging from 84.15 to 111.43 mg/dl, which were significantly lower than 128.51 mg/dl found in animals in G2. The administration of MFGM (G6) appeared to be the most effective treatment to reduce risk for the development of hypercholesterolemia. At the end of the experiment, an average concentration of 84.15 mg/dl was found in serum of animals subjected to G6 which was significantly close to 83.16 mg/dl for healthy animals (G1). The levels of serum total cholesterol determined at the end of the experiment were in the following descending order, G2 > G3 > G5 > G4 > G6 > G1, respectively.
The serum levels of good cholesterol, HDL cholesterol, in animals subjected to treatments G3 to G6 were ranging from 24.54 to 48.32 mg/dl which were significantly higher than 20.28 mg/dl found in animals of G2. This finding is correlated with the reduction in total cholesterol concentrations in the same groups. Again the administration of MFGM proved to be effective to reduce risk for the development of hypercholesterolemia by increasing the HDL cholesterol. An average concentration of 48.32 mg/dl was found in serum of animals from G6, which was significantly higher to 27.20 mg/dl for healthy animals (G1). The levels of serum HDL cholesterol among different groups were in the following order, G6 > G5 > G1 > G3 and G4 > G2, respectively. On the other hand, it has been proven recently (according to research presented at European Society of Cardiology Congress held in 2018) that very high levels of high-density lipoprotein (HDL or “good”) cholesterol may be associated with an increased risk of heart attack and death (https://www.sciencedaily.com/releases/2018/08/180825081724.htm).
The serum levels of bad cholesterol, LDL, in animals subjected to treatments G3 to G6 were ranging from 18.22 to 60.42 mg/dl which were significantly lower than 77.01 mg/dl found in animals belonged to G2. Results also revealed that the administration of MFGM to G6 reduced the concentration of LDL cholesterol. An average concentration of 18.22 mg/dl was found in serum of animals subjected to G6 which, was significantly lower than 37.00 mg/dl for healthy animals G1. The levels of serum LDL cholesterol were in the following order, G2 > G5 and G3 > G4 > G1 > G6, respectively.
The serum levels of very low density cholesterol, considered also as bad cholesterol, in animals subjected to treatments in G3 to G6 were ranging from 17.61 to 26.49 mg/dl which were significantly lower than 27.22 mg/dl found in animals reported for G2. Among treatments, the administration of MFGM (G6) was correlated with the lowest concentration of VLDL cholesterol with an average concentration of 17.61 mg/dl which was significantly lower than 18.92 mg/dl for healthy animals (G1). The levels of serum VLDL were in the following order, G2 > G3 > G4 > G5 > G1 > G6, respectively.
The hypocholesterolemic effect, expressed as reduction in TC, HDL and VLDL, of buttermilk (G4 and G5) and MFGM (G6) reported in this study could be attributed to the affinity of sphingomyelin (main milk phospholipid) to cholesterol molecules.42 The complex sphingomyelin-cholesterol is known to be hydrolysed slowly in the gastrointestinal tract43 . This slowness in hydrolysis along with strong chemical affinity between cholesterol and sphingomyelin are believed to be responsible for reduction of cholesterol absorption in the gastrointestinal tract.44 A previous study on MFGM indicated its ability to attenuate the negative effects due to the consumption of a high-saturated fatty acid meal by reducing postprandial cholesterol, probably due to its high phospholipids content.38
On the other hand, E. faecium FFNL-12 exhibited an effective hypocholesterolemic effect either when administrated alone (G3) or in combination with buttermilk (G4). An enterococccal strain with potential cholesterol-lowering activity had been isolated from stool of healthy infants and identified as E. faecium WEFA23-.45 This strain proved to be safe by acute oral administration in mice. This strain proved also to improve metabolic syndromes in rats including obesity, hyperlipidemia, hyperglycemia and insulin resistance. Our recent study on
E. faecium FFNL-12 indicated the ability of this strain to assimilate approximately 92% of cholesterol molecules present in its growth medium.46
Table 5: Serum glucose, triglycerides (TG), total cholesterol (TC), high-density lipoprotein-cholesterol (HDL), low-density lipoprotein-cholesterol (LDL) and very low-density lipoprotein-cholesterol (VLDL) concentration (mg/dl) of control and hypercholesterolemic rats. Data are expressed as mean values ± standard error.
| Animal groups*1 | Glucose | TG | TC | HDL | LDL | VLDL |
| G1 | 79.73±5.00k | 94.61±0.98h | 83.16±2.45k | 27.20±3.83h | 37.00±2.19e | 18.92±0.20h |
| G2 | 127.77±1.94a | 136.11±1.24b | 128.51±3.34b | 20.28±0.7k | 77.01±2.44b | 27.22±0.25b |
| G3 | 97.60±2.39c | 132.47±3.86c | 111.43±5.07d | 24.60±6.89h | 60.34±6.32c | 26.49±0.77cb |
| G4 | 93.87±1.89e | 116.47±1.67e | 102.40±2.94e | 24.54±2.53i | 58.56±4.12d | 23.29±0.33d |
| G5 | 103.13±2.20b | 101.82±2.27g | 109.77±7.32c | 28.99±1.89g | 60.42±7.18c | 20.36±0.45e |
| G6 | 87.13±0.52f | 88.07±1.93j | 84.15±1.95j | 48.32±4.20b | 18.22±4.23h | 17.61±0.39f |
*1G1: control standard diet, G2: control hypercholesterolemic diet, G3: each animal received daily intra-gastric dose of 109 CFU/Kg body weight of Enterococcus faecium (FFNL-12), G4: each animal received daily intra-gastric dose of 109 CFU/Kg body weight of Enterococcus faecium and buttermilk containing 0.11% phospholipids, G5: each animal received daily intra-gastric dose of buttermilk containing (0.11%, w/w) phospholipids and G6: each animal received daily intra-gastric dose of milk fat globule membrane fraction (MFGM) containing (0.11%, w/w) phospholipids.
Different letters in the same column indicate significant differences according to Duncan’s test (P≤0.05).
Liver Function Markers
Serum levels of alkaline phosphatase (ALP) and acid phosphatase (ACP) were considered as markers for liver function. The serum levels of ALP in hypercholesterolemic groups (G3 to G6) were ranging from 175.33 to 199.00 U/L, which were significantly lower than 227.33 mg/dl found in animals belonged treatment G2 (Table 6). Among treatments, MFGM (G6) caused the lowest increase in serum levels of ALP with an average concentration of 175.33 U/L, which was significantly higher than 165.00 U/L for healthy animals (G1). Generally, the levels of serum ALP among treatments were in the following order, G2 > G3 > G5 > G4 >G6 > G1, respectively.
On the other hand, the levels of serum ACP in hypercholesterolemic groups (G3 to G6) were ranging from 12.25 to 16.68 U/L which were significantly lower than 25.40 mg/dl found in animals belonged to G2. Similarly to ALP, MFGM caused the lowest increase in concentration of ACP among hypercholesterolemic groups. The administration of MFGM resulted in significant reduction in the level of ACP to 12.25 U/L versus 25.40 U/L for animals in G2. Generally, the levels of serum ACP were in the following order, G2 > G5 > G3 > G4 > G6 > G1, respectively.
Cardiac Function Markers
The serum levels of creatine kinase-MB (CK-MB) in animals subjected to treatments G3 to G6 were ranging from 40.47 to 52.49 U/L, which were significantly lower than 56.20 U/L found in animals subjected to treatment G2 (Table 6). The administration of MFGM led to the lowest level in activity (40.47 U/L) of CK-MB, compared with untreated animals in G2, which may indicate its possible role to reduce risk for the cardiovascular (CDV) diseases. The activity of CK-MB in the serum was in the following order, G2 > G5 > G3 > G4 >G6 > G1, respectively. Creatine kinase is considered to be a sensitive marker of muscle damage and cardiac injury.47 It has also been used either to confirm or exclude acute myocardial infarction in humans due to its high specificity for the cardiac muscle.48 In the present study, MFGM, buttermilk and E. faecium FFNL-12 appeared to attenuate the negative effects of a hypercholesterolemic diet by reducing levels of CK-MB. The most remarkable effect resulted from the administration of MFGM followed by E. faecium FFNL-12/buttermilk combination and E. faecium FFNL-12, respectively.
The serum levels of lactate dehydrogenase (LDH) in animals subjected to treatments G3 to G6 were ranging from 88.96 to 119.66 U/L, which were significantly lower than 132.88 U/L found in animals belonged to G2 (Table 6). In general, hypercholesterolemic diet resulted in significant increase in serum activity of LDH. Similarly, Kim (2016)49 reported that hypercholesterolemic diet caused significant increase in serum LDH in rats. The administration of MFGM appeared to be the most effective to reduce activity in LDH in serum of animals subjected to G6. An average concentration of 88.96 mg/dl was found in serum of animals subjected to G6, which was significantly lower than 91.37 U/L for healthy animals (G1). In general, the levels of serum LDH were in the following order, G2 > G3 > G5 > G4 >G1 > G6, respectively.
Antioxidant Markers
The values of thiobarbituric acid-reactive substance (TBARS) contents in liver tissues of different animals are presented in Table 6. Animals belonged to treatments G3 to G6 had TBARS values ranging from 3.77 to 6.8 mg/dl, which were significantly lower than 12.63 mg/dl found in animals subjected to treatment G2. The administration of E. faecium FFNL-12/buttermilk (G4) appeared to be the most effective treatment to reduce risk for the development of oxidation stress. Animals of G4 treatment had TBARS concentration of 3.77 mg/dl. The levels of liver TBARS were in the following descending order, G2 > G6 > G5 > G3 > G4 > G1, respectively. It has been recognized for long that the consumption of high-fat diet induce oxidative stress expressed by the induction of TBARS in liver tissue.50-52 Feeding animals on high saturated fat diet (e.g., containing lard) as in the present study appeared to reduce the hepatic antioxidant enzymes, and increase the levels of lipid peroxidation products and TBARS values in the liver and plasma.50,51 Some peptides derived from MFGM, e.g., butyrophilin, have been found to exert antioxidant activity in buttermilk6. This derived peptide and others might be responsible for the reduction in TBARS values in animals fed buttermilk or MFGM (G4, G5 and G6) compared with animals subjected to G2.
The antioxidant activity E. faecium FFNL-12 reported in this study was evident as the administration of this strain either alone (G3) or in combination with buttermilk (G4) resulted in significant reduction in TBARS values compared with values for animals subjected to G2. Similarly, sixteen strains of E. faecium, isolated from meat and dairy products, have been shown to exert antioxidant activity as determined by TBARS53 . The antioxidant activity has been found in the culture supernatant of each strain but the responsible molecules have not been identified yet.
Table 6: Thiobarbituric acid-reactive substance (TBARS), alkaline phosphatase (ALP), acid phosphatase (ACP), creatine kinase-MB (CK-MB) and lactate dehydrogenase (LDH) activities of control and hypercholesterolemic rats. Data are expressed as mean values ± standard error.
| Animal groups*1 | ALP *2(U/L) | ACP*2(U/L) | CK-MB*2(U/L) | LDH*2(U/L) | TBARS*3(nmol/g) |
| G1 | 165.00±4.94f | 12.25±1.04g | 27.34±1.62h | 91.37±7.50g | 1.03±0.40k |
| G2 | 227.33±6.39a | 25.40±1.96a | 56.20±3.01a | 132.88±2.66a | 12.63±1.13a |
| G3 | 199.00±4.05b | 15.96±0.71c | 47.70±1.74c | 119.66±0.68b | 6.30±0.49d |
| G4 | 184.00±5.51d | 14.77±1.90d | 43.30±3.00d | 107.53±1.49d | 3.77±0.61f |
| G5 | 189.00±3.22c | 16.68±1.13b | 52.49±1.48b | 116.75±1.73c | 6.50±1.04c |
| G6 | 175.33±5.70e | 12.25±1.04g | 40.47±1.91e | 88.96±0.73h | 6.8±0.21b |
*1G1: control standard diet, G2: control hypercholesterolemic diet, G3: each animal received daily intra-gastric dose of 109 CFU/Kg body weight of Enterococcus faecium (FFNL-12), G4: each animal received daily intra-gastric dose of 109 CFU/Kg body weight of Enterococcus faecium and buttermilk containing 0.11% phospholipids, G5: each animal received daily intra-gastric dose of buttermilk containing (0.11%, w/w) phospholipids and G6: each animal received daily intra-gastric dose of milk fat globule membrane fraction (MFGM) containing (0.11%, w/w) phospholipids.
*2Measurements were done in serum.
*3Measurments were done in liver homogenates.
Different letters in the same column indicate significant differences according to Duncan’s test (P≤0.05).
Histopathological Examination
Histopathological examination of liver tissues of healthy and hypercholesterolemic animals was conducted at the end of experiment to get in sight into the effect of different treatments on liver histology and function (Figure 1). Photo (1A) shows histological characteristics of liver sections from animals fed standard diet (G1). It was obvious that these animals had normal hepatic cells, distinct architecture with sinusoidal space and clear central vein.54 Meanwhile, no signs of inflammation, fibrosis and steatosis could be seen throughout visualised sections. Hepatocytes appeared uniformly in shape and size and intact with the presence of well integrated nucleus. This structural characteristic was similar to that reported by Bisar (2017)55 who described the normal hepatic structure as radiating plates, strands of cells forming a network around the hepatic central vein.
On the other hand, induction of hypercholesterolemia appeared to result in significant modifications in liver histological structure. Examination of liver sections of hypercholesterolemic rats indicated the loss of normal architecture found in healthy animals. The histopathological characteristics of livers from animals subjected to G2 revealed the presence of hepatocellular injury, inflammation, dilation in central vein, moderate fibrosis and leucocytic infiltration around the central vein Figure (1B). A previous study indicated that feeding rats on high-fat and high-cholesterol diet could develop obvious fibrosis, steatosis and inflammation with hepatocyte ballooning and might initiate liver cirrhosis compared with standard diet.56 Hypercholesterolemic rats subjected to treatments G3 to G5 shared the same structural characteristics with G2 animals but to lesser extent Figure (1-C, D, E and F). This may indicate the potential hypocholesterolemic effect of different treatments applied to animals in G3 to G6. However, animals administrated MFGM had histopathological architecture identical to that of healthy animals. Also, the administration E. faecium FFNL-12/buttermilk (G4) resulted in remarkable amelioration in liver histopathological architecture. This combined treatment was more effective than the application of either E. faecium FFNL-12 (G3) or buttermilk (G5) alone.
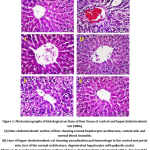 |
Figure 1: Photomicrographs of histological sections of liver tissue of control and hypercholesterolemic rats (400x). Click here to View figure |
Conclusion
The potential hypocholesterolemic ability of strain Enterococcus faecium FFNL-12 (E. faecium FFNL-12) reported in this study makes it promising candidate to be used for the preparation of probiotic supplements or as an adjunct culture in making fermented dairy products.
Also we concluded that MFGM fraction as well as E. faecium FFNL-12/buttermilk combination were effective in reducing serum lipids and glucose levels to the normal range. This combination also had potential antioxidant activity and ability to improve liver and heart functions. Thereby, the development of fermented buttermilk based functional product could be recommended to deliver health benefits to human body, including antioxidant activity, lowering blood cholesterol and glucose levels and improvement of liver and heart functions.
Acknowledgments
The authors give thanks to Functional Foods and Nutraceuticals Laboratory (FFNL), Faculty of Agriculture, University of Alexandria, Alexandria, Egypt for supporting this research.
References
- Kane JP and Havel RJ. Disorders of the biogenesis and secretion of lipoproteins containing the B apolipoproteins. In: Scriver CR, Beaudet AL, Sly WS, Valle D, eds. The metabolic and molecular bases of inherited disease. 8th ed. New York: McGraw-Hill. 2001; Pp: 2717-2752.
- Verma, N. Introduction to hyperlipidemia and its treatment: A review. International Journal of Current Pharmaceutical Research. 2017; 9: 6-14.
CrossRef - World Health Organization: Egypt. World Health Organization –NCD Country Profiles. Available from: http://www.who.int/nmh/ countries/egy_en.pdf.
- Abdel-Haleem, H., Kheadr, E., Dabour, N., El-Saadany, K., El-Zieny, M. and Zedan, M. Buttermilk: one of the oldest functional foods. Egyptian Journal of Dairy Science. 2018a;46 (1): 11-30.
- Conway, V.; Gauthier, S.F. and Pouliot, Y. Effect of cream pasteurization, microfiltration and enzymatic proteolysis on in vitro cholesterol-lowering activity of buttermilk solids. Dairy Sci. Technol. 2010; 90:449.
CrossRef - Conway, V.; Couture, P.; Gauthier, S.F.; Pouliot, Y. and Lamarche, B. Impact of buttermilk consumption on plasma lipids and surrogate markers of cholesterol homeostasis in men and women. Nutr. Metab. Cardiovas. Dis. 2013; 23:1255.
CrossRef - Baumgartner, S., Kelly, E.R., van der Made, S., Berendschot, T.T., Husche, C., Lütjohann, D. and Plat, J. The influence of consuming an egg or an egg-yolk buttermilk drink for 12 weeks on serum lipids, inflammation, and liver function markers in human volunteers. Nutrition, 2013; 29: 1237-1244.
CrossRef - Rosqvist, F., Smedman, A., Lindmark-Mansson, H., Paulsson, M., Petrus, P., Straniero, S., Rudling, M., Dahlman, I. and Risérus, U. Potential role of milk fat globule membrane in modulating plasma lipoproteins, gene expression, and cholesterol metabolism in humans: a randomized study. Am. Journal of Clinical Nutrition. 2015; 102: 20-30.
CrossRef - Liutkevičius, A., Speičienė, V., Alenčikienė, G., Mieželienė, A., Narkevičius, R., Kaminskas, A., Abaravičius, J.A., Vitkus, D., Jablonskienė, V. and Sekmokienė, D. Fermented buttermilk-based beverage: impact on young volunteers’ health parameters. Czech Journal of Food Sciences. 2016; 34: 143-148.
CrossRef - Kumar, M., Nagpal, R., Kumar,R., Hemalatha, R., Verma, V., Kumar, A., Chakraborty, C. Singh, B., Marotta, F., Jain, S. and Yadav, H. Cholesterol-lowering probiotics as potential biotherapeutics for metabolic diseases. doi. 2012; 10.1155/2012/902917.
CrossRef - Wang, L., Guo, M.-J., Gao, Q., Yang, J.-F., Yang, L., Pang, X.-L. and Jiang, X.-J. The effects of probiotics on total cholesterol: a meta-analysis of randomized controlled trials. Medicine. 2018; 97: 5-12.
CrossRef - Sharma, S., Puri, S. And Kurpad, AV. Potential of probiotics in hypercholesterolemia: a review of in vitro and in vivo findings. Alternative Therapy in Health and Medicine. 2018; 24:36-43.
- Niamah, A. K., Sahi, A. A., and Al-Sharifi, A. S. Effect of Feeding Soy Milk Fermented by Probiotic Bacteria on Some Blood Criteria and Weight of Experimental Animals. Probiotics and Antimicrobial Proteins. 2017; 9(3), 284-291
CrossRef - Rombaut, R. and Dewettinck, K. Thermocalcic aggregation of milk fat globule membrane fragments from acid buttermilk cheese whey. Journal of Dairy Science. 2007; 90: 2665-2674.
CrossRef - Damodaran, S. Zinc-induced precipitation of milk fat globule membranes: a simple method for the preparation of fat-free whey protein isolate. Journal of Agricultural and Food Chemistry. 2010; 58: 11052-11057.
CrossRef - Albrink, M.J.. The micro-titration of total fatty acids of serum, with notes on the estimation of triglycerides. Journal of Lipid Research. 1959; 1: 53-59.
- Verd, J.C., Peris, C., Alegret, M., Díaz, C., Hernández, G., Vázquez M., Adzet, T., Laguna, J.C. and Sánchez, R.M. Different effect of simvastatin and atorvastatin on key enzymes involved in VLDL synthesis and catabolism in high fat/cholesterol fed rabbits. British Journal Pharm. 1999; 127: 1479-1485.
CrossRef - Simon, K. W., Roberts, P. C., Vespremi, M. J., Manchen, S. and Schmelz, E.M. Regulation of beta-catenin and connexin-43 expression: targets for sphingolipids in colon cancer prevention. Molecular Nutrition & Food Research. 2009; 53: 332-340.
CrossRef - Braham, D., and Trinder, P. Methods for determination of blood glucose level by spectrophotometer. Analyst. 1972; 97: 142-143.
CrossRef - Zollner, N. and Krish, K. Ueber die quantitative bestimnung von lipoiden (mikromethod) mittels der vielen naturlichel lipoiden (allen bekannten plasmalipoiden) gemeisamen sulphophospho-vanillin reaction. Z. Gesamte Exp. Med.1962; 135: 545-561.
CrossRef - Allain, C.C., poon, L.S., Chan, C.S.G., Richmond, W. and Fu, P.C. Enzymatic determination of total serum cholesterol. Clinical Chemistry journal, 1974; 20: 470-475.
- Fossati, P. and Prencipe, L. Serum triglycerides determined calorimetrically with an enzyme that produces hydrogen peroxide. Journal of Clinical Chemistry. 1982; 28: 2077-2080.
- Grove, T.H. The effect of reagent pH on determination of high-density lipoprotein cholesterol by precipitation of with sodium phosphotungstate-magnesium. Journal of Clinical Chemistry. 1979; 25: 560-564.
- Friedewald, W.T., Levy, R.I. and Fredrickson, D.S. Estimation of the concentration of low-density lipoprotein cholesterol in plasma, without use of the preparative ultracentrifuge. Journal of Clinical Chemistry. 1972; 18: 499-502.
- Tappel, A. L. and Zalkin, H. Inhibition of lipid peroxidation in mitochondria by vitamin E. Archives of Biochemistry and Biophysics. 1959; 80: 333-336.
CrossRef - Tietz, N. W., Rinker, A. D. and Shaw, L. M. IFCC methods for the measurement of catalytic concentration of enzymes Part 5. IFCC method for alkaline phosphatase (orthophosphoric-monoester phosphohydrolase, alkaline optimum, EC 3.1. 3.1). Journal of Clinical Chemistry and Clinical Biochemistry. Zeitschrift fur klinische Chemie und klinische Biochemie. 1983; 21: 731-748.
- Bergmeyer, H. U. (Ed.). Methods of Enzymatic Analysis, Methods of Enzymatic Analysis: Volume 8: Metabolites 3: Lipids, Amino Acids and Related Compounds (Vol. 8). Wiley-Blackwell. 1985.
- IFCC, Methods for the measurement of catalytic concentration of enzymes. part 7:IFCC method for creatine kinase. Japan Information and Culture Centre, 1989; 9: 130-139.
- Moss, D.W., Henderson, A. R. and Kachmar, J.F. Enzymes (3rd Ed.). In “Fundamentals of Clinical Chemistry”, Tietz, N.W.,(Ed.). Philadelphia, PA: Saunders, 1987; P: 346-421.
- Bancroft, J.D. and Gamble, M. Theory and practice of histological techniques. In: microorganisms, B. Swisher, (Editor), Churchill. Livingstone, Philadelphia, 2002; 325-344.
- Conway, V., Gauthier, S.F. and Pouliot, Y. Buttermilk: Much more than a source of milk phospholipids. Animal Frontiers. 2014; 4: 43-51.
CrossRef - Gille, D. The health aspects of buttermilk components. A review. Technical-scientific information. Agroscope Liebefeld-Posieux Research Station ALP CH-3003 Berne, nutrition@alp.admin.ch. No. 540 | November 2011. P: 4:22.
- Reddy, B.S., Weisburger, J.H. and Wynder, L.E. Effects of dietary fat level and dimethylhydrazine on fecal acid and neutral sterol excretion and colon carcinogenesis in rats. Journal of the National Cancer Institute. 1974; 52: 507-511.
CrossRef - Laurila, A., Cole, S.P., Merat, S., Obonyo, M., Palinski, W., Fierer, J. and Witztum, J.L. High-fat, high-cholesterol diet increases the incidence of gastritis in LDL receptor–negative mice. Arteriosclerosis thrombosis, and vascular biology. 2001; 21: 991-996.
CrossRef - Sörhede, M.W. and Ahrèn B. The high-fat diet–fed mouse: A model for studying mechanisms and treatment of impaired glucose tolerance and type 2 diabetes. Diabetes. 2004; 53 (3): S215-S219.
CrossRef - Lee, J.H., Son, C.W., Kim, M.Y., Kim, M.H., Kim, H.R., Kwak, E.S., Kim, S. and Kim M.R. Red beet (Beta vulgaris L.) leaf supplementation improves antioxidant status in C57BL/6J mice fed high fat high cholesterol diet. Nutrition Research and Practice. 2009; 3(2), 114-121.
CrossRef - Islam, M.S., Islam, M.K., Das, S.K. and Hossain, M. M. Effects of butter on blood biotchemistry and histotexure of heart in the development of obesity in swiss albino mice. Bangladesh Journal for Veterinary Medicin. 2014; 12(2): 203-209.
CrossRef - Demmer, E. Loan, M.D.V., Rivera, N., Rogers, T.S., Gertz, E.R., German, J.B., Smilowitz, J.T. and Zivkovic, A.M. Addition of a dairy fraction rich in milk fat globule membrane to a high-saturated fat meal reduces the postprandial insulinaemic and inflammatory response in overweight and obese adults. Journal of Nutritional Science. 2016; 5 (14): 1-11.
CrossRef - Penumathsa , S.V., Thirunavukkarasu, M., Koneru, S., Juhasz, B., Zhan, L., Pant, R., Menon, V.P., Otani, H. and Maulik, N. Statin and resveratrol in combination induces cardio protection against myocardial infarction in hypercholesterolemic rat. J. Mol. Cell Cardiol. 2007; 42(3): 508–516.
CrossRef - Harini, M. and Astirin, O.P. Blood cholesterol levels of hypercholesterolemic rat (Rattus norvegicus) after VCO treatment. Nusantara Bioscience. 2009; 1: 53-58.
CrossRef - Jacobs, B., De Angelis-Schierbaum, G., Egert, S., Assmann, G. and Kratz, M. Individual serum triglyceride responses to high-fat and low-fat diets differ in men with modest and severe hypertriglyceridemia. Journal of Nutrition. 2004; 134: 1400 –1405.
CrossRef - Ros, E. Intestinal absorption of triglyceride and cholesterol. Dietary and pharmacological inhibition to reduce cardiovascular risk. Atherosclerosis. 2000; 151: 357-379.
CrossRef - Eckhardt, E.R.M., Wang, D.Q.H., Donovan, J.M. and Carey, M.C. Dietary sphingomyelin suppresses intestinal cholesterol absorption by decreasing thermodynamic activity of cholesterol monomers. Gastroenterology. 2002; 122: 948-956.
CrossRef - Noh, S.K. and Koo, S.I. (2003). Egg sphingomyelin lowers the lymphatic absorption of cholesterol and alpha-tocopherol in rats. Journal of Nutrition. 1987; 133: 3571-3576.
CrossRef - Zhang, F., Qiu, L., Xu, X., Liu, Z., Zhan, H., Tao, X., Shah, N.P. and Wei, H. Beneficial effects of probiotic cholesterol-lowering strain of Enterococcus faecium WEFA23 from infants on diet-induced metabolic syndrome in rats. Journal of Dairy Science. 2017; 100: 1618-1628.
CrossRef - Abdel-Haleem, H., Kheadr, E., Dabour, N., El-Saadany, K., El-Zieny, M. and Zedan, M. Potential anti-hypercholesterolemic activity and acidogenic ability of probiotic lactic acid bacteria isolated from camel milk. Journal of Applied Sciences Research. 2018b; 14(5):12-18.
- Laposy, C.B., Freitas, S.B.Z., Louzada, A.N., Rubinsky-Elefant, G., Giuffrida, R., Nogueira, R.M.B. and Santarém, V.A. Cardiac markers: profile in rats experimentally infected with Toxocara canis. Rev. Bras. Parasitol. Vet. Jaboticabal. 2012; 21(3): 291-293.
CrossRef - Rajappa M, and Sharm, A. Biomarkers of cardiac injury: an update. Angiology. 2005; 56(6): 677-691. PMid:16327944.
CrossRef - Kim, G.W., Ahn., K.Y., Kim., Y.H. and Jeong., G.W. Time-course metabolic changes in high-fat diet-induced obesity rats: A pilot study using hyperpolarized13C dynamic MRS. Magnetic Resonance Imaging. 2016; 34: 1199–1205.
CrossRef - Oliveros, L.B., Videla, A.M. and Giménez, M.S. Effect of dietary fat saturation on lipid metabolism, arachidonic acid turnover and peritoneal macrophage oxidative stress in mice. Braz J Med Biol Res., 37(3): 311. Doi. 2004; 10.1590/S0100-879X2004000300004.
CrossRef - Vijayakumar, R.S., Surya, D., Nalini, N. Antioxidant efficacy of black pepper (Piper nigrum L.) and piperine in rats with high fat diet induced oxidative stress. Redox Rep. 2004; 9(2):105-10. doi:10.1179/135100004225004742.
CrossRef - Chung, A.P.Y.S., Gurtu, S., Chakravarthi, S., Moorthy, M. and Palanisamy, U.D. Geraniin Protects High-Fat Diet-Induced Oxidative Stress in Sprague Dawley Rats. Frontiers in Nutrition, 2018; 5:17. doi: 10.3389/fnut.2018.00017.
CrossRef - Pieniz, S., Andreazza, R., Okeke, B.C., Camargo, F.A.O. and Brandelli, A. Antimicrobial and antioxidant activities of Enterococcus species isolated from meat and dairy products. Brazilian Journal of Biol. 2015; 75 (4): 923-931.
CrossRef - Drury, R.A. Wallington, E.A. and Carleton, S. Histological Techniques (5th edn.), Oxford University Press, London, New York. 1980; Pp. 241-242.
- Bisar, G.H., Youssef, M., El-Saadany, K.E., El-Kholy, W. and Kheadr, E. Effect of lentil and buffalo whey protein hydrolysates on histopathology of liver and kidney in diabetic rats. J. Cytol. Histol. 2017; 8: 489. doi: 10.4172/2157-7099.1000489.
CrossRef - Ichimura, M., Kawase, M., Masuzumi, M., Sakaki, M., Nagata, Y., Tanaka, K., Suruga, K., Tamaru, S., Kato, S., Tsuneyama, K. and Omagari, K. High-fat and high-cholesterol diet rapidly induces non-alcoholic steatohepatitis with advanced fibrosis in Sprague–Dawley rats. Hepatology Research. 2015; 45: 458-469.
CrossRef
Accepted on: 14/06/2019
Second Review by: Dr. Alaa Kareem Niamah Iraq
Final Approval by: Dr. Adele Papetti


Web of Science Coverage
Emerging Sources Citation Index (ESCI)
2024 Journal Impact Factor: 1.1
Scopus Journal Metrics
CiteScore 2025: 2.6
CiteScore Details
Sustainable Nutrition: Food Systems, Nutrient Retention, and Public Health Impact
![]()
This journal is a member of, and subscribes to the principles of, the Committee on Publication Ethics (COPE)


