The Role of Glass Shapes on the Release of Dissolved CO2 in Effervescent Wine
Beaumont Fabien1*
, , 1GRESPI EA 4694, Université de Reims, 51687 Reims Cedex 2, France
2GSMA, UMR CNRS 7331, Université de Reims, 51687 Reims Cedex 2, France
3Montclair State University, Center of Pedagogy. New Jersey, USA
4Jérôme Lohez Scholarship Foundation 124 W 60th Street, NY 10023, USA
Corresponding Author Email: fabien.beaumont@univ-reims.fr
DOI : http://dx.doi.org/10.12944/CRNFSJ.7.1.22
Download this article as:
![]()
This study is based on the findings that a glass of sparkling wine that releases its dissolved CO2 too quickly will see the effervescence and aromas carried by the bubble disappear prematurely. Thus, a thorough knowledge of the processes related to the release of gaseous CO2 is fundamental for the consumer as well as the oenologist or the glassmaker. In this study, the contribution of the glass shape on the gradual release of dissolved carbon dioxide was assessed during the first ten minutes following the pouring process. Measurements carried out on 4 glasses showed that for the same quantity of wine and under identical tasting conditions, the dissolved CO2 concentration evolved differently from one glass shape to another. The results showed that in the first 10 minutes after the pouring process, INAO glass loses 34% of its initial dissolved CO2 concentration compared to 58% for the flute "effervescent". Ultimately, these results demonstrate the existence of a close link between the glass shape and the amount of dissolved CO2 which is the main parameter in the tasting of sparkling wine. The link between the amount of dissolved gas, the glass shape and the release of aromas from the wine is a huge challenge which will be the subject of future studies.
KEYWORDS:CO2; Glass Shape; Sparkling Wine; Volatile Organic Compounds (VOCs)
Introduction
Most of the scientific studies on the role of the glass during a tasting have been implemented over the past two decades. The role of the glass on the aromatic perception has resulted in numerous publications.1, 2, 3 Most authors have focused on the impact of the glass shapes to evaluate the perception of flavours in flat wines.4, 5, 6 As expected, the shape of the glass influences the perception of the wine although the discrepancies are quite limited. Hirson et al.,7 found that the differences were accentuated after 5 and 10 minutes, time necessary to establish a balance between aromatics in the wine. Among the tested glasses, we can find the International Standards Organization (ISO) wine-tasting glass (also called INAO glass) which is very suitable for red and white wine. This glass has also improved colour discrimination by maximizing the depth of the wine in relation to volume.8 Other authors have been interested in the physicochemistry of wine, which is intimately linked to aromatic perception. In a study, Arakawa et al.,9 developed an experimental method for visualizing the ethanol that escaped from a flat wine during the tasting. The investigation showed that the shape of the ethanol cloud depended on the shape of the glass. The release of carbon dioxide which causes the birth of the bubbles in sparkling wines also remains the subject of several studies.
Marchal, Rondot, & Thuillier10 have published an article on the influence of carbon dioxide and serving conditions on the sensory perception of sparkling wines. Alongside, Liger-Belair et al.,11, 12 have considered the role of the glass on the gradual release of carbon dioxide and ethanol during the tasting. In another analysis, Liger-Belair et al.,13 measured CO2 losses during the pouring process and analyzed how wines need to be served. Other researchers have considered CO2 perception and its influence on flavour.14, 15, 16 It was evidenced that CO2 can neutralize odour perception and cause a pungent sensation in the nose.17 However, its sparging action potentially increases the release and accumulation of aromatic compounds in the headspace above the wine.4
In a study, Pron et al.,18 used infrared imaging techniques to visualize CO2 fluxes in sparkling wines. Controlling and monitoring the intensity of the effervescence was also performed through the development of specific glasses.19 Furthermore, the knowledge of the parameters that affect or favour the nucleation of bubbles was discovered. 20 Although bubbles are suspected of promoting aromatic exhalation, no scientific studies have supported this hypothesis until 2009 when Liger-Belair et al.,21 have used the Munich’s high-resolution mass spectrometer to analyze non-targeted compounds preferentially found in champagne droplets. It has been found that the aerosol formed during the bursting of the bubbles on the surface of the champagne is more concentrated in aromatic molecules than the wine itself.21 After analysis, the scientists showed that this aerosol is much more concentrated – sometimes up to 30 times more – in several tens of organoleptic molecules than the wine in the heart of the flute. Among these molecules, the fatty acids, terpene compounds and other molecules involved in the flavour of the wine were found. Note that the mechanism that was identified to concentrate the aromas considered agreeable by a taster, but also the herbaceous or unpleasant aromas.22 These unprecedented results clearly demonstrate the link between bubble bursting and the release of aromatic compounds from wine. Thus, the taste of a sparkling wine resulted from the complex interaction between the dissolved CO2 content and the aromatic compounds – known as volatile organic compounds (VOCs) – dispersed in bubbles. In recent studies, it has been shown that carbonation increases the release of flavours from sparkling water.23, 24 These results suggest a strong causal link between the amount of dissolved CO2, which evolves according to several parameters, and the release of volatile aromatic compounds from the wine.
When choosing a tasting glass, the amount of CO2 released over time is rarely the criterion that is put forward. What the consumer or oenologist is looking for is a glass that will promote firstly a lasting effervescence which is associated with good wine in collective imaginary. The purpose of this study was to highlight differences, particularly in the gaseous phase, between tasting glasses. Knowing the close link between the amount of CO2 and the effervescence process, a strong hypothesis is that aromatic perception is greatly influenced by the shape of the glass. Many publications have dealt with the subject, but few scientific studies have linked the glass shape with aromatic perception and/or degassing in sparkling wines. While the choice of glass is specific to each consumer, it is also intrinsically linked to our vision of champagne: a harmonious and lasting effervescence. This study is based on the observation that a glass that releases its dissolved gas too quickly will see the effervescence and the aromas carried by the bubble disappear too quickly. The aim of this study is to determine the role of the glass shape (glasses distributed in supermarkets such as the coupe or the flute or intended for professionals such as INAO glass) on the kinetics of release of CO2 once the wine is poured into the glass. The first results of the measurements carried out on four different glass shapes along with the methodology used in this study are described in the article
Materials and Methods
Sparkling wine was used, the initial concentration of dissolved CO2 molecules was determined using carbonic anhydrase. This method is advisable by the International Bureau of Wine and Vine (OIV) to measure the CO2 concentration in champagne and sparkling wines.25 Successive measurements performed on six distinct bottles lead to an average content in dissolved CO2 molecules of 7.45 g/l. In addition, the viscosity of the sparkling wine was similar to standard champagne (η ≈ 0,00155kg/m/s). The four glasses of our study were filled with 10 cl of sparkling wine, they all have different shapes and filling heights (tables 1 and figure 1). It is worth noting that 100 ml does not correspond to the volume of wine poured into glasses during professional tasting sessions. In order to guarantee optimal reproducibility of the measurements, each glass types were identically engraved on their bottom. More details on the bubble production processes are given in a previous paper.26
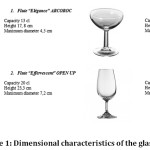 |
Figure 1: Dimensional characteristics of the glasses. Click here to View figure |
Experimental set-up
Similar conditions of effervescence must be ensured from one measure to another. In order to remove any dust which could generate an undesirable parasitic nucleation site (bubbles released from the glass wall and not from the bottom of the glass) that would prohibit the replication of the experiment, each glass was cleaned before each series of measurements. With such a protocol, the nucleation of CO2 bubbles was strictly limited to the bottom of the glass. The glasses were cleaned with a mixture of formic acid and distilled water and then rinsed with alcohol. This process is fully described in the article by Liger Belair et al.,11 A sparkling wine bottle was opened for each measurement in order to keep an identical dissolved CO2 concentration from one experiment to another. For each series of measurements (i.e. filling a glass with 100 ml of wine from an unopened bottle), the number of “parasitic” sites located outside the central bubble column was counted.
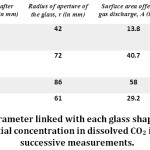 |
Table 1: Pertinent parameter linked with each glass shape filled with 100 ml of sparkling wine. Initial concentration in dissolved CO2 is the average of two successive measurements. Click here to View Table |
If there were more than 3 to 4 parasitic nucleation sites, the series of measurements was considered invalid and the glass returned to the cleaning phase. The experimental tests consisted in recording the evolution in time of the liquid’s mass contained in a glass using an ultra-sensitive balance. Once the wine was poured, the vessel was carefully positioned on the base plate of the weighing chamber of a high-precision balance (Denver Instrument PI 314 with a total capacity of 310 g and a standard deviation of +/- 0.1 mg). The timer was started and progressive weight loss was measured during the first ten minutes followed by the pouring process. The precision balance was interfaced with a laptop computer that measured and recorded the liquid’s mass every five seconds. An average and a standard deviation were calculated from several series of measurements. Four successive measurements were carried out for each type of drinking container.
Results and Discussion
Impact of glass shape on the loss of dissolved CO2 concentration over time
The dissolved CO2 contents measured using the OIV method immediately after the pouring process into each of the glasses are shown in Table 1. The concentration of CO2 dissolved molecules was slightly different from one glass to another. Once poured into the glass, the wine no longer contains as much dissolved CO2 in reason of the turbulence of the pouring process whose intensity depends according to the glass shape. Depending on the glass, between 0.5 and more than 1 g/l of dissolved CO2 escaped during the pouring process and were definitively lost.13
The mass transfer between the liquid, gaseous and atmospheric phases resulted in a progressive mass loss which was measured by micro-weighing.11 These measurements will enable to determine the total CO2 volume flux FT. This characterized the gas release intensity, specific to each glass shape. For each glass, four successive micro-weighing were carried out. The measurements were obtained from four successive pouring and allowed to deduce the average mass loss for each of the glasses. Cumulative mass loss is the combination of liquid evaporation, bubble bursting and the release of CO2 through a diffusion process. The mass loss due to evaporation of the liquid can be determined by measuring the mass loss for each glass filled with 100 ml of previously degassed wine. Thus, the cumulative mass loss due to CO2 desorption can be obtained by subtracting the mass loss due to evaporation from the cumulative mass loss (evaporation + CO2 desorption). In oenology, a characteristic parameter of sparkling wine is the concentration of dissolved CO2.27 This is expressed in g/l and is given by the following relationship:
![]()
Where Ci is the initial concentration of CO2 dissolved in wine (measured once the wine has been poured into the glass), m(t) is the cumulative CO2 mass loss over time expressed in g, and Vl corresponds to the volume of wine poured into the glass, in this case, 0.1 l. The evolution of dissolved gas concentration CL (g/l) is shown in Figure 2.
In a sparkling wine glass, carbon dioxide is evacuated in two forms: first, the nucleation in the form of bubbles and second, the molecular diffusion at the air/liquid interface (invisible to the naked eye). In addition, during their migration towards the surface, the bubbles put the liquid in motion by a viscous driving process. This movement, totally invisible to the naked eye but revealed by laser tomography,28 will allow a continuous mixing of the wine which will accelerate the discharge of CO2 by a diffusion process.
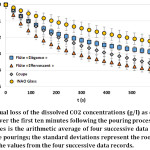 |
Figure 2: Gradual loss of the dissolved CO2 concentrations (g/l) as determined by equation (1) over the first ten minutes following the pouring process; each data in each time series is the arithmetic average of four successive data resulting from four successive pourings; the standard deviations represent the root mean square deviations of the values from the four successive data records. Click here to View figure |
In previous experimental studies, we have shown that the bubble-induced flow patterns are closely linked to the shape of the glass25 and participate widely to the release of dissolved CO2 by a diffusion process. The results in Figure 2 suggest that the shape of the glass is significant regarding the kinetics of CO2 release, although this is not conclusive in the first moments after pouring. It is obvious that for the same quantity of wine and under the same tasting conditions, the differences are important. The purpose of this study is to describe each of the parameters involved in the release of CO2 over time.
CO2 volume fluxes released from each glass
The most relevant parameter for characterizing the gradual release of gaseous CO2 from a glass of sparkling wine during a tasting is the total CO2 volume flux.29 The Total CO2 volume fluxes, denoted FT (cm3/s), was the sum of two terms: the loss due to CO2 volume flux liberated by the bubbles, denoted FB, and the CO2 volume fluxes discharged by diffusion through the free surface area denoted FS.
Finally, total CO2 volume fluxes released from a glass of sparkling wine during a tasting can be expressed as:
FT ≈ FB + FS (2)
and
![]()
R is the ideal gas constant (equal to 8.31 J/K/mol), T is the wine temperature (K), M is the molar mass of CO2 (44 g/mol), P represents the ambient pressure (close to 105 N/m²), the mass loss ∆m between two consecutive data being expressed in g, and ∆t is the time period from one data record to the next (i.e. 5s in our study).
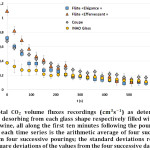 |
Figure 3: Total CO2 volume fluxes recordings (cm3s-1) as determined with equation (3), desorbing from each glass shape respectively filled with 100 mL of effervescent wine, all along the first ten minutes following the pouring process; each data in each time series is the arithmetic average of four successive data resulting from four successive pourings; the standard deviations represent the root mean square deviations of the values from the four successive data records. Click here to View figure |
The total volume fluxes of CO2 released at the air/wine interface of a glass of sparkling wine during the first 10 minutes following the pouring process are shown in Figure 3, results are derived from equation (3). As shown in Figure 3, one can state that the total CO2 volume fluxes varied greatly from one glass to another. In addition, it should be noted that the “effervescent” glass releases more dissolved gas than the other glasses within the first 4 minutes following the pouring process. It is worth noting that in this glass, the total CO2 volume flux was divided by ten during the first ten minutes after the pouring process. By comparison, the total CO2 volume flux was divided by 3.5 for INAO glass which releases its dissolved gas much more slowly. These results were noteworthy because they clearly demonstrated that depending on the glass’ shapes, the gas is not released with the same intensity although this observation is only valid in the first moments following the pouring process. It was demonstrated that the volume of CO2 released by the bubbles was proportional to the filling height h. The relationship between the CO2 flux released by the bubbles FB (cm3/s) and the filling height h is given by Liger Belair, Parmentier, & Jeandet 29:
![]()
is the frequency of bubble generation from a single nucleation site (−1), is the diameter of a bubble (cm) and its volume (3), is the wine temperature (K), is the number of nucleation site, ℎ is the liquid height (m), is the concentration of dissolved 2 in the wine (g/l), ℎ is the Henry constant (kg/m3/atm), is the ambient pressure (atm), is the liquid density (kg/m3) and is the gravity (m/s-2).
The equation (4) allows us to deduce that the higher the filling height, the higher the CO2 flux released by the bubbles increases (bubble growth proportional to the power 1/3 of the distance travelled). It is interesting to note that the size of the bubbles will have an impact on the flow of CO2 released by the bubbles but also on the diffusion of this same gas at the air/wine interface. The laws of physics indicate that there is a correlation between the velocity of the mixing processes in a liquid supersaturated with carbon dioxide and the rate of diffusion of this gas released to the surface. Since the velocity of these mixing processes is dependent on that of the bubbles, a strong hypothesis is that the release of CO2 at the air/liquid interface will be accelerated by the swirling motion of the liquid in glasses with a high filling height (glasses “Elegance” and “Effervescence”).
Diffusive CO2 volume flux
The diffusive volume flux of CO2 called FS (cm3/s) represents the volume flux of CO2 released by diffusion at the air/wine interface. To obtain the diffusive flow of CO2 released at the air/liquid interface, simply subtract the flux of CO2 released by the bubbles FB from the total flux FT:
FS = FT – FB (5)
Knowing the CO2 volume fluxes released by the diffusion process and by the bursting of bubbles, it is possible to represent on the same graph (Figure 4) the part corresponding to each of the fluxes FB and FS. The part relating to the diffusive flux of CO2 FS are represented in orange on figure 4. It also indicates the percentage it represents in relation to the total volume flux of CO2.
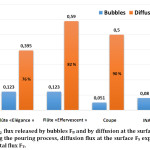 |
Figure 4: flux released by bubbles FB and by diffusion at the surface FS, within following the pouring process, diffusion flux at the surface FS expressed in % of the CO2 total flux FT. Click here to View figure |
The results of Fig. 4 indicate that the ratio between the two fluxes FS and FB varies greatly depending on the glass. The results show us that the diffusive flux FS depends on the area of the air/wine interface of each glass. Thus, in view of Table 1 and to the features of each glass, it is noticeable that the coupe has the largest exchange area (58 cm2) and the lowest filling height (29 mm). For the coupe, gas release is made easier by the great interface area.11 Furthermore, the bubbles do not grow in size due to the low filling height. The “effervescent” flute has a large exchange area (40 cm2) and a high filling height (99 mm). This is why this glass has the highest cumulative losses. The “elegance” flute and the INAO glass show an identical trend with about 1/4 of the total CO2 volume flux released by effervescence, the rest being released by diffusion.
Role of CO2 during a tasting
In the mouth, in addition to the mechanical action linked to the bubbles bursting, CO2 exerts a chemical sting, totally independent of the bursting of the bubbles.21 The dissolved CO2 activates biochemical detectors, enzymes, contained in acid-flavoured receptor cells. The dissolved CO2 thus causes a chemical sting which would participate in large part in the mouthfeel. The hypothesis is that the stinging sensation experienced during a tasting will be accentuated in a glass that has both an exchange area (interface air/wine) and a narrow opening diameter (Flute “Elegance” and INAO glass). It should be noted that an excess of gaseous CO2 can cause a highly unpleasant tingling sensation.15 On the other hand, a glass that has an exchange area and a larger opening will allow the CO2 to be diluted on the free surface (coupe) but will consequently promote degassing by diffusion. The opening is also important because by being tightened, it will trap CO2 which is 1.5 times denser than air. This is the case with the “Flute effervescent”, which has a large exchange surface area and a tightened opening diameter. Many studies conducted over the years reported a strong link between the amount of dissolved CO2, and the release of aromas from the wine.23, 24 This suggests that some glass shapes facilitate the release of flavours. This strong hypothesis remains to be confirmed and will be the subject of future studies aimed at validating the link between the release of aromatic compounds from wine and the shape of the glass.
Conclusion
This study focused on how glass shapes can affect the gradual release of Carbon Dioxide during the tasting. Measurements have been completed in individual tasting conditions and at room temperature on 4 glasses of different shapes filled with 100 ml of sparkling wine. Measurements have shown that INAO glass releases its dissolved gas more slowly than the other glasses studied with a 34% loss of its initial dissolved CO2 concentration in the first ten minutes following the pouring process. This is the first analytical proof that this glass shape will retain its effervescence and potentially the aromas carried by the bubbles longer than the other glasses studied. Conversely, in the same period of time, the flute “effervescent” lost nearly 60% of its initial dissolved CO2 concentration. Moreover, in this glass, the total CO2 volume flux released immediately after the pouring process was almost 3 times higher than in the INAO glass. In addition, the contribution of bubble bursting to the release kinetics of dissolved CO2 was estimated from a mathematical model, as well as the part relating to diffusion at the free surface. Thus, due to its low filling height, in the “coupe” glass, the contribution of bubble bursting to the total CO2 volume flux was about 60% lower than that estimated in the “elegance” and “effervescent” glasses one minute after the pouring process. The part due to the release of CO2 by a diffusion process at the free surface was also estimated for the four glasses studied. One minute following the pouring process, the coupe which has an exchange area of 58cm², released 90% of its CO2 content by a diffusion process. With regard to these results, it is asserted that glass with both a high filling level and a wide exchange area as the flute « effervescent » will release its dissolved CO2 content very quickly. In such a glass shape, the effervescence will disappear prematurely, which will certainly affect sensory perception. Although specific to each consumer, the choice of glass is intrinsically linked to the image we have of champagne: a harmonious and long-lasting effervescence. Complementary studies will be necessary in order to determine the contribution of the glass shape on sensory and aroma perception during a tasting.
Acknowledgements
The authors declare that they don’t have financial support.
Conflict of interest statement
The authors declare that they don’t have a conflict of interest including any financial, personal or other relationships with other people or organizations that can influence their work.
References
- Delwiche J. F., Pelchat M. l. Influence of Glass Shape on Wine Aroma. Journal of Sensory Studies. 2002; 17: 19–28.
CrossRef - Hummel T., Delwiche J.F., Schmidt C., Hüttenbrink K.-B. Effects of the form of glasses on the perception of wine flavors: a study in untrained subjects. 2003; 41: 197–202.
- Vilanova M., Vidal P., Cortés S. Effect of the Glass Shape on Flavor Perception of “toasted Wine” from Ribeiro (nw Spain). Journal of Sensory Studies. 2008; 23: 114–124.
CrossRef - Jackson R.S. Wine Science: Principles and Applications. 2014.
- Spence C., Wan X. Beverage perception and consumption: The influence of the container on the perception of the contents. Food Quality and Preference. 2015; 39: 131–140.
CrossRef - Wan X., Zhou X., Woods A.T., Spence C. Influence of the glassware on the perception of alcoholic drinks. Food Quality and Preference. 2015; 44: 101–110.
CrossRef - Hirson G.D., Heymann H., Ebeler S.E. Equilibration Time and Glass Shape Effects on Chemical and Sensory Properties of Wine. J. Enol. Vitic. 2012; 63(4): 515-521.
CrossRef - Cliff M.A. Influence of Wine Glass Shape on Perceived Aroma and Colour Intensity in Wines. Journal of Wine Research. 2001; 12: 39–46.
CrossRef - Arakawa T., Iitani K., Wang X., Kajiro T., Toma K., Yano K., Mitsubayashi K. A sniffer-camera for imaging of ethanol vaporization from wine: the effect of wine glass shape. 2015; 140: 2881–2886.
- Marchal R., Rondot S., Thuillier B. Influence du gaz carbonique et des conditions de service sur la perception sensorielle d’un vin effervescent, Revue française d’œnologie. 2011; 246: 27-31.
- Liger-Belair G., Villaume S., Cilindre C., Polidori G., Jeandet P. CO2 volume fluxes outgassing from champagne glasses in tasting conditions: flute versus coupe. Journal of agricultural and food chemistry. 2009; 57: 4939–4947.
CrossRef - Liger-Belair G., Beaumont F., Bourget M., Pron H., Parvitte B., Zéninari V., Polidori G., Cilindre C. Carbon dioxide and ethanol release from champagne glasses, under standard tasting conditions. Food Nutr. Res. 2012; 67: 289–340.
- Liger-Belair G., Bourget M., Villaume S., Jeandet P., Pron H., Polidori G. On the Losses of Dissolved CO2 during Champagne Serving. J. Agric. Food Chem. 2010; 58: 8768–8775.
CrossRef - Moritaka H., Kitade M., Sawamura S., Takihara T., Awano I., Ono T., Tamine K., Hori K. Effect of Carbon Dioxide in Carbonated Drinks on Linguapalatal Swallowing Pressure. Chem Senses. 2014; 39: 133–142.
CrossRef - Chandrashekar J., Yarmolinsky D., von Buchholtz L., Oka Y., Sly W., Ryba N.J.P., Zuker C.S. The Taste of Carbonation. Science. 2009; 326: 443–445.
CrossRef - Le Calvé B., Goichon H., Cayeux I. CO2 perception and its influence on flavour, Expression of Multidisciplinary Flavour Science, Proceedings of the 12th Weurman Symposium Interlaken, Switzerland. 2008; 55-58.
- Cain W.S. and Murphy C.L. Interaction between chemoreceptor modalities of odour and irritation. Nature. 1980; 284: 255-257.
CrossRef - Pron H., Caron D., Beaumont F., Liger-Belair G., Polidori G. Dynamic-tracking desorption of CO2 in Champagne wine using infrared thermography. Journal of Visualization. 2010; 13: 181–182.
CrossRef - Marchal R. Mise au point d’un verre permettant la maîtrise de l’effervescence, Vers une expression idéale de la mousse, Revue des Œnologues. 2006; 121: 39-42.
- Duteurtre B., Robillard B. Le rôle du verre sur l’effervescence et la mousse du Champagne, expériences à l’appui. Revue française d’œnologie. 2011; 246: 17–19.26.
- Liger-Belair G., Cilindre C., Gougeon R.D., Lucio M., Gebefügi I., Jeandet P., Schmitt-Kopplin P. Unraveling different chemical fingerprints between a champagne wine and its aerosols. 2009; 106 (39): 16545-16549.
- Carstens E., Iodi Carstens M., Dessirier J.-M., O’Mahony M., Simons C.T., Sudo M., Sudo S. It hurts so good: oral irritation by spices and carbonated drinks and the underlying neural mechanisms. Food Quality and Preference. 2002; 13: 431–443.
CrossRef - Pozo‐Bayón M. Á., Santos M., Martín‐Álvarez P. J., & Reineccius G. Influence of carbonation on aroma release from liquid systems using an artificial throat and a proton transfer reaction–mass spectrometric technique (PTR-MS). Flavour and Fragrance Journal. 2009; 24(5): 226 233.
CrossRef - Saint-Eve A., Déléris I., Feron G., Ibarra D., Guichard E., & Souchon I. How trigeminal, taste and aroma perceptions are affected in mint-flavoured carbonated beverages. Food Quality and Preference. 2010; 21(8): 1026 1033.
CrossRef - Method OIV-MA-AS314-01: R2006, Compendium of International Method of analysis – OIV Carbon dioxide.
- Beaumont F., Liger-Belair G., & Polidori G. Flow analysis from PIV in engraved champagne tasting glasses: flute versus coupe. Experiments in Fluids. 2015; 56(8): 170.
CrossRef - Liger-Belair G. The physics and chemistry behind the bubbling properties of champagne and sparkling wines: a state-of-the-art review. Agric. Food Chem. 2005; 53: 2788–2802.
CrossRef - Polidori G., Jeandet P., & Liger-Belair G. Bubbles and flow patterns in champagne. American Scientist. 2009; 97: 294–301.
CrossRef - Liger-Belair G., Parmentier M., Jeandet P. Modeling the Kinetics of Bubble Nucleation in Champagne and Carbonated Beverages. Phys. Chem. 2006; B 110: 21145–21151.
Accepted on: 14-12-2018
Second Review by: Dr Michael U Ukwuru Nigeria
Final Approval by: Prof. Y. Kourkoutas


Web of Science Coverage
Emerging Sources Citation Index (ESCI)
2024 Journal Impact Factor: 1.1
Scopus Journal Metrics
CiteScore 2025: 2.6
CiteScore Details
Sustainable Nutrition: Food Systems, Nutrient Retention, and Public Health Impact
![]()
This journal is a member of, and subscribes to the principles of, the Committee on Publication Ethics (COPE)


