Application of Chitosan Shells Meti (Batissa Violacea L. Von Lamarck, 1818) as Edible Film
Evi Sulastri
, Nia Heriani, Akhmad Khumaidi Department of Pharmacy, Faculty of Mathematic and Natural Science, Tadulako University, Palu 94119, Indonesia.
Corresponding Author Email: yoneli_redrose@yahoo.com
DOI : http://dx.doi.org/10.12944/CRNFSJ.7.1.25
Download this article as:
![]()
Edible films are thin layer films used for packaging material andformed from a mixture of polymer and plasticizer. The polymer used is chitosan obtained from shell so fmeti (Batissa violacea L. von Lamarck, 1818). This study aims to determine the characteristics of edible film and optimum concentration of chitosan and glycerol as plasticizer. Edible films were prepared in 9 formulas with variation of chitosan (1%, 2%, 3%) and glycerol (1.2; 1.5; 2 ml/g chitosan). The films were analyzed by physicalcharacterizations including organoleptic, pH, viscosity, moisture content, thickness, tensile strength, elongation, and morphology.The results showed that edible films, produced by varied concentration of chitosan and glycerol, are significantlydifferent in the characteristics of viscosity, pH, thickness, tensile strength, elongation and morphology. Chitosan1 % and glycerol (2 ml/g chitosan) was found to perform the best characteristics of film enhancing certain properties such as thickness, tensile strength, elongation, and morphology. In conclusion, chitosan from metishell can be potentially used as an edible film polymer with desirable properties.
KEYWORDS:Batissa Violacea L. Von Lamarck 1818; Chitosan; Edible Film; Glycerol
Introduction
Edible films are identified as a consumable thin layer placed above or in between food components. They are used as an alternative packing material which not pollute the environment because the sources are renewable (Bourtoom, 2007).1 Recently, edible films have been developed on various foodstuffs using chitosan as polymer (Azeredo, 2010).2 In food industry, chitosan can be used as a preservative, thickener, food stabilizer, anti-fungal, anti-bacterial, food protector, gelling, animal feed additives, and coatings for fruit (Rinaudo, 2006).3
Chitosan is a polysaccharide obtained from the deacetylation of chitin, which is generally derived from crustacean skin and shelled mollusk wastes. Chitosan has a relatively more reactive nature and is easily produced in the form of powders, pastes, films, and fibers compared to chitin (Agustini, 2009).4 One of the mollusks with high content of chitosan is freshwater mussels or meti from La’a River located in Petasia Sub-district, North Morowali, Central Sulawesi, Indonesia.
Meti (Batissa violacea L. von Lamarck, 1818) or freshwater mussels become source of income and commercially popular, beside that they are also delight in consumption for food. The nutrient content of meti includes 10.66% fat, 13.31% protein, and 5.18% carbohydrate (Jamaluddin, 2016).5 However, the waste from meti has not been properly utilized, so it is necessary to study the utilization of waste from the mussels. According to Abunawar (2017),6 meti have high content of chitin and chitosan (63.27% and 77.31%, respectively), as seen from the percentage of deacetylation.
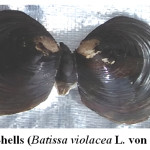 |
Figure 1: Meti Shells (Batissa violacea L. von Lamarck, 1818) Click here to View figure |
In addition to the use of polymers in the production of edible film, the other additive commonly used is plasticizer. Plasticizers are low molecular weight organic materials added to increase the flexibility and extensibility of the polymer (Wypych, 2004).7 The addition of plasticizer to edible film is to reduce the vulnerability due to the high intermolecular pressure (Gontard, 1993).8 One of the plasticizers commonly used in the production of edible film involving chitosan as polymer is glycerol.
Glycerol is a plasticizer with high boiling point, water solubility, polar, non volatile and able to blend with protein. Such properties lead to the suitability of glycerol being a plasticizer (Galietta, et al., 1998).9 Therefore, the production of edible film of chitosan from meti (Batissa violacea L. von Lamarck, 1818) using glycerol as a plasticizer with various concentration in determining the effect of polymer concentration and plasticizer on the characteristics of edible film.
Materials and Methods
Materials
Shells meti collected from La’a River located in Petasia Sub-district, North Morowali, Central Sulawesi, Indonesia. NaOH, HCl, H2SO4, H3BO3, CH3COOH, AgNO3, KI, glycerol were analytical grades chemicals (MERCK®).
Method
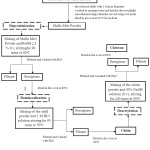 |
Figure 2: Flowsheet of Chitin and Chitosan Production Click here to View figure |
Sample Preparation
The sample was prepared by selecting and separating the freshwater mussels or Meti (Batissa violacea L. von Lamarck, 1818) from their shells. The selected shells were inlarge of 5-8cm in diameter. The shells were washed in running water and dried under sunlight. The dry shells were grinding and sieving use a 60 mesh and dried at 80°C for an hour(Abunawar, 2017).6
Chitosan Preparation
Chitosan were prepared by following method of Gotot (2010)10 and Abunawar (2017)6:
Deproteinization
The deproteinization process was carried out by remove protein of the powder dry shell using 2.5% NaOH solution (b/v) in an oven at 60oC for 90 minutes and stirred vigorously. The ratio of solid and solvent used is 1:10 (b/v). The sample was filtered and washed with H2O then dried at 80oC.
Demineralization
The shell powder was then demineralized with 1 M HCl solution at 70oC for90 minutes with the ratio of solid and solution of 1:10 (b/v). The sample was filtered and washed with H2O then dried in an oven at 80oC. At this step, chitin powder was obtained as the result.
Deacetylation
The chitin powder was deacetylated by adding 40% NaOH solution with the ratio of solid and solution of 1:10 (b/v) at 80oCfor 240 minutes. The sample was washed in running water for the neutralization process. The water was evaporated and dried in an oven at 80oC. At this step, chitosan powder was obtained as the result.
Chitin and Chitosan Characterization
Moisture Content
The moisture content was determined by measuring weight loss at 105oC for 2 hours until constant weight(AOAC, 1999).11 The water content was calculated with the following equation:
![]()
Which,
B1 = Sample before dried (g)
B2 = Sample after dried (g)
B = Sample weight (g)
Ash Value
The chitin and chitosan samples were weighed 0.5 gram and put in the porcelain cup. The sample was heated in a furnace at 500oC for 30-45 minutes. The temperature was raised to 900°C for 60-90 minutes, then the sample was cooled and put in the desicator and weighed (AOAC, 2000).12
![]()
N-Total Analysis
The protein content was analyzed using kjeldahl method. The sample was weighed 0.5 grams and put in the kjeldahl tube. 1.2 gramSelenium and 10 mL of H2SO4were added inside the tube until the solution became clear. The solution was cooled down then added with 200 mL of water. The solution was poured into a distillation tube then a few drops of phenolphthalein indicator were added. NaOH of 35% was added until the solution was alkaline then the tube was connected to the distillation device. The resulting destylate was added with 25 ml of 3% boric acid and 3 drops of methyl red indicator. The destilate was titrated with 0.1 N HCl standard solution until the color turned purple. The same process was donefor the blank solutions(AOAC, 2000).12
![]()
Fourier Transform Infrared Spectroscopy
Fourier transform infrared spectroscopy (FT-IR) was carried out with a FT-IR spectrometer (IRPrestige-21 from Shimadzu) in the wavelength range from 4000 to 500 cm−1. Chitin and chitosan powder was mixed with 100 mg dried KBr. The mixture was grinded until small-size particle was obtained. The sample was put into the mold to form a thin strip and was measured using FTIR. The absorption data was used to analyze the emerging functional groups as well as to calculate the deacetylation degree. The water content was calculated with the following equation(Stuart and Barbara, (2003)13:
![]()
Po: % transmittance on the baseline
P: % transmittance at minimum peak
![]()
Preparation of Edible Films
Edible solutions were prepared from various combination of chitosan and following the procedure of Butler, (1996)14 with some modifications.Chitosan with concentration of 1%, 2%, 3% (b/v) were dissolved in the 1% glacial acetic acid solution at 50oC for 60 minutes. The solution was then filtered through a whatman filter using a vacuum pump to remove undissolved material. The film solution was reheated at 50oC for 15 minutes and glycerol of 1; 1.5; and 2 ml/gram chitosan was added. The film solutions were then casted using polyacrilic plates (23 x 16 x 4 cm) with a thickness of 2 mm and dried at room temperature for 48 hours. The dry films obtained were peeled off and stored in the desicator for further analysis.
Edible Film Characterization
- Organoleptic and pH value
Organoleptic on edible films includes color, flexibility and odor was observed. Meanwhile, the pH value of film solutions was determined using a pH meter.
- Viscosity
The apparent viscosity of edible film solution was determined using a Brookfield viscometer “model DV-II+PRO” with the spindle number 2 at 100 rpm and room temperature.
Moisture Content (AOAC, 1995)15
The sample of edible film was weighed (w1) and dried at 105°±2°C for 2 hours. The sample was then weighed again (w2). The water content was calculated as the percentage of the weight loss of the film during the drying process. Three replications of each film treatment were used for calculating the moisture content.
![]()
Film Thickness
Thickness of the films was measured using a digital vernier caliper (Goldtool GMC-190). Measurements were made in at least 4 random locations for each film, and an average value was calculated.
Tensile Strength and Film Elongation
Both of the tensile strength and elongation properties of the films were determined by the Universal Instrument Tensile Strengh Meter using ASTM D 882-12 procedure. Three films were cut into 10 x 5 cm strips. The films were held parallel with an initial grip separation of 100 mm and then pulled apart at a maximum speed of 50 mm/min. Tensile strength was calculated by dividing the maximum force on the film before failure by the cross-sectional area of the initial specimen. Percentage elongation was defined as the percentage change in the length of the specimen to the original length between the grips.
Morphology
The morphology of the edible film was determined using a light microscope (Carton) with 40x magnification. The dimensions of film samples used for test were 2 x 2 cm.
Data Analysis
The data were analyzed by comparing the result of this study to the JIS (Japanese Industrial Standart) standard using statistical two-way analysis of variant (ANOVA) by SPSS 17.0 (SPSS. Inc, Chicago IL, USA).
Results
Table 1 : Results of Chitosan Synthesis Rendemen
| No | Process | Rendemen (%) | Rendemen (%) (Abunawar,2017)6 |
| 1. | Deproteination | 83,75±0,87 | 81,13-85,13 |
| 2. | Demineralization | 85,91±0,88 | 81,09-85,10 |
| 3. | Deacetylation | 85,87±0,70 | 46,65-76,77 |
Table 2: Characterization of Chitin and Chitosan Qualities
| Parameter | Sample | Standard (Protan Laboratory, 1989)16 | ||
| Chitin | Chitosan | Chitin | Chitosan | |
| Moisture Content (%) | 0,54±0,03 | 0,45±0,04 | ≤ 10 | ≤ 10 |
| Ash Value (%) | 0,67±0,01 | 0,56±0,03 | ≤ 2 | ≤ 2 |
| N-Total (%) | 5,58±0,24 | 6,00±0,21 | ≤ 7 | ≥ 7 |
| DD (%) | 52,5 | 82,5 | ≤ 70 | ≥ 70 |
Table 3: FTIR Analysis of Chitin
| Functional Groups | Wave Number (cm-1) | |||
| Chitin | Chitin (Abunawar, 2017)5 | Chitin Standard (Dompeipen, 2017)17 | Reference(Pavia, et al, 2008)18 | |
| -OH – N-H | 3415,93 | 3442,94 | 3268,63 | 3500 – 3100 |
| -C-H alkanes | 2852,72; 2920,23; 2981,95 | 2856,58 | 2920,23; 2886,82 | 3000 – 2850 |
| C = O amide | 1643,35 | 1653,35 | 1661,50 | 1680 – 1630 |
| -C-O stretch | 1082,07 | 1082,07 | 1155,36 | 1300-1000 |
Table 4: FTIR Analysis of Chitosan
| Functional Groups | Wave Number (cm-1) | |||
| Chitosan | Chitosan (Abunawar, 2017)5 | Chitosan Standard (Dompeipen, 2017)17 | Reference(Pavia, et al, 2008)18 | |
| -OH – N-H | 3423,65 | 3446,79 | 3377,95 | 3500 – 3100 |
| -C-H alkanes | 2920,23; 2881,65 | 2922,16 | 2922,80; 2922,85 | 3000 – 2850 |
| C = O amide | 1653,00 | 1643,05 | 1660,55 | 1680 – 1630 |
| -C-O stretch | 1155,36 | 1082,07 | 1154,64 | 1300-1000 |
Table 5: Formula Composition of Edible Film
| No | Component | Sample Code | |
| Chitosan | Glycerol | ||
| 1 | 1% | 1,2 mL/gram chitosan | F1 |
| 2 | 1% | 1,5 mL/gram chitosan | F2 |
| 3 | 1% | 2 mL/gram chitosan | F3 |
| 4 | 2% | 1,2 mL/gram chitosan | F4 |
| 5 | 2% | 1,5 mL/gram chitosan | F5 |
| 6 | 2% | 2 mL/gram chitosan | F6 |
| 7 | 3% | 1,2 mL/gram chitosan | F7 |
| 8 | 3% | 1,5 mL/gram chitosan | F8 |
| 9 | 3% | 2 mL/gram chitosan | F9 |
Table 6: The Organoleptic of Edible Film
| Sample Code | Color | Flexibility | Smell | |
| Initial Manufacture | After Storage | |||
| F1 | Yellowish White | Flexible | Acetic Acid | No |
| F2 | Yellowish White | Flexible | Acetic Acid | No |
| F3 | Yellowish White | Flexible | Acetic Acid | No |
| F4 | Light Yellow | Flexible | Acetic Acid | No |
| F5 | Light Yellow | Flexible | Acetic Acid | No |
| F6 | Light Yellow | Flexible | Acetic Acid | No |
| F7 | Dark Yellow | Flexible | Acetic Acid | No |
| F8 | Dark Yellow | Flexible | Acetic Acid | No |
| F9 | Dark Yellow | Flexible | Acetic Acid | No |
Table 7: The pH value, Viscosity, Moisture Content of Edible Film
| No | Sample Code | Average±SD (n=3) | ||
| pH | Viscosity (mPa s) | Moisture Content (%) | ||
| 1 | F1 | 4,21±0,011 | 42,2±0,871 | 20,80±1,016 |
| 2 | F2 | 4,16±0,011 | 46,46±1,616 | 21,78±1,698 |
| 3 | F3 | 4,15±0,011 | 47,1±1,389 | 22,58±2,632 |
| 4 | F4 | 4,27±0,011 | 65,73±2,203 | 20,51±0,328 |
| 5 | F5 | 4,25±0,020 | 78,57±0,378 | 24,02±1,789 |
| 6 | F6 | 4,21±0,005 | 93,00±1,562 | 25,00±0,858 |
| 7 | F7 | 4,72±0,015 | 251,87±1,616 | 20,53±0,134 |
| 8 | F8 | 4,71±0,020 | 262,33±3,074 | 21,00±0,233 |
| 9 | F9 | 4,67±0,030 | 282,60±0,4 | 25,48±0,428 |
Values are given as average ± standard deviation from three replication.
Number followed by the same letter show there is not significantly different (p>0,05).
Table 8: The Thickness Value, Tensile Strength, Elongation Edible Film
| No | Sample Code | Average±SD (n=3) | ||
| Thickness (mm) | Tensile Strength (Mpa) | Elongation(%) | ||
| 1 | F1 | 0,11±0,002 | 0,83±0,285 | 5,49±2,942 |
| 2 | F2 | 0,15±0,001 | 0,22±0,023 | 5,4±1,076 |
| 3 | F3 | 0,16±0,003 | 1,47±0,104 | 9,26±0,445 |
| 4 | F4 | 0,18±0,003 | 0,40±0,421 | 6,01±2,141 |
| 5 | F5 | 0,19±0,002 | 0,16±0,042* | 5,3±4,157* |
| 6 | F6 | 0,21±0,006 | 0,94±0,720 | 7,64±0,764 |
| 7 | F7 | 0,25±0,003 | 0,14±0,063* | 10,53±7,933* |
| 8 | F8 | 0,32±0,006 | 0,08±0,006 | 1,62±2,217 |
| 9 | F9 | 0,34±0,002 | 0,12±0,045 | 6,32±3,838 |
Description: * (n=2)
Values are given as average ± standard deviation from three replication.
Number followed by the same letter show there is not significantly different (p>0,05).
Discussion
Chitin and Chitosan Characteristics
In this study, the moisture content value of the chitosan is 0.45±0.04% and chitin is 0.54±0.03% (Table 2). This result differ from report of Abunawar (2017)6 in which the moisture content of chitosan and chitin are 0.41% and 0.2%, respectively. However, the result obtained does not exceed the limit by Protan Laboratory (1989)16 that moisture content for chitosan and chitin is lower than 10%. According to Rege et al., (1999),19 the moisture level of chitosan powder ranges between 7 and 11% (b/b), the amount of water absorbed depends on the initial water content as well as on the storage condition, especially the environmental temperature and relative humidity. On the other hand, Mucha, et al., (2005)20 reported that the water absorption capacity of the edible film decreases along with the increasing of deacetylation degree. The lower level of ash produced, the better quality of chitosan produced. The result of chitin and chitosan ash content characterization are 0.67±0.01% and 0.56±0.03%, respectively (Table 2). This result was in accordance with the Protan Laboratory (1989)16 standard (≤ 2%). However, they were lower than those reported by Abunawar (2017)6 that is 0.79% and 0.87%, respectively. Szymańska and Winnicka, (2015)21 reported that high ash content can cause difficulty in chitosan dissolution and microbiological contamination of the polymer where it can increase chitosan degradation through enzymatic hydrolysis due to high ash content. Therefore, chitosan must be high purity and free of contaminant. In addition, low ash content value could be associated with the success parameter of demineralization process in chitosan synthesis process.
Nitrogen content is another parameter measured to determine the quality of chitosan produced by using Kjeldahl method in which the process can divided into three: deproteinization, demineralization,and deacetylation based on the total nitrogen contained in the sample. According to Protan Laboratories (1989),16 high quality chitin contains ≤ 7% of total nitrogen and high quality chitosan contains ≥ 7% of total nitrogen.In this study, it is found that the N-total of chitin and chitosan are 5.52±0.22% and 5.94±0.21%, respectively. The result of chitosan obtained is lower than the standard by Protan Laboratories. I tcould be explained by the termination of the acetyl bond during the deacetylation process is not completely done.
Deacetylation degree is a parameter that significantly determines the quality of chitin and chitosan produced. Based on the result of the calculation using base line method by Domszy (1985)22 and Khan et al., (2002),23 the deacetylation degree of chitin and chitosan are 52.75% and 82.75%, respectively. The result is typically with the Protan laboratories (1989)16standard ( ≤70% for chitin and ≥70% for chitosan). Knorr (1982)24 reported that the higher of deacetylation degree, the more acetyl groups lost from the chitosan and the more of reactive amines (NH2) value. When the deacetylation degree of chitosan is low, it tend to decrease the effectiveness of chitosan, due to the more acetyl groups in chitosan. Therefore,the interaction between ion and hydrogen bonds become weak.
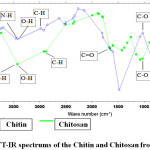 |
Figure 3: The FT-IR spectrums of the Chitin and Chitosan from shells of meti Click here to View figure |
The IR spectrum of chitin and chitosan seems similar (Fig.3). Both spectra have a C-H, C-O, C=O, O-H and N-H groups. The absorption band of C-H groups in chitin was observed at 2852.72; 2920.23; 2981.95 cm-1, and in chitosan at 2920.23; 2881.65 cm-1. The absorption of C=O group in chitin was observed at 1643.35 cm-1 and in chitosan at 1653.00 cm-1. Meanwhile, the absorption bands of C-O group in chitin at1082.07 cm-1 and in chitosan at 1155.36 cm-1. The absorption of O-H and N-H group in chitin at 3415.93 and in chitosan at 3423.65. The absorption peaks indicate the presence of certain functional group of chitin and chitosan summarized in Table 3 and 4.
Chitosan Edible Film Formulation and Characteristics
In this study, the edible film formulation use various concentration of polymer(chitosan) and plasticizer (glycerol). From tho sevaried concentrations, different results on the edible film characteristics were obtained. Significant differences were found in terms of viscosity, pH, thickness, tensile strength, elongation and morphology.
The organoleptic observation of edible film includes color, flexibility and odor. The result shown in Table 6 indicates that during the initial stage of storage, the edible film had acetic acid odor but after storage for ±7 days the edible film turned to odorless. On the other hand, the color and flexibility did not change after being in storage for ±7 days.
The determination of pH value in each edible film solution was conducted to identify the pH value of edible film solution produced. The film of 1 % chitosan solution had a pH of 4.07±0.017. This result was in accordance with literature where pH value of chitosan 1% in aquadest is 4.0 – 6.0(Rowe, 2009).25 Meanwhile, the pH value of edible film in 1% acetic acid solution can be shown in Table 7. The result presented values similar to the study of Kaban (2009)26stated that the commonly used solvent to dissolve chitosan is 1% acetic acid at pH 4.0 while at pH value above 7.0, the solubility of chitosan is very limited.
The viscosity of each edible film solution was conducted to determine the viscosity of the edible film solution produced. The 1% chitosan edible film solution in aquadest has a viscosity of 60.93±0.251. Meanwhile, the viscosity of edible film in 1% acetic acid solution can be shown in Table 7. The result showed that the increasing of chitosan and glycerol concentrations causes the increasing of the viscosity as well. According to Rowe (2009),25 the viscosity of chitosan solution increases along with the increasing of chitosan concentration.
Moisture content is one of the important parameters in edible film because moisture content has an important role in terms of stability of the product. In this study, the moisture content is shown in Table 7. The result end to be higher than the result of Martins et al., (2012)27 and Kammani and Rhim (2014)28 (19.28% and 16, 43%, respectively). In addition, the moisture content increases along with the greater amount of chitosan and glycerol added. Glycerol is the simplest glyceride compound with hydrophilic and hygroscopic of hydroxyl, so it is easy to bind with water. According to Rangel et al., (2013),29 the increasing of glycerol concentration contributes to the moisture content of edible film due to the ability of glycerol to retain the water. Beside that, it can be also caused by the mechanism of polysaccharides formation and the interaction between glycerol and water that could alters the physical properties of film.
The film thickness is an important characteristic in determining the feasibility of the edible film as a packaging material for food products. The film thickness could affects other characteristics, such as tensile strength, elongation, and moisture permeability (Galus and Lenart, 2013).30 The film thickness was measured using digital vernier caliper and the result shown in Table 8. According to JIS (Japanese Industrial Standard, 1975), the maximum value of film thickness is 0.25 mm. The result obtained were higher than those reported by Arham et al., (2016)31(0.0312 – 0.0696 mm). According to Arham et al., (2016),31 the addition of glycerol in the edible film formulation can causes an increasing in film thickness, due tothe molecule can occupies the cavity in the matrix and interacts with the film-forming polymer and causes increasing space between the polymers.
Tensile strength is the maximum tensile that can be achievable until the film breaks/tears. This measurement is performed to determine the force required to achieve the maximum value. The result of tensile strength in this work shown in Table 8. The result indicate that all the formula remains below the JIS standard. According to Venugopal (2011),32 tensile strength tends to decrease along with the increasing of glycerol concentration due to the decreasing of interaction between water molecule and polymer. Moreover, an increasing in the plasticizer concentration also increases the humidity of the film due to its high hygroscopic, so the strength among of macromolecules decrease (Sobral, et al., 2001).33
Elongation is the ability of edible film to be expanded before broken. This indicates the plasticity of the film. Plasticity or extensibility is generally required to maintain its integrity when applied to food or products (Galus and Lenart, 2013)30. In general, the presence of plasticizer in larger proportions leads to the increasing of film elongation (Banerjee, et al., 1995).34 In this study, the result of elongation is shown in Table 8. According to JIS (Japanese Industrial Standard, 1975), the elongation value of the film is at least 70%, which means that the all the formula have elongation value below than the JIS standard. According to Oses et al. (2009)35, the increasing of plasticizer concentration to a certain value increases the elongation. In the study, the use of glycerol as plasticizer increases the elongation at 40%.
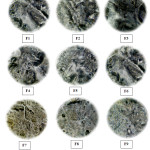 |
Figure 4: Morphologi of the surface of chitosanedible films(40X) by Light Microscope Click here to View figure |
In this study, the edible film surface was observed using a light microscope at 40x magnification. Figure 2 showed the edible film surface of the F1-F9 formula; for the F1to F3 formula that contain 1% chitosan, there is a fine line on the picture indicating the cracks and a number of cavities on the edible film surface. However, in formula F3, the number of cracks and cavities is fewer. For the F4 to F6 formula that contain 2% chitosan, there is also a narrower line with fewer amounts. For the F7 to F9 formula that contain 3% chitosan, the surface is seen evenly without any fine line on the surface indicating that there is not any crack in the formula. Cracks on edible film are influenced by the amount of composition that contained in the edible film. The higher amount of chitosan and glycerol in the edible film, the more thick of the edible film, which means that the cracks are decreasing. The higher concentration of dissolved solid, the film thickness are increasing (Krisna, 2011).36 Also, there are incompletely dissolved solids at the all formula yielding the film edible solution to be non-homogeneous. It possibly due to the imperfect mixing process. According to Karki et al., (2013),37 the morphology of the film should appear homogeneous to ensure the equal distribution of particles of the polymer mixture since the particles can affect the quality of the film during cooling and storing which can lead to low quality of the film.
Conclusion
The characteristics of chitosan edible films were influenced by chitosan and glycerol concentrations. Significant differences were identified in the characteristics of viscosity, pH, thickness, tensile strength, elongation and morphology. The viscosity of the edible film solution increases along with the increasing of chitosan concentration and the increasing glycerol concentration can possibly increase the water content of the edible film.The addition of glycerol concentration in the edible film leads to the increasing of film thickness and elongation as well as the decreasing of the tensile strength. From this study, it showed that chitosan from meti shell can potentially be used as an edible film-forming polymer with optimum concentration of 1% chitosan and 2 ml/gram glycerol on formula F3.
Acknowledgments
The authors would like to thank the Ministry of Research, Technology and Higher Education, Republic of Indonesia, that financially supported this study via grant scheme of Hibah Penelitian Dosen Pemula-2017 with the contract number 705.u/UN28.2/PL/2017.
Conflict Of Interest
The authors have no conflicts of interest to declare.
References
- Bourtoom T. Effect of Some Process Parameters on the Properties of Edible Film Prepared from Strach. Songkhla: Departement of Material Product Technology. Challenges and Opportunities. Food Technology, (2007); 51(2): 61-73.
- Azeredo H. M. C., de Britto D., and Assis O. B. G. Chitosan edible films and coatings – a review. Chitosan: Manufacture, Properties, and Usage, (2010); 179–194.
- Rinaudo M. Chitin and chitosan : Properties and applications. Elsevier, (2006); 31: 603–632. https://doi.org/10.1016/j.progpolymsci.2006.06.001
CrossRef - Agustini, Tri Winarni, and Sedjati, S. The Effect of Chitosan Concentration and Storage Time on the Quality of Salted-Dried Anchovy (Stolephorus heterolobus). Journal of Coastal Development, (2007); 10(2): 63–71.
- Jamaluddin, Mappiratu, Septiawan, and Yuyun, Y. Analysis of fatty acid and amino acid profile of “Meti” mussels (Batissa violacea L. von Lamarck, 1818) In La’a river of Petasia District North Morowali regency. Rasayan Journal of Chemistry, (2016); 9(4): 673–679.
- Abunawar H., Yuyun Y., Sumarni N. K., and Tobigo D. T. Optimasi Dan Karakterisasi Chitosan Cangkang Kerang Air Tawar Meti (Batissa Violacea Von Lamarck, 1818) Yang Di Peroleh Dari Sungai La’a Kecamatan Petasia Kabupaten Morowali Utara. Skripsi. Palu: Universitas Tadulako. (2017).
- Wypych F., dan K.G Clay Surfaces: Fundamentals and Application. Amsterdam: Elsevier Academic Press. (2004).
- Gontard N., Guilbert S., and Cuq J. L. Water and Glycerol as Plasticizers Affect Mechanical and Water Vapor Barrier Properties of an Edible Wheat Gluten Film. Journal of Food Science, (1993); 58(1): 206–211. https://doi.org/10.1111/j.1365-2621.1993.tb03246.x
CrossRef - Galietta, G., Di Gioia, L., Guilbert, S., and Cuq, B. Mechanical and Thermomechanical Properties of Films Based on Whey Proteins as Affected by Plasticizer and Crosslinking Agents. Journal of Dairy Science, (1998); 81(12): 3123–3130. https://doi.org/10.3168/jds.S0022-0302(98)75877-1
CrossRef - Gotot E. J. Karakterisasi Pembuatan Kitin dan Kitosan dari Limbah Kulit Udang Putih(Litopenaeus vannamei Bonne). Makassar: MIPA Universitas Negeri Makassar. (2010).
- Official Methods of Analysis of the Association of Official Analytical Chemist. Association of Official Analytical Chemist. Washington, USA. (1999).
- Official Methods of Analysis of the Association of Official Analytical Chemist. Association of Official Analytical Chemist. Washington, USA. (2000).
- Stuart andBarbara. Infrared Spectroscopy: Fundamental and Aplication, Wiley, Chichester, UK. (2003).
- Butler B. L., Vergano P. J., Testin R. F., Bunn J. M., and Wiles J. L. Mechanical and Barrier Properties of Edible Chitosan Films as affected by Composition and Storage. Journal of Food Science, (1996); 61(5): 953–956. https://doi.org/10.1111/j.1365-2621.1996.tb10909.x
CrossRef - AOAC Official Methods of Analysis. Association of Official Agricultural Chemists. Washington, D.C., (1995); 15th(Volume 1): 136–138.
- Protan Lab. Protan Biopolymers. Norway: Protan Laboratoris, Inc(1987).
- Dompeipen E. J. Isolasi dan identifikasi chitin dan chitosan dari kulit udang windu (Penaeus monodon) dengan spektroskopi inframerah. Majalah Biam, (2017); 13(1): 31–41.
- Pavia L.D., Lampman M.G., Kriz G., dan A.J, Vyvyan. Introduction to Spectroscopy. United States: Brooks cole. (2008).
- Rege P.R.; Shukla D.J.; Block L.H. Chitinosans as tableting excipients for modified release delivery systems. J. Pharm. (1999); 181: 49–60.
CrossRef - Mucha M.; Ludwiczak S.; Kawińska M. Kinetics of water sorption by chitosan and its blends with poly(vinyl alcohol). Polym. (2005); 62: 42–49.
CrossRef - Szymańska E., and Winnicka K. Stability of Chitosan—A Challenge for Pharmaceutical and Biomedical Applications. Mar Drugs, (2015); 13(4): 1819–1846.
CrossRef - Domszy J. G., and Roberts G. A. Evaluation of infrared spectroscopic techniques for analysing chitosan. Chem., (1985); 186: 1671–1677. https://doi.org/10.1002/macp.1985.021860815
CrossRef - Khan T. A., Peh K. K., and Ch’ng H. S. Reporting degree of deacetylation values of chitosan: The influence of analytical methods. Journal of Pharmacy and Pharmaceutical Sciences, (2002); 5(3): 205–212.
- Knorr Dietrich. Functional Properties of Chitin and Chitosan. Journal of Food Science, (1982); 47(2): 593–595. https://doi.org/10.1111/j.1365-2621.1982.tb10131.x
CrossRef - Rowe C., dan Raymond. Handbook of Pharmaceutical Excipients Sixth Edition. London: Pharmaceutical Press. (2009).
- Kaban J. Modifikasi Kimia dari Kitosan dan Aplikasi Produk yang Dihasilkan dalam Pidato Pengukuhan Jabatan Guru Besar Tetap dalam Bidang Kimia Organik Pada Fakultas MIPA. Sumatera Utara: Universitas Sumatera Utara. (2009).
- Martins J.T., Cerqueira M. A.,Bourbon A. I. Synergistic effects between κ-carrageenan and locust bean gum on physicochemical properties of edible films made thereof. Food Hydrocolloids, (2012); 29(2): 280-289.
CrossRef - Kanmani P., and Rhim J. W. Development and characterization of carrageenan/grapefruit seed extract composite films for active packaging. International Journal of Biological Macromolecules, (2014); 68: 258–266. https://doi.org/10.1016/j.ijbiomac.2014.05.011
CrossRef - Rangel-Marrón M., Montalvo-Paquini C., Palou E., and López-Malo A. Optimization of the moisture content, thickness, water solubility and water vapor permeability of sodium alginate edible films. Recent Advances in Chemical Engineering, Biochemistry and Computational Chemistry, (2013); 72–78.
- Galus S., and Lenart A. Effect of Oxidized Potato Starch on the Physicochemical Properties of Soy Protein Isolate-Based Edible Films, (2013); 51(3), 403–409. ISSN 1330-9862 (FTB-3177)
- Arham R., Mulyati M. T., Metusalach and Salengke S. Physical and mechanical properties of agar based edible film with glycerol plasticizer, (2016); 23(4): 1669–1675.
- Venugopal V. Marine Polysaccharides: Food Applications. Boca Raton: CRC Press. (2011).
CrossRef - Sobral P. J. A., Menegalli F. C., Hubinger M. D., and Roques M. A. Mechanical, water vapor barrier and thermal properties of gelatin based edible ® lms, (2001); 15: 423–432.
- Banerjee R., Chen H., and Wu J. Milk protein-based edible film mechanical strength changes due to ultrasound process. Journal of Food Science, (1996); 61(4): 824–828. https://doi.org/10.1111/j.1365-2621.1996.tb12211.x
CrossRef - Oses J., Fernandez-Pan I., Mendoza M. and Mate J.I. Stability of the mechanical properties of edible films based on whey protein isolate during storage at different relative humidity. Food Hydrocolloids, (2009); 23:125-131.
CrossRef - Krisna D. D. A. Pengaruh Regelatinisasi Dan Modifikasi Hidrotermal terhadap Sifat Fisik Pada Pembuatan Edible Film Dari Pati Kacang Merah (Vigna angularis). Tesis. Semarang: Universitas Diponegoro. (2011).
- Karki R., Parchuri D. B., Umar G. S. S., and Goli, D. Formulation and Evaluation of Nanoparticulate Drug Delivery System of Acyclovir for Topical Drug Delivery, World Journal of Pharmacy and Pharmaceutical Science, (2013); 2(6): 5602-5617.
Accepted on: 14-01-2019
Second Review by: Dr.Renu Khedkar India
Final Approval by: Prof. Daniel Cozzolino


Web of Science Coverage
Emerging Sources Citation Index (ESCI)
2024 Journal Impact Factor: 1.1
Scopus Journal Metrics
CiteScore 2025: 2.6
CiteScore Details
Sustainable Nutrition: Food Systems, Nutrient Retention, and Public Health Impact
![]()
This journal is a member of, and subscribes to the principles of, the Committee on Publication Ethics (COPE)


