Optimization and Characterization of Gluten-Free Formulation For the Development of Gluten Free Flatbread Using Underutilised Sources

Food Engineering and Technology Department, Institute of Chemical Technology, Matunga, Mumbai-400009.
Corresponding Author Email: shalu.ghodke@gmail.com
DOI : http://dx.doi.org/10.12944/CRNFSJ.6.3.10
Download this article as:
![]()
This deals to study the effect of different underutilized, cheap and readily available flours from rice, sorghum, unripe banana, water chestnut and moong and their mixtures on dough, flatbread and sensory characteristic of gluten free flatbread. D-optimal mixture design approach was utilized for the study. Dough stickiness decreased with increasing concentration of unripe banana and sorghum flour. Dough strength was positively influenced by rice and moong flour. Tear force values were higher at higher sorghum concentration. Higher levels of sorghum and rice tend to possess higher scores for sensory acceptability. Optimum dough and flatbread qualities were obtained with the optimized sample (Gluten free formulation) containing flours from rice (60%), sorghum (10%), unripe banana (5%), water chestnut (15%) and moong (10%). Model was found to be valid statistically. Further, this mix was compared with whole wheat flour for pasting and rheological properties and found to possess comparable properties.
KEYWORDS:Dough stickiness; Dough strength; Gluten free flatbread; Mixture design; Pasting properties; Tears force; Viscoelastic properties
Introduction
Flatbread or chapatti is an universally accepted and important food product which is originated from India. Traditionally, whole wheat flour is major source for preparation of flat breads which have unique profile to form cohesive dough with the ability to trap gas and allow for mechanical sheeting because of gluten only.1,2 This unique property is essential for the commercial production bakery (leavened and unleavened)like bread, biscuits, pasta, chapattis.3,4
The presence of gluten have been anticipated in cereals like barley, wheat and rye. Hence, these flours have been characterized by the viscoelastic characteristics of gluten and thus, found significant applications in products requiring molding and sheeting 5,6 After hydration gluten protein forms a continuous viscoelastic network which imparts wheat dough its typical mechanical properties.5-7
Prevalence of Celiac disease has increased these days occurring in 1 of 130–300 of the global population. So it advised to adopt gluten-free protein diet to manage celiac disease.8-10 Hence, the demand for gluten-free foods in increasing. Main challenge that arises in the development of gluten free products is the loss of material properties due to absence of gluten.11,3
Chickpea, quinoa, tapioca, sorghum, and rice like many other starches are known as gluten-free. The dough development mostly depends on the gluten which having viscoelastic characteristics. Hydrocolloids and proteins are alternative to achieve gluten functionalities to retain gas and elasticity.12,13 Loaf quality and dough handling ability is most correlated parameters in preparation of bread.14 A lot of reported available on loaf quality and textural properties of bread, but absent in baking performance in gluten-free dough related to sheeting.15,16
Mixture design plays significant role in the development of gluten-free breads to optimize combination of unripe banana flour (UBF), moong flour (MF), rice flour, sorghum flour, and water chestnut flour (WCF).17 The development of gluten free unleavened flatbread depending on its dough, textural and sensory qualities was made. Pasting profile and viscoelastic behavior of the optimized gluten free formulation (GFF) were also studied in comparison with wheat flour and dough.
Materials and Methods
Materials
Wheat (Triticum aestivum) flour (Aashirvaad, ITCTM, Mumbai, Maharashtra, India), rice (Oryza sativa) flour (BhagirathiTM, Mumbai, Maharashtra, India), sorghum (Sorghum bicolor) flour (BhagirathiTM, Mumbai, Maharashtra, India), moong (Vigna radiate) flour (SwadTM, Mumbai, Maharashtra, India), water chestnut (Trapa natans) flour (SwadTM Mumbai, Maharashtra, India) were purchased from local market of Mumbai. Unripe banana (Musa paradisiaca) flour (Mahila Gruh UdyogTM, Jalgaon, India) was purchased from Jalgaon banana market. All the flours were sieved (60 mesh) and then used for analysis.
Experimental Design
Design Expert 6.0 (State-Ease Inc., Minneapolis, USA) was employed. Combinations of gluten free flours were obtained by using D-optimal mixture design Independent components of the mixture included rice (A), sorghum (B), UBF (C), WCF (D) and MF (E).The selection of actual levels of these components were based on preliminary studies and literature data surveyed (not reported here) is presented in Table 1. Response variables were system dough rheo logical parameters like dough stickiness and strength along with flatbread characteristics like tear force and sensory overall acceptability.
Table 1: Experimental Layout Employed in D-Optimal Mixture Design
| Run | Rice (A) | Sorghum (B) | UBF (C) | WCF (D) | MF (E) | |||||||||
| Coded value | Uncoded value | Coded value | Uncoded value | Coded value | Uncoded value | Coded value | Uncoded value | Coded value | Uncoded value | |||||
| 1 | 0 | 60 | 0.17 | 12.5 | 0 | 15 | 0.67 | 5 | 0.17 | 7.5 | ||||
| 2 | 0.67 | 50 | 0 | 15 | 0 | 15 | 0.33 | 10 | 0 | 10 | ||||
| 3 | 0 | 60 | 0.33 | 10 | 0 | 15 | 0.67 | 5 | 0 | 10 | ||||
| 4 | 0.29 | 55.625 | 0 | 15 | 0.29 | 10.625 | 0.29 | 10.625 | 0.125 | 8.125 | ||||
| 5 | 1 | 45 | 0 | 15 | 0 | 15 | 0 | 15 | 0 | 10 | ||||
| 6 | 0.67 | 50 | 0.33 | 10 | 0 | 15 | 0 | 15 | 0 | 10 | ||||
| 7 | 0.67 | 50 | 0 | 15 | 0.33 | 10 | 0 | 15 | 0 | 10 | ||||
| 8 | 0 | 60 | 0.33 | 10 | 0 | 15 | 0.67 | 5 | 0 | 10 | ||||
| 9 | 0.33 | 55 | 0.33 | 10 | 0 | 15 | 0 | 15 | 0.33 | 5 | ||||
| 10 | 0 | 60 | 0.33 | 10 | 0.67 | 5 | 0 | 15 | 0 | 10 | ||||
| 11 | 0 | 60 | 0 | 15 | 0.33 | 10 | 0.33 | 10 | 0.33 | 5 | ||||
| 12 | 0 | 60 | 0.33 | 10 | 0.33 | 10 | 0 | 15 | 0.33 | 5 | ||||
| 13 | 0 | 60 | 0.17 | 12.5 | 0 | 15 | 0.67 | 5 | 0.17 | 7.5 | ||||
| 14 | 0.67 | 50 | 0.33 | 10 | 0 | 15 | 0 | 15 | 0 | 10 | ||||
| 15 | 0 | 60 | 0.33 | 10 | 0.67 | 5 | 0 | 15 | 0 | 10 | ||||
| 16 | 0.67 | 50 | 0 | 15 | 0 | 15 | 0 | 15 | 0.33 | 5 | ||||
| 17 | 0.33 | 55 | 0 | 15 | 0.67 | 5 | 0 | 15 | 0 | 10 | ||||
| 18 | 0 | 60 | 0 | 15 | 0.67 | 5 | 0 | 15 | 0.33 | 5 | ||||
| 19 | 0 | 60 | 0 | 15 | 0.67 | 5 | 0.33 | 10 | 0 | 10 | ||||
| 20 | 0 | 60 | 0 | 15 | 0.33 | 10 | 0.67 | 5 | 0 | 10 | ||||
| 21 | 0 | 60 | 0.33 | 10 | 0 | 15 | 0.33 | 10 | 0.33 | 5 | ||||
| 22 | 0.29 | 55.625 | 0.125 | 13.125 | 0.29 | 10.625 | 0.29 | 10.625 | 0 | 10 | ||||
| 23 | 0 | 60 | 0 | 15 | 0 | 15 | 0.67 | 5 | 0.33 | 5 | ||||
| 24 | 0.67 | 50 | 0 | 15 | 0 | 15 | 0 | 15 | 0.33 | 5 | ||||
| 25 | 0.33 | 55 | 0 | 15 | 0 | 15 | 0.67 | 5 | 0 | 10 | ||||
Dough Rheology
Doughs were evaluated for dough stickiness using Chen-Hoseney Dough Stickiness Rig test,18 The parameters obtained were dough stickiness, cohesiveness or dough strength. Accessories used included 25mm Perspex cylinder probe (P/25P), 50kg load cell and SMS/Chen-Hoseney Dough Stickiness Cell (A/DSC) in Stable Micro Systems Texture Analyzer.
Table 2: ANOVA Terms for D-Optimal Mixture Design
| Model terms | Sensory | Stickiness | Strength | Tear force |
| Prob > F | 0.0377 | 0.0164 | 0.0309 | 0.0363 |
| Std. Dev. | 0.183076 | 1.064955 | 0.149995 | 48.91353 |
| Mean | 7.3545 | 38.12525 | 0.9705 | 518.397 |
| R-Squared | 0.937044 | 0.956385 | 0.942409 | 0.938096 |
| Lack of fit | Insignificant | Insignificant | Insignificant | Insignificant |
Flatbread Tear Force
Flatbreads were evaluated for tear force (g) according to the method of Ghodke and Ananthanarayan (2007) using TA-XT2i Stable Micro systems texture analyzer.19 Flat breads were cut into strips of specific length and width (7cm*3.5cm). The upper tensile grip was attached to the load cell carrier and the lower tensile grip was secured to the base of the machine. The flat bread strips were placed one end into the lower rig grip and tightening the grip and the same procedure was performed to anchor the other end to the upper grip. The force was applied and the readings were taken.
Table 3: Optimization of Constrains and Validation of Model
| Constraints | Goal | Limits | Model Predicted Value | Experimental Value | Chi square value | |
| Lower | Upper | |||||
| Rice | In range | 45 | 60 | 60 | – | – |
| Sorghum | In range | 10 | 15 | 10.08 | – | – |
| UBF | In range | 5 | 15 | 5.21 | – | – |
| WCF | In range | 5 | 15 | 15 | – | – |
| MF | In range | 5 | 10 | 9.71 | – | – |
| Dough stickiness | Maximize | 31 | 42.26 | 35.26 | 32.36±2.51 | 0.237 |
| Dough strength | Minimize | 0.56 | 1.7 | 1.74 | 1.56±0.05 | 0.017 |
| Tear force | Maximize | 401.65 | 710.97 | 418.264 | 420.33±10.24 | 0.009 |
| Dough strength | Minimize | 0.56 | 1.7 | 1.74 | 1.56±0.05 | 0.017 |
| Sensory | Maximize | 6.66 | 7.8 | 7.8 | 7.3±0.26 | 0.032 |
Sensory Overall Acceptability
Sensory evaluation was carried out using 9- point hedonic rating scale in laboratory at ambient conditions according to the method of Lawless and Heymann.20 Sensory evaluation was carried out using 9- point hedonic rating scale in laboratory at ambient conditions. Ten number of panel lists were selected. They were healthy individuals between age group of 23 to 30 years without any medical disorder. Sensory panel lists were asked to rate and give score for overall acceptability.
Table 4: Correlation Matrix for Dependent and Independent Variables
| Rice | Sorghum | UBF | WCF | MF | Dough stickiness | Dough strength | Tear force | Overall acceptability | |
| Rice | 1 | -0.335 | -0.357 | -0.449 | -0.335 | 0.048 | 0.362 | -0.502 | 0.405 |
| Sorghum | 1 | -0.129 | -0.0937 | 0.034 | -0.436 | -0.593 | 0.260 | -0.054 | |
| UBF | 1 | -0.373 | -0.129 | 0.123 | -0.184 | 0.062 | -0.406 | ||
| WCF | 1 | -0.093 | 0.087 | 0.054 | 0.105 | -0.024 | |||
| MF | 1 | -0.005 | 0.073 | 0.465 | -0.063 | ||||
| Dough stickiness | 1 | 0.387 | -0.188 | 0.219 | |||||
| Dough strength | 1 | -0.062 | 0.322 | ||||||
| Tear force | 1 | -0.314 | |||||||
| Overall acceptability | 1 |
Pasting Measurements
The rheometer from Anton Paar MCR 72 (RHEOPLUS/32 V3.40) was used to estimate pasting properties of the flours. The dough was prepared by using 2.5g of flour with 25g of water (w/w). The heating and cooling cycle was used where samples were held at 50oC for 1 min, heated to 95oC, held at 95oC for 4 min, cooled to 50oC and held at 50oC for 1 min. Parameters recorded were pasting temperature, peak viscosity, trough viscosity (minimum viscosity at 95oC), final viscosity (viscosity at 50oC),breakdown viscosity (peak-trough viscosity) and setback viscosity (final-trough viscosity).
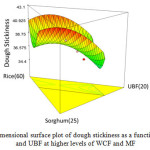 |
Figure 1a: Three dimensional surface plot of dough stickiness as a function of rice, sorghum and UBF at higher levels of WCF and MF |
Viscoelastic Measurements
The rheological measurements were conducted using a rheometer(Anton Paar MCR 72 ) according to the method explained by Demirkesen et al.,21
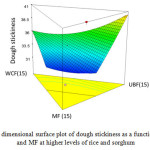 |
Figure 1b: Three dimensional surface plot of dough stickiness as a function of UBF, WCF and MF at higher levels of rice and sorghum Click here to View figure |
Statistical Analysis
ANOVA test was carried out using Design Expert 6.0 (State-Ease Inc., Minneapolis, USA). A Principal component analysis(PCA) applied to design for multi-correlated data (STATISTICA 7).
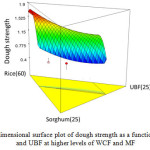 |
Figure 2a: Three dimensional surface plot of dough strength as a function of rice, sorghum and UBF at higher levels of WCF and MFDiagnostic checking of fitted models |
The model was designed for interactive effects, linear, and quadratic. The coefficient of determination (R2) and F-ratio are measure terms to test model. When R2 value was more than 80% and calculated F-value was more than table F- value (at 5% level) consider as models is fitted.22 All the responses showed values of “Prob > F” less than 0.0500 indicating model terms were significant.
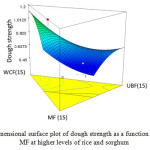 |
Figure 2b: Three dimensional surface plot of dough strength as a function of UBF, WCF and MF at higher levels of rice and sorghum Click here to View figure |
Dough Stickiness
The characteristics of dough such as rolling, flattening, sheeting, depend on stickiness where it, increases with increase in moisture content from 48 to 60%.The regression equation relating dough stickiness is:Dough stickiness = 28.62A+408.79B+32.42C+49.89D+68.66E-484.64AB+69.79AC-1.66AD-43.63AE-429.35BC-397.55BD-582.24BE-65.71CD-39.49CE+41.28DE (Eq1)ANOVA for quadratic model as fitted to experimental results of dough stickiness showed significance (P < 0.05). The coefficient of determination (R2) for dough stickiness was 0.9564. The model showed insignificant lack-of-fit (P > 0.05).
Figure 1a and 1b is elaborating the dough stickiness trend with respect to variables. Dough stickiness increased with increase in rice proportion at higher levels of WCF and MF (Fig 1a). The dough prepared by using rice flour shows high stickiness as compared with others.23 Sorghum is shown to lower the stickiness of the dough system with negative correlation coefficient (-0.436). Phattanakulkaewmorie et al., have elucidated reduced adhesiveness of dough with addition of sorghum.24 While higher levels of rice and sorghum caused dough stickiness to increase with increasing proportion of UBF due to the water holding capacity of banana starch.25 Similar results were observed in rice noodle prepared with incorporation of unripe banana flour26 The fraction of MF did not seem to affect dough stickiness of the flour mixture.
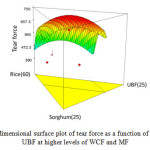 |
Figure 3a: Three dimensional surface plot of tear force as a function of rice, sorghum and UBF at higher levels of WCF and MF Click here to View figure |
Dough Strength
Dough strength is a balance of two main properties; extensibility and elasticity. Dough strength affects production characteristics through all of the baking process. It is most critical during shaping. If the dough is too strong, it will be too elastic and difficult to shape. If it’s too weak, it will stretch easily, but will not hold its shape during baking. Several studies have shown that bread making quality improves with higher dough strength.27-29
According to ANOVA, the variation in these flour proportions had a significant effect(p<0.05) on dough strength with a high correlation coefficient (R2=0.942) and not significant lack of fit. Dough strength was well explained by the regression equation;
Dough strength = 1.26A-49.11B+3.78C+2.25D-11.67E+55.56AB-4.87AC-1.23AD+19.73AE+57.72BC+63.07BD+56.74E-7.78CD+11.32CE+14.16DE (Eq2)
Figure 2a and 2b elaborates the bahavior of dough strength with varying ratios of flours in mixture. UBF seemed to show quiet negative impact on dough strength. Similar results were obtained by Ritthiruangdej et al., that, the addition of banana flour, in the fabrication of dried noodles found to interrupt and weaken overall structure of the noodles.30 Same is the case was found with respect to sorghum. Absence of elastic proteins/gluten may be the factor responsible for that. An increase in percentage of sorghum showed a decline curve of the graph. High increase in WCF and MF fraction caused slight increase in dough strength. This may be due to the changes in the size distribution of polymeric protein.31 Walde et al., (2015) noticed decrease in dough extensibility with increase in water chestnut flour concentration which is negatively correlated to dough strength.32, 33
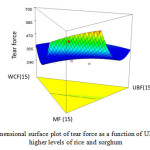 |
Figure 3b: Three dimensional surface plot of tear force as a function of UBF, WCF and MF at higher levels of rice and sorghum Click here to View figure |
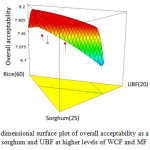 |
Figure 4a: Three dimensional surface plot of overall acceptability as a function of rice, sorghum and UBF at higher levels of WCF and MF Click here to View figure |
Tear Force
Tear strength is the tensile force required to rupture. Lower values of tear force indicates desirable soft flatbread while higher values are undesirable signifying harder flatbread.
For the tear force of flatbread, ANOVA demonstrated significant effect (p<0.05) with a high correlation coefficient (R2=0.938) along with insignificant lack of fit. Regression equation relating to tear force was;
Tear force = 219.07A-14634.89B-1329.85C+1566.99D+19757.39E+17488.29AB+3226.21AC-1958.86AD-20550.27AE+21439.07BC+19016.49BD-3750.51BE+1799.11CD-21948.94CE-25987.02DE (Eq3)
Figure 3a and 3b explains the effect of variables on tear force of flatbread. It is clear from figure 3a that tear force has increased with increasing percentage of sorghum and lowered as rice proportion increased at higher levels of MF and WCF. Gujral and Pathak have reported a decrease in peak force to rupture with increase in concentration of rice flour in a composite flour dough system.34 Phattanakulkaewmorie et al., have depicted the harder gluten free breads made with sorghum flour blends in comparison with the control.24 MF has found to rise the values of tear force with its increasing fraction in the mixture while WCF and UBF tend to reduce tear force with their concentration as shown in figure 3b. Ritthiruangdej et al., has reported the decrease in tensile strength of noodles when the banana flour content increased.30 Aziah et al., found the need of more strength to break cookies incorporated with legume flour which might have resulted from the incorporation of protein-rich flour.35, 36
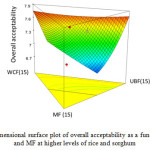 |
Figure 4b: Three dimensional surface plot of overall acceptability as a function of UBF, WCF and MF at higher levels of rice and sorghum Click here to View figure |
Sensory Overall Acceptability
In the ANOVA for overall acceptability observed a significant (P < 0.05) effect and high correlation (R2 = 0.8407). Lack of fit was found to be insignificant in this case. The following regression equation explained this response;
Overall acceptability = 6.54A-44.23B+8C+4.09D+23.97E+68.73AB+3.01AC+6.18AD-25.85AE+53.84BC+67.19BD+28.37BE-2.06CD-20.05CE+1.23DE
Figure 4a and 4b illustrates the behavior of this response with varying proportions of flours. Figure 4a states the direct proportionality of sensory acceptability with rice flour. Even sorghum has found to increse the sensory acceptability initially but tend to decrease the score with further increase in its proportion. As shown in figure 4b higher levels of WCF and UBF are highly acceptable by the consumers but for MF lower levels are acceptable and the score went on decreasing as the concentration increased. Aziah et al., found a pronounced aftertaste when mungbean and chickpea were incarporated in gluten free cookies.35 McWatters has discussed about the typical beany flavour of legume flours that leads to decrease in consumer acceptance.37
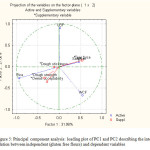 |
Figure 5: Principal component analysis: loading plot of PC1 and PC2 describing the inter relation between independent (gluten free flours) and dependent variables |
Optimisation of Independent Variables and Validation of Model
For the optimization, the goals were selected as elaborated in table 3 for the responses. By using the given criteria, the solution obtained was rice (60), sorghum (10.08), UBF (5.21), WCF (15) and MF (9.71). Flat breads were prepared based on solution obtained and analysed for the responses. The measured response values were very close to the predicted values, confirming the adequacy of the models. Also, the validation of the model was reconfirmed by the lower chi square values as depicted in table 3. Therefore, the optimised levels of gluten free flours were recommended for the preparation of gluten free flatbread and the mixture thus developed was gluten free formulation (GFF) which was further evaluated.
Principal Component Analysis
Principal Component Analysis (PCA) was used to visualize the variation between the variables i.e. independent (rice, sorghum, UBF, WCF and MF) and dependent (Dough stickiness, dough strength, tear force and overall acceptability. This analysis showed two axes explaining the essential variability that were axis 1 and 2. The first and the second PCs described 31.98 and 27.06% of the variance respectively. Together, the first two PCs represented 59.04% of the total variability. As shown in figure 5, PC1 (principal component 1) separates independent variable rice and dependent variables dough strength, overall acceptability from independent variable sorghum, MF and dependent variable tear force. This PC does not elaborate dough stickiness and UBF as they are placed near the axis. Rice is shown to be positively correlated with dough strength and overall acceptability at higher levels which is also shoen by correlation matrix (table 4).
Second PC places UBF far away from rice and WCF showing differences in their behavior in mixture. Second PC reveals positive influence of dough strength and overall acceptability on rice which is also upheld by table 4 (positive correlation coefficient). Dough stickiness being immediately placed to the axis, is not well explained by this PC. Carefully seen at the figure, there is a formation of cluster from sorghum, MF and tear force. This shows both of these flours when added to mixture positively affects tear force (positive values of correlation coefficinet as shown in table 4).
Comparative Evaluation of GFF and Wheat Flour
Pasting Properties
The swelling power, rigidity, size and amylose to amylopectin ratio of granules has major influence on pasting properties.38 Figure 6 represents the pasting behavior of wheat flour and GFF with respect to time and temperature. As can be seen from the figure, viscocity of both the flours followed changes with change in temperature as well as time. There is an initial increase in the values of viscocity with time-temperature followed by a decrease in the value. High viscosity values have characterized by GFF as compared to the wheat flour. This is due to the presence of large amount of starches in case of GFF. Due to the presence of gluten in case of wheat flour, the absorption of water by starch granules is inhibited to some extent which give reduced values of viscosity.
Linear Viscoelastic Modules
The linear viscoelastic modulus of dough samples of wheat and GFF against the angular frequency can be seen in figure 7. Figure depicts that increase in angular frequency caused a slight increase in the values of linear viscoelastic modulus. However, it can be seen from the figure that, storage modulus (G’) values for both dough samples (wheat and GFF) ranged between 10000 to 10000 and loss modulus (G”) values for the dough samples were within 1000 and 100000. Both dough samples had a higher storage modulus values that loss modulus values indicating a weak gel behavior or solid like structure.21 This extent occur due to alteration of viscoelastic solid to the liquid form possessing elasticity and viscosity both. The dissipation of energy takes place during this process due to the friction of elements of dough with each other. Both GFF and wheat were shear-dependent, demonstrated by an increase in storage and loss moduli (G’ and G”, respectively) with increase in frequency (Figure 7). The gentle slope of the G’ represents a low sensitivity to frequency change.43
Conclusion
Mixture design is effective in optimization of gluten free flat bread formulaytion to addres celiac issues. Gluten-free flatbread made from a mixture of rice, sorghum, water chestnut, unripe banana and mung flours showed to have great potential for commercial application. The products concluded that the gluten free flatbread thus prepared was acceptable by the consumers.It has also been shown that GFF was having similar structural rigidity and similar viscous behavior along with shear dependency as that of whole wheat flour. These flours are therefore a very interesting, easily available and cheap alternative for the development of products.
Acknowledgements
Authors are grateful to UGC (University Grants Commission) for providing economical support.
References
- Landillon V., Cassan D., Morel M. H. Cuq B. Flowability, cohesive, and granulation properties of wheat powders. Journal of Food Engineering. 2008;86(2):178–193.
CrossRef - Létang C., Piau M., Verdier C. Characterization of wheat flour–water doughs (1999). Part I: Rheometry and microstructure. Journal of Engineering. 1999;41(2):121-132.
- Schober T. J., Bean R. S., Boyle L. D., Park S. H. Improved viscoelastic zein–starch doughs for leavened gluten-free breads: Their rheology and microstructure. Journal ofCereal Science. 2008;48:755–767.
CrossRef - Sivam S. A., Sun-Waterhouse D., Quek Y. S., Perera O. C. Properties of bread dough with added fiber polysaccharides and phenolic antioxidants: A review. Journal offood science. 2010;75(8):163-174.
CrossRef - Huerber R. F., Wall S. J. Fractionation and quantitative difference of glutenin from wheat varieties varying in baking quality. Journal of Cereal Chemistry. 1976;53(2):258-269.
- Payne P. I., Corfield K. G., Blackman J. A. Identification of a high-molecularweight subunit and glutenin whose presence correlated with bread-making quality in wheats of related pedigree. Theoretical and Applied Genetics. 1979;55.
- Shewry P. R., Popineau Y., Lafiandra D., Belton P.,Wheat glutenin subunits and dough elasticity: findings of the EUROWHEAT project. Trends Food Science andTechnology. 2001;11:433–41.
CrossRef - Wieser H., Koehler P. The biochemical basis of celiac disease. Journal of CerealChemistry. 2008;85(1): 1–13.
CrossRef - Raymond N., Heap J., Case S. The gluten-free diet: An update for health professionals. Practical Gastroenterology. 2006;67-92.
- Davison A. G. F., Bridges M. Coeliac disease. Clinica Chimica Acta. 1987;163:1-40.
CrossRef - Sloan E. A. move to three square meals a day, more home cooking, and an all-out cry to ‘get real’ are among the major trends reshaping the food industry in and beyond Food trends. Food Technology. 2011;65(4): 24-41.
- Collar C., Andreu P., Martínez J. C., Armero E. Optimization of hydrocolloid addition to improve wheat bread dough functionality: a response surface methodology study. Food Hydrocolloids. 1999;13(6):467- 475.
CrossRef - Sánchez H. D., Osella C. A., De La Torre M. A. Desarrollo de una fórmula para Pan sin gluten. Información Tecnológica. 1996;7(2):35-42.
- Shewry P. R., Tatham A. S., Barro F., Barcelo P., Lazzeri P . Biotechnology of breadmaking: Unravelling and manipulating the multi-protein gluten complex.Biotechnology Journal. 1995;13:1185–1190.
- Clelici M. T., El-Dash A. A. Extruded rice flour as a gluten substitute in the production of rice bread. Arch Latinoam Nutrition Journal. 2006;56:288–94.
- Kadan R. S., Phillippi B. Q. Effects of yeast and bran on phytate degradation and minerals in rice bread. Journal of Food Science. 2007;72:C208–C211.
CrossRef - Gallagher E., Gormley T. R., Arendt E. K. Crust and crumb characteristics of gluten free breads.Journal of Food Engineering. 2003;56(2):153-161.
CrossRef - Hoseney R. C., Smewing J. O. Instrumental measurement of stickiness of doughs and other foods.Journal of Texture Studies. 1999;30(2),123-136.
CrossRef - Ghodke S., Ananthnarayan L. Influence of additives on rheological characteristics of whole-wheat dough and quality of Chapatti (Indian unleavened Flat bread) Part I—hydrocolloids.Food hydrocolloids. 2007;21(1)110-117.
CrossRef - Lawless H. T., Heymann H. Sensory evaluation of food: principles and practices. Springer Science and Business Media. 2010.
CrossRef - Dem.irkesen I., Mert B., Sumnu G., Sahin S. Rheological properties of gluten-free bread formulations.Journal of food Engineering. 2010;96(2):295-303.
CrossRef - Henika R. B. Use of response-surface methodology in sensory evaluation. Food Technology. 1982;36: 96–101.
- Vidya S., Ravi R., Bhattacharya S . Effect of Thermal Treatment on Selected Cereals and Millets Flour Doughs and Their Baking Quality Food and Bioprocess Technology. 2013;6:1218–1227.
- Phattanakulkaewmorie N., Paseephol T., Moongngarm A. Chemical compositions and physico-chemical properties of malted sorghum flour and characteristics of gluten free bread. World Academy of Science, Engineering and Technology. 2011;5(7):532-538.
- Mohammed Z. I. M., Bhatawale S. P., Mehrajfatema Z. M., Mirza R. S., Mohammad U. I., Siddiqui A. N. Effect of unripe banana flour incorporation in rice papad and resistance starch content.Journal of Food Processing and Technology. 2012;3(8).
- Tiboonbun W., Sungsri-in M., Moongngarm A. Effect of replacement of unripe banana flour for rice flour on physical properties and resistant starch content of rice noodle.Journal of Engineering and Technology. 2011;81:608-611.
- Chiotellis E., Campbell G. M. Proving of bread dough II: measurement of gas production and retention. Food and Bioproducts processing. 2003 81(3):207-216.
CrossRef - Cressey, P. J., Campbell W. P., Wrigley C. W., Griffin W. B. Statistical correlations between quality attributes and grain-protein composition for 60 advanced lines of crossbred wheat. Cereal Chemistry. 1987;64(4):299-301.
- Branlard G., Dardevet M., Saccomano R., Lagoutte F., Gourdon J. Genetic diversity of wheat storage proteins and bread wheat quality. In Wheat in a global environment . Springer Netherlands. 2001;157-169.
CrossRef - Ritthiruangdej P., Parnbankled S., Donchedee S., Wongsagonsup R. Physical, chemical, textural and sensory properties of dried wheat noodles supplemented with unripe banana flour.Kasetsart Journal–Natural Science. 2011;45(3),500-509.
- Song Y., Zheng Q. Dynamic rheological properties of wheat flour dough and proteins.Trends in food science and technology. 2007;18(3):132-138.
CrossRef - Walde S. G., Jeyarani T., Misra A. K. Fatty acid profile of water chestnut flour and effect on dough rheology & cookies of wheat flour. International Journal of Applied and Pure Science and Agriculture. 2015;01 (9).
- Nash D., Lanning S. P., Fox P., Martin J. M., Blake, N. K., Souza E., Talbert L. E. Relationship of Dough Extensibility to Dough Strength in a Spring Wheat Cross. Cereal chemistry. 2006;83(3):255-258.
CrossRef - Gujral H. S., Pathak A. Effect of composite flours and additives on the texture of chapati.Journal of Food Engineering. 2002;55(2):173-179.
CrossRef - Aziah A. A., Noor A. Y., Ho L.H. Physicochemical and organoleptic properties of cookies incorporated with legume flour.International Food Research Journal. 2012;19(4).
- Hoojjat P., Zabik M. E. Sugar-snap cookies prepared with wheat-navy bean-sesame seed flour blends.Cereal Chemistry. 1984;61(1):41-44.
- McWatters., K. H. Cookie baking properties of defatted peanut, soybean, and field pea flours.Cereal Chemistry (USA). 1978.
- Sandhu K. S., Singh N. Some properties of corn starches II: Physicochemical, gelatinization, retrogradation, pasting and gel textural properties. Food Chemistry. 2007;101(4):1499-1507
CrossRef - Ghiasi K., Varriano-Marston K., Hoseney R. C., Leon A. E., Gelatinization of wheat starch. II. Starch-surfactant interaction. Cereal Chemistry. 1982;59:86.
- Barrera G. N., Perez G. T., Ribotta P. D., Rosell C. M. Effect of damaged starch levels on flour-thermal behaviour and bread staling. European Food Research and Technology. 2006;224: 187-192.
CrossRef - Zaidul I. S. M., Norulaini N. A. N., Omar A. K. M., Yamauchi H., Noda T. RVA analysis of mixtures of wheat flour and potato, sweet potato, yam, and cassava starches. Carbohydrate Polymers69. 2007;784-791.
CrossRef - Miles M.J., Morris V. J., Orford P. D., Ring S. G. The roles of amylose and amylopectin in the gelation and retrogradation of starch.Carbohydrate research. 1985;135(2):271-281.
CrossRef - Marin G., Montfort J. P. Molecular rheology and linear viscoelasticity. In: Rheology for polymer melts processing, Elsevier Science. Amsterdam, Netherland. 1996.
CrossRef - Collar C., Bollain C., Rosell C. M. Rheological behaviour of formulated bread doughs during mixing and heating.Revista de Agaroquimica y Tecnologia de Alimentos. 2007;13(2):99-107.
- de la Hera E., Martinez M., Gómez M. Influence of flour particle size on quality of gluten-free rice bread.LWT-Food Science and Technology. 2013;54(1):199-206.
CrossRef
Accepted on: 29-05-2018
Final Approval by: Dr. Daniel Cozzolino


Web of Science Coverage
Emerging Sources Citation Index (ESCI)
2024 Journal Impact Factor: 1.1
Scopus Journal Metrics
CiteScore 2025: 2.6
CiteScore Details
Sustainable Nutrition: Food Systems, Nutrient Retention, and Public Health Impact
![]()
This journal is a member of, and subscribes to the principles of, the Committee on Publication Ethics (COPE)


